MEASUREMENT OPPORTUNITIES OF LABOUR MARKET REQUIREMENTS OF UNIVERSITY STUDENTS
Péter Kollár assistant lecturer
Faculty of Economics and Social Sciences, Szent István University email: kollar.peter@gtk.szie.hu
Abstract
Competency-based education, as a representative concept addressing the educational and employee development challenges, encompasses multiple theoretical and pragmatic approaches with various scopes of analyses. In this research, the reader is tried to introduce to a data-driven- or big-data-based method. The goals of this research are to investigate how behaviour patterns related competencies can be identified and measured using the strength of log file and records, and to develop a professional system that is able to foresee training needs based on similarity analyses enabling artificial intelligence-based term-creation processes.
Keywords: competency, competence, training needs, methodology JEL classification: J24
LCC: HD4801 Introduction
Competency based approaches and competency theory play emphasized role in human development (Hecklau et al., 2016). Most likely, the reason is that researchers understood how important theoretical knowledge is, but not the be-all, end-all to a person. Employers also sought people who could contribute to the affairs of their work in more ways than just completing orders (Akkermans and Tims, 2017; Tóthné-Téglás, 2016). The difference between labour at the time of the Industrial Revolution and nowadays is evident - most notably, the methodology of labour en masse, where earlier concepts believed that monotone and automated processes (which still persist for mass production, albeit mostly done by machines) eased costs and brought further benefits has turned around. An employer of today not only wants an employee who can finish a task, but have other possibilities as well - f.e. understanding the differences between various tasks, smoothly decide what order tasks need to be completed in, and to a certain extent, understand the reason the employer decides on a task, or a routine.
(Durugy et al., 2016). As this requires a certain level of individual skills, theoretic research also established the concept of competency, which employment later adapted and made necessary to various degrees, compelling education to follow up with preparing people for these challenges, f.e. via competency-based training. (Boyatzis, 2008) From point of view of knowledge management, the worker of the Industrial Revolution used relative simply rules extracted from a holistic system. The employees here and now should be become a simulator, which is capable to derive relative robust consequences of arbitrary action – preparing optimizations through these more complex knowledge representation form.
To understand the meaning of competency-based training, a brief review of the competency phenomenon is also necessary. According to McClelland (1973) competency is the forecast indicator of personal performance. Klein and Klein part the concepts of competency and competence. While competency would define to the characteristics describable via behaviour signs and influencing performance, competence would translate to task affinity, in other words, measurability (Klein and Klein, 2008).
Vekerdy (2005) and Fehér (2011) highlight that competency in its entirety is the indicator of success, or in other words, a behavioural (or behaviour-deduced) factor related to highly exceptional performing. They proceed further with their idea, and summarise it as follows:
The characteristics of personal competencies (Elliot et al., 2017; Leutner et al, 2017; Boyatzis et al., 2017 ):
they are basic, definitive characteristics of the person,
they are in a causality relationship with effective / exceptional performance (realised results),
they can be observed in behaviour patterns, and
they are implemented in (trans)actions (who does what, and when, how?),
their existence can be forecast/simulate from the intent to act, and how deliberate it is (what someone thinks of the current situation; is he / she willing to behave in the same way in a situation that's more of a challenge),
and the previous (including currently observed, f. e. during an interview) specific behaviour,
their validity is dependent on changes in the organisational context,
and in case they're identified effectively:
they're clear, unmistakable, understandable, acceptable within the organisation.
Material and Methods
Selection of possible development routes basically begins via measuring the educational needs/requirements. In the case of competency-based training, the focus is on measuring competences, or in other words, how the person in question abides by various requirements.
All in all, one of the problems related to measuring competencies is that the behaviour indicators are usually measured on scales of either "agreement" or "resemblance", or are defined on them, and this method contains various subjective/arbitrary value decisions, be it either self- evaluation, or other 'observer' methods. They try to raise the reliability, validity and objectivity of measurement results using varied questioning and scaling techniques, subjecting them to a 360 degree evaluation system along the mainstream test thesis' definition system. Even if the competency measurement methods became more and more refined over the years, measurements clearly 'based on facts' (c.f. data-driven policy making) is still the less popular way to go. In this context, data is a measured value concerning an objective measured phenomenon where human individuals will not be used as a measuring instrument. Therefore (self)-evaluations can not be seen as real data – rather a sort of “semi- or pseudo-data” (Braun et al. 2011; Roszyk-Kowalska, 2016)
Based on these critiques, we also had to determine what competence means from the perspective of the analysis we will introduce, and grab indicators which were objective, and applicable to determining in numbers – at least ranking values. Taking all of these into consideration, we defined competence as a characteristic which can be described via a log, which is additive, and has negative and positive variants/directions. When we say described via a log, it means that behaviours, (trans)actions, activities can be recorded and measured (in a way that it's maximally independent of the observer, and can be automated). Being additive means that we can summarise the various measurement elements via addition, in other words, any observation unit-related (object - person), any attributes cannot have a value of 0, and the value of the final sum cannot be 0 either. We can also say that in case of certain activities, non- productiveness can be compensated by over-productiveness in the case of other activities.
Having negative or positive values builds on the 'the more, the better' logic. However, we have
to note that some competency-models define affinity for collective or group work, or any behaviour patterns applicable to this as the sum of various competences (Table 1.).
Table 1.: Comprehension of measurement methods Characteristics „Mainstream” competence
measurement
Fact-based competence measurement
Source opinions (semi/pseudo-data) measurements
Dependency subjective objective
Interpretation what could/would be what is
Aggregation mean norm
Form “word magic” data
Accessibility analogue digital
Source: own source
The first step was description of teamwork competency through behaviour marks. According to WHO global competency model definition of “teamwork” is: „Develops and promotes effective relationships with colleagues and team members. Deals constructively with conflicts.”
Teamwork can be described with following acts:
Works collaboratively with team members to achieve results.
Encourages co-operation and builds rapport among fellow team members.
Supports and acts in accordance with team decisions.
Accepts joint responsibility for team’s successes and shortcomings.
Following chart summarises the differences between 'classic' competence measurement, and our approach which will be further detailed below.
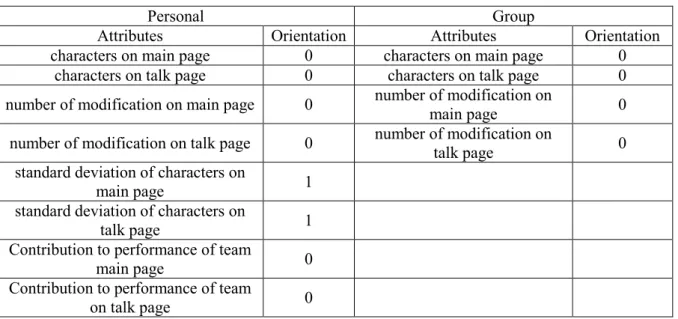
The research series' second stage was to not consider the groups as the evaluated objects, but to look at the individuals in them. The attributes and their values are summarised in the chart below, where 0= the more/higher, 1/the less/lower, the closer the person, and the group is to the ideal collective work spirit (Table 2.)
Table 2.: Attributes and orientation
Personal Group
Attributes Orientation Attributes Orientation
characters on main page 0 characters on main page 0
characters on talk page 0 characters on talk page 0
number of modification on main page 0 number of modification on
main page 0
number of modification on talk page 0 number of modification on
talk page 0
standard deviation of characters on
main page 1
standard deviation of characters on
talk page 1
Contribution to performance of team
main page 0
Contribution to performance of team
on talk page 0
Source: own source
As a sort of self-critique, we can say that chosen indicators won't necessarily lead us closer to an ideal collective worker, but are more of a quality indicator type. The group of attributes can be changed / expanded freely, as long as the proper level of assuredness / consensus on the positive / negative values stands between members of the group. Orientation can be set through a direct/invers pre-analysis: what sound more proper: An ideal team worker make no interactions with the team member or vice versa?
In case of each measured characteristic (raw phenomenon) should be analysed, whether an orientation can be set or not. It is also possible to create new indicators based on the raw variables where the orientation can be defined as trivial.
Naturally, the competencies to be analysed can be freely added as well. During the definition, it might prove useful to keep validity in perspective, meaning trying to evaluate competences which are relevant f.e. the given training or education, person, or job description.
To evaluate the teamwork-competences of the students, An experimental situation was created.
The people taking part in the analysis were 6'th semester members of the Human Resources BA, and 2'nd semester members of the Leadership and Management MSc. majors of SZIE FESS. The task that was given to their self-organised groups was to create a WIKI-based article.
The topic of the article was "The human resource management system". The contents (chapters) of the WIKI article to be written were fixed (e.g. history of the HRM, ontology of the HRM, alternative definitions of the HRM, antagonisms in definitions, test questions and their answers, references .
Each Student was given a unique username insufficient to identify the person itself, and its password, which they could use to log in to the user interface as an editor. Introducing the login protocol was required for the data to be organised into transaction-logs later. This is how we could determine who and when modified which part of the group's task in what amount/content.
Individual activities were tracked using the page history related to the article and the discussion page. The method naturally results in the fact that anything can become the "interface" between the observed person and the one doing the observation, as long as it allows for the procurement of log data.
Data were analysed using the object comparison aiming to adhere by objective component- based evaluation (COCO). The antidiscrimination model was used. Processing the results happened using Microsoft Excel. An antidiscrimination model tries to derive such kind of stair case functions which are mostly capable to approximate the principle: “each object can have the same evaluation based on different characteristics”.
The first step was to arrange the objects (groups) into a standard ranking, using the orientation of the attributes (behavioural patterns).
The next step was construction the stair-function. The rows of the matrix were the stair levels, and the columns were the observation attributes. During the later "solution" made with the SOLVER (for limited volume of OAMS)we defined that the result of taking the value of the stair after the value of the one above it can never result in a value less than one as a limiting condition, since the forcing the difference into positive guarantees that the logic of orientation holds true.
As we wrote the stair-function, we also made a goal function. The goal function was filled out with the levels calculated by Microsoft Excel's SOLVER expansion, using the FSEARCH
function. By summing the stand-in values related to each attribute, we get the estimated value as a result. The fact value was a constant (e.g. 1000 scores) according to the model's logic, which usually gets determined by constant empirical processes. In general, the higher the constant's value, the better - meaning the chances are reduced that the conclusion-values of the objects are underestimated, the only option remaining is to overestimate - which (would) signify the instability of the model.
The estimated value is then taken out of the fact value. The sum squares of differences results in the error value. Using the SOLVER, we tried to minimise the error value. We continuously re-run the SOLVER until the error value reached its lowest stable level.
Results
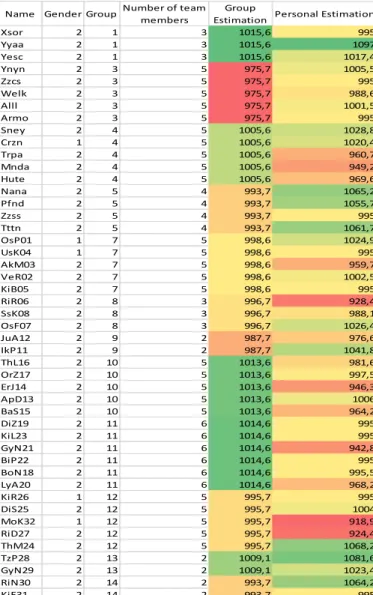
The following table (3.) contains the results. Column one lists the IDs of group members, column two is their sex (1=male, 2=female), column three is the group number, column four is the overall number of participants for the group, column five is the result of the group estimate, column six is the result of the individual estimate for the 8-attribute process, and the final, seventh column lists the individual estimate for the 4-attribute process.
Table 3.: Results of estimations
Source: own source
Name Gender Group Number of team members
Group
Estimation Personal Estimation
Xsor 2 1 3 1015,6 995
Yyaa 2 1 3 1015,6 1097
Yesc 2 1 3 1015,6 1017,4
Ynyn 2 3 5 975,7 1005,5
Zzcs 2 3 5 975,7 995
Welk 2 3 5 975,7 988,6
Alll 2 3 5 975,7 1001,5
Armo 2 3 5 975,7 995
Sney 2 4 5 1005,6 1028,8
Crzn 1 4 5 1005,6 1020,4
Trpa 2 4 5 1005,6 960,7
Mnda 2 4 5 1005,6 949,2
Hute 2 4 5 1005,6 969,6
Nana 2 5 4 993,7 1065,2
Pfnd 2 5 4 993,7 1055,7
Zzss 2 5 4 993,7 995
Tttn 2 5 4 993,7 1061,7
OsP01 1 7 5 998,6 1024,9
UsK04 1 7 5 998,6 995
AkM03 2 7 5 998,6 959,7
VeR02 2 7 5 998,6 1002,5
KiB05 2 7 5 998,6 995
RiR06 2 8 3 996,7 928,4
SsK08 2 8 3 996,7 988,1
OsF07 2 8 3 996,7 1026,4
JuA12 2 9 2 987,7 976,6
IkP11 2 9 2 987,7 1041,8
ThL16 2 10 5 1013,6 981,6
OrZ17 2 10 5 1013,6 997,5
ErJ14 2 10 5 1013,6 946,3
ApD13 2 10 5 1013,6 1006
BaS15 2 10 5 1013,6 964,2
DiZ19 2 11 6 1014,6 995
KiL23 2 11 6 1014,6 995
GyN21 2 11 6 1014,6 942,8
BiP22 2 11 6 1014,6 995
BoN18 2 11 6 1014,6 995,5
LyA20 2 11 6 1014,6 968,2
KiR26 1 12 5 995,7 995
DiS25 2 12 5 995,7 1004
MoK32 1 12 5 995,7 918,9
RiD27 2 12 5 995,7 924,4
ThM24 2 12 5 995,7 1068,2
TzP28 2 13 2 1009,1 1081,6
GyN29 2 13 2 1009,1 1023,4
RiN30 2 14 2 993,7 1064,2
KiE31 2 14 2 993,7 995
Colour codes of the estimate columns can be interpreted as thus: different shades of green indicate performance above the norm (1000 unit), while different shades of red indicate performance below the norm for the analysed competence. The average value of the estimations (in group or individual level) is always 1000.
If we interpret the chart further from the "group estimate" and "individual estimate" columns, the following statements can be made: Groups 1, 4, 10, 11 and 13 had performance above the norm. Groups 5, 7, 12 and 14 had performance close to the norm. Groups 3 and 9 had performance below the norm.
In the case of group 1, one member performed way above the norm. The other two members performed close to the norm. Possibly, the group member performing better caused their group to be above the norm due to their good performance ("one-man army/show"). Members of group 3 all had individual performances close to the norm. The group's performance is below the norm, however. In this case, group cohesion is less indicative. Similar conclusions can be drawn for group 5. The 'synergy' factor was most notably present in groups 10 and 11. Performances below the norm for individuals resulted in a group performance above the norm.
Summary
On the basis of experience the most critical factor of competency measurement is timing. Most of students who have taken part in the experiment are in the last semester. Organising, valid and reliable measuring are very hard under massive time pressure. These conditions can distort the results.
The other question is necessary to investigate the developmental lines? If it is, we have to measure the competences in the first and last semester.
After the validation of the artificial intelligence based term of competences and the attributes behind them, the method can be used for the following:
Quality control and management for diplomas issued by higher education.
Issuing competence certificates.
Stress management, where the jobs in case of persons with a lack of appropriate competence structure can cause stress too (diagnoses).
Due to the appearance of 'organisational footprints':
o Performance evaluation and performance management.
o Selection.
o Job description analysis and labour evaluation.
o Evaluation of training needs (therapy).
Evaluation of education actions, if
o competence levels will be derived before the courses o and after the courses.
Acknowledgement
This study is supported by the ÚNKP-18-3, New National Excellence Program of the Ministry of Human Capacities
References
1. Akkermans, J., Tims, M. (2017): Crafting your career: How career competencies relate to career success via job crafting. Applied Psychology, 66(1), 168-195.
2. Boyatzis, R. E. (2008): Competencies in the 21st century. Journal of management development, 27(1), 5-12.
3. Boyatzis, R., Rochford, K., & Cavanagh, K. V. (2017). Emotional intelligence competencies in engineer’s effectiveness and engagement. Career Development International, 22(1).
4. Braun, E. M., Sheikh, H., Hannover, B. (2011): Self‐rated competences and future vocational success: a longitudinal study. Assessment & Evaluation in Higher Education, 36(4), 417-427.
5. Durugy A., Kollár P., Madarász I. (2016): Eladói kompetenciák mérése próbavásárlással VEZETÉSTUDOMÁNY 47:(2) pp. 12-18.
6. Elliot, A. J., Dweck, C. S., & Yeager, D. S. (Eds.). (2017): Handbook of Competence and Motivation: Theory and Application. Guilford Publications.
7. Fehér J. (2011): Emberi erőforrás menedzsment rendszerek és módszerek, Szent István Egyetemi Kiadó, Gödöllő
8. Hecklau, F., Galeitzke, M., Flachs, S., Kohl, H. (2016): Holistic approach for human resource management in Industry 4.0. Procedia CIRP, 54, 1-6.
9. Klein B., Klein S. (2008): A szervezet lelke, EDGE 2000 Kiadó, Budapest
10. Leutner, D., Fleischer, J., Grünkorn, J., & Klieme, E. (2017). Competence assessment in education Springer International Publishing.
11. McClelland, D. C. (1973) Testing for competence rather than for intelligence.
American Psychologist, 28, p. 1-14.
12. Roszyk-Kowalska, G. (2016): Chosen methods and tools for measuring managerial competencies. Journal of Human Resource Management, 19(2), 56-62.
13. Tóthné Téglás T. (2016): Kompetencia vállalati, munkavállalói és felsőoktatási szemmel, Vállalkozásfejlesztés a XXI. században, Budapest, 2016. p 413-432.
14. Vekerdy I. (2005): Emberi erőforrás gazdálkodás. I-II. Szent István Egyetem, Gödöllő
15. WHO GLOBAL COMPETENCY MODEL:
http://www.who.int/employment/competencies/WHO_competencies_EN.pdf