STRUCTURES AND MAIN COMPETITORS ON THE INTERNAL AND GLOBAL AGRI-FOOD MARKETS
Štefan Bojnec1, Imre Fertő2
*Corresponding author E-mail: stefan.bojnec@fm-kp.si; stefan.bojnec@siol.net A R T I C L E I N F O
Review Article Received: 9 May 2019 Accepted: 14 June 2019 doi:10.5937/ekoPolj1902635B UDC 339.13.024:338.439.01(497.13:4-672EU)
A B S T R A C T
The paper investigates the key insights of European Union (EU) member states agri-food export and import structures and main competitors in the internal and global agri-food markets in terms of geographical distributions and product coverage. The focus is on four agri-food product groups in global trade: fruit and vegetable products, grain products, meat products, and dairy products. The identification of the major competitors in internal EU markets and major EU competitors in global agri-food trade by calculating revealed comparative advantage indices show considerable differences by products and product groups, but in general the major competitors of the EU member states in the analysed global agri-food markets were particularly overseas countries such as the United States of America, Canada, Argentina, New Zealand, and Australia.
© 2019 EA. All rights reserved.
Keywords:
agri-food trade patterns, assessment of competitiveness, revealed comparative
advantage, European Union JEL: F14, Q17; Q18
Introduction
This paper focuses on three research objectives: First, the identification of major export and import structures and patterns of European Union (EU) countries in terms of geographical distributions and product coverage. To arrive at this aim, we calculated both export and import shares in the global agri-food trade and export and import shares regarding the main agri-food product groups in global trade. Therefore, the main product focus was on the analysis of the main agri-food product groups, i.e. those which were the most important in value of agri-food exports and those which were typical across 1 Dr. Štefan Bojnec, Professor of Economics and Head of Department of Economics, University of Primorska, Faculty of Management, Cankarjeva 5, SI-6101 Koper, Slovenia, phone number: +386 5 610 2046, e-mail: stefan.bojnec@fm-kp.si; stefan.bojnec@siol.net, ORCID ID: (https://orcid.org/0000-0002-1270-6372)
2 DDr. Imre Fertő, Director, Institute of Economics, Centre for Regional and Economic Studies, Hungarian Academy of Sciences, Tóth K. u. 4, H-1097 Budapest, Hungary, e-mail:
ferto.imre@krtk.mta.hu, and Professor of Agricultural Economics, Kaposvár University, Guba Sándor u. 4, H-74000 Kaposvár, Hungary, phone number: +36 82 505800, e-mail:
ferto.imre@ke.hu, ORCID ID (http://orcid.org/0000-0002-3742-5964)
the EU-27 member states. This is prior of accession of Croatia, which is analysed by Buturac et al. (2017). The analysis was limited to the four agri-food product groups:
fruit and vegetable products, grain products, meat products, and dairy products. On the basis of this disaggregated commodity groups, trade analysis was conducted for the EU-27 member states. The second objective concentrated on the identification of the major competitors in internal EU markets. Finally, the third objective was to identify major EU competitors in global agri-food trade by constructing/ calculating revealed comparative advantage (RCA) indices from the available trade data.
The remainder of the paper is organised as follows: the next section presents materials and methods. The following section describes EU-27 agri-food trade structures by main products chains and discusses main findings on major competitors in the EU internal market, presents and describes RCA indices for main EU competitors in global agri- food exports. The final section derives main conclusions.
Materials and methods
The paper employs export and import shares and calculates Balassa’s (1965) revealed comparative advantage (RCA) index to investigate main EU competitors in global agri-food exports (Bojnec and Fertő, 2009, 2015a, 2017b). The RCA index empirically identifies a country’s weak and strong export sectors. The RCA index has been defined by Balassa (1965) as:
RCA = (Xij / Xit) / (Xnj / Xnt),
where X represents exports, i is a country, j is a commodity, t is a set of commodities, and n is a set of countries that is used as the benchmark of comparison for export markets. RCA is based on observed export patterns.
The results of the RCA index presented here are calculated at the World Customs Organisation’s Harmonised System (HS) at the six-digit level. The RCA measures a country’s exports of a commodity relative to its total exports and to the corresponding export performance of a set of countries, e.g. the world’s agri-food exports. If RCA >
1, then a country’s agri-food comparative advantage in the world market is revealed.
Despite some critiques of the RCA index as an export specialisation index, such as the asymmetric value problem, the problem with logarithmic transformation (De Benedictis and Tamberi, 2004) and the importance of the simultaneous consideration of the import side (Vollrath, 1991), it can provide useful evidence regarding the competitiveness of the EU-27 agri-food exports in global markets.
The UN Comtrade database - International Trade Statistics at the six-digit harmonised commodity description and coding systems (HS6-1996) is used for agri-food exports of the EU-27 countries to world markets. Agri-food trade as defined by the World Customs Organisation contains 789 product groups. The UN Comtrade database is used with the World Integrated Trade Solution (WITS) software developed by the World Bank, in close collaboration and consultation with various international organisations,
including the United Nations Conference on Trade and Development (UNCTAD), the International Trade Center (ITC), the United Nations Statistical Division (UNSD) and the WTO (2018). The UNSD (2018) Comtrade database with WITS (World Trade Integration Solution) software was used in calculations.
Results and Discussion
EU agri-food trade structures by main products chains
In a spite of the increasing importance of the BRIC-4 (Brazil, Russia, India and China) countries (Bojnec, Fertő and Fogarasi, 2015), the EU-27 remained one of the key players in the global agri-food markets, both export and import.
After the EU enlargements in 2004 and 2007, the EU-27 member states’ agri-food trade deficit first decreased, and then turned to be positive in 2010 and 2011 (Bojnec and Fertő, 2015c). The EU-27 member states that substantially contributed to the diverse surpluses were/are: the Netherlands, France, Spain, Denmark, Ireland, and Belgium among the old EU-15 member states, and Hungary, Poland, Bulgaria, and Lithuania among the new EU-12 member states.
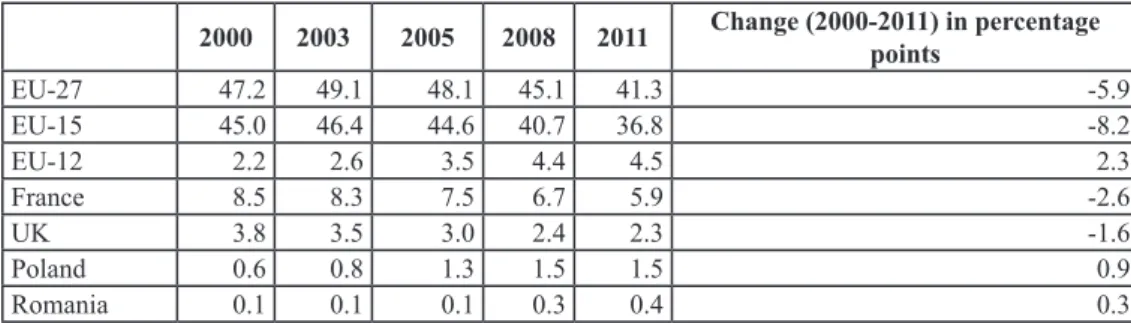
The share of EU-27 in the global agri-food exports declined from 47.2% in 2000 to 41.3% in 2011 (Table 1). However, this decrease cannot be ascribed to all member states alike but was caused by the old EU-15 member states, since their shares dropped by 8.2percentage points (henceforth pp) during in the analysed period. In comparison, the new EU member countries were even able to increase their aggregated shares by 2.3pp. The highest export shares in 2011 were achieved by the following the EU-27 member states: the Netherlands (7.4%), Germany (6.5%), France (5.9%), Belgium (3.4%), Italy (3.2%), and Spain (3.1%).
Table 1. Agri-food export shares in the world market for selected EU country groups and countries (in %)
2000 2003 2005 2008 2011 Change (2000-2011) in percentage points
EU-27 47.2 49.1 48.1 45.1 41.3 -5.9
EU-15 45.0 46.4 44.6 40.7 36.8 -8.2
EU-12 2.2 2.6 3.5 4.4 4.5 2.3
France 8.5 8.3 7.5 6.7 5.9 -2.6
UK 3.8 3.5 3.0 2.4 2.3 -1.6
Poland 0.6 0.8 1.3 1.5 1.5 0.9
Romania 0.1 0.1 0.1 0.3 0.4 0.3
Source: Authors’ calculations based on the UNSD Comtrade database with WITS (World Trade Integration Solution) software.
The EU-27 member states share in the global agri-food imports declined from 45.5% in 2000 to 40.7% in 2011 (Table 2). Moreover, the import share is slightly lower than the export share. While the old EU member states managed to decrease their share in global agri-food imports by 6.4pp – the total value of agri-food imports still increased –, the
new members’ import accounted for a larger portion of global food imports (+1.6pp).
The highest import shares took the following EU-27 member states: Germany, the Netherlands, the United Kingdom (UK), France, Italy, and Belgium. The results so far imply some correlation between import and export shares, which in turn suggest that those EU countries that export also import a lot of agri-foods and thus participate more in the global food supply chains (Bojnec and 2017a).
Table 2. Agri-food import shares in the world market for selected EU country groups and countries (in %)
2000 2003 2005 2008 2011 Change (2000-2011) in percentage points
EU-27 45.5 47.7 47.1 44.9 40.7 -4.8
EU-15 42.7 44.7 43.4 40.2 36.4 -6.4
EU-12 2.7 3.0 3.7 4.7 4.4 1.6
UK 6.4 6.6 6.6 5.4 4.7 -1.7
Italy 5.3 5.2 4.9 4.2 3.9 -1.4
Poland 0.8 0.7 1.0 1.3 1.3 0.5
Netherlands 4.3 4.6 4.3 4.7 4.8 0.5
Source: Authors’ calculations based on the UNSD Comtrade database with WITS (World Trade Integration Solution) software.
With respect to export structures, there exist some regional differences and similarities between the EU-27 member states and over time for the Broad Economic Classification (BEC) system of agri-food product groups in the global markets. Indeed, by conducting the analysis with BEC product groups, it was possible to single out some specific regional structures in the EU-27 member states agri-food imports.
The EU-27’s share in grain exports in the global markets declined from 27.3% in 2000 to 23% in 2011 (Table 3). After the EU enlargements, the grain export shares most significantly decreased for the following old EU-15 member states: France (with more than one-third of the EU-27 member states’ total grain export value, -2.6pp, Germany (-1.8pp), the UK (-1.6pp), Italy (-0.6pp), Belgium (-0.5pp), the Netherlands (-0.3pp), and Spain (-0.2pp).
Most new member states increased their shares, e.g. Romania (+0.9pp) and Poland (+0.5pp).
Table 3. Grain products export shares in the world market for selected EU country groups and countries (in %)
2000 2003 2005 2008 2011 Change (2000-2011)
in percentage points
EU-27 27.3 27.2 26.0 24.0 23.0 -4.3
EU-15 25.9 25.4 22.8 19.6 18.1 -7.8
EU-12 1.4 1.8 3.2 4.4 4.9 3.5
France 10.5 10.3 9.3 7.9 7.9 -2.6
Germany 4.8 4.0 4.0 3.6 3.0 -1.8
Romania 0.1 0.0 0.2 0.7 1.0 0.9
Poland 0.0 0.2 0.5 0.3 0.5 0.5
Source: Authors’ calculations based on the UNSD Comtrade database with WITS (World Trade Integration Solution) software.
Turning to fruit and vegetables, the export shares developed as follows: the total share of the EU-27 member states declined from around 46% at the beginning of the analysed period to around 40% at the end (Table 4). However, it has mainly been the old EU member states that experienced a sharp decline in their export shares, more precisely in total by -7.5pp, of which e.g. Italy and France accounted for -1.7pp and -1.6pp, respectively. In contrast, as the new EU members could report increasing values, e.g.
Poland (+0.5pp) and Lithuania (+0.4pp), they could improve their position and played a slightly greater/ more important role in the global grain export market (in total +0.9pp).
Table 4. Fruit and vegetable products export shares in the world market for selected EU country groups and countries (in %)
2000 2003 2005 2008 2011 Change (2000-2011)
in percentage points
EU-27 45.6 49.3 45.7 46.2 39.6 -6.6
EU-15 43.2 46.8 42.7 42.2 36.3 -7.5
EU-12 2.4 2.5 3.0 4.0 3.3 0.9
Italy 6.3 6.4 5.5 5.8 4.8 -1.7
France 5.2 5.4 4.7 4.2 3.6 -1.6
Poland 1.0 1.3 1.4 1.8 1.5 0.5
Lithuania 0.1 0.1 0.1 0.5 0.5 0.4
Source: Authors’ calculations based on the UNSD Comtrade database with WITS (World Trade Integration Solution) software.
In 2011, the EU-27 was the main supplier of dairy products to the world. Almost two thirds of the value of dairy products was provided by this group (Table 5). However, its share fell by 7.9pp from 2000 to 2011; a drop that was caused primarily by some of the old member states, e.g. France (-3.4pp) and Germany (-1.7pp). Altogether, the EU wide decline could be reduced/ weakened by slight increases in the dairy products exports shares of some new members, in particular Poland (+1.4pp) and the Czech Republic (+0.5pp).
Table 5. Dairy products export shares on the world market for selected EU country groups and countries (in %)
2000 2003 2005 2008 2011 Change (2000-2011) in percentage points
EU-27 73.3 74.6 71.1 67.4 65.4 -7.9
EU-15 70.0 71.1 65.3 60.9 59.2 -10.8
EU-12 3.3 3.5 5.8 6.5 6.2 2.9
France 13.9 13.4 12.1 11.3 10.5 -3.4
Germany 15.3 15.5 15.3 14.2 13.6 -1.7
Poland 1.0 1.2 2.6 2.6 2.4 1.4
Czech Republic 0.6 0.6 1.0 1.2 1.1 0.5
Source: Authors’ calculations based on the UNSD Comtrade database with WITS (World Trade Integration Solution) software.
In 2011, the EU-27accounted for nearly 50% of global meat trade (Table 6). But, there existed substantial differences both in the size of shares and development patterns. In
2011, the EU-27 member states with the highest meat export shares were Germany (9.2%), the Netherlands, France (4.5%), Denmark (4.1%), Spain (3.9%), Belgium (3.7%), and Poland (2.9%). However, similarly with the other products the shares of the old EU-15 member states drastically decreased, while, on average, the new EU-12 member states were able to gain export shares in global markets.
Table 6. Meat products export shares on the world market for selected EU country groups and countries (in %)
2000 2003 2005 2008 2011 Change (2000-2011) in pp
EU-27 49.1 50.0 49.4 49.8 48.4 -0.7
EU-15 46.6 46.9 45.5 45.0 42.8 -3.8
EU-12 2.5 3.1 3.9 4.8 5.6 3.1
France 7.4 6.7 5.6 5.0 4.5 -2.9
Denmark 6.9 6.5 5.8 4.9 4.1 -2.8
Germany 5.3 6.9 8.2 9.3 9.2 3.9
Poland 0.7 1.2 1.8 2.6 2.9 2.2
Source: Authors’ calculations based on the UNSD Comtrade database with WITS (World Trade Integration Solution) software.
Major competitors in the EU-27 internal market
Among the EU-27 member states, the Netherlands and Germany represented the two top agri-food importers in external-EU trade, i.e. without considering trade between EU members.
Among the agri-food exporters to the EU-27 member states, Brazil, the United States of America (USA) and Argentina occupied the top three positions (Table 7). The top ten agri-food exporters permanently included China, Switzerland, Turkey, New Zealand (except for 2011), Indonesia (except for the 2001-2005 period), Cote d’Ivoire (except for the 2005-2008 period), and Australia (except for the 2009-2011 period), whereas the following countries only temporarily held this position: South Africa (except for 2000, 2009, and 2011), Ukraine in 2008 and 2011, Chile in 2009, and India in 2011.
Table 7. Top 10 of external EU-27 agri-food importers, 2000-2011 (billion US$)
2000 country 2003 country 2005 country 2008 country 2011 country 1.38 Switzerland 1.96 Switzerland 2.14 Indonesia 3.44 South Africa 3.69 Cote d’Ivoire 1.42 Indonesia 2.10 Australia 2.40 Australia 3.64 Ukraine 3.80 Ukraine 1.57 Cote d’Ivoire 2.14 South Africa 2.54 South Africa 3.73 New Zealand 3.92 India 1.80 New Zealand 2.52 China 2.55 Switzerland 4.38 Switzerland 4.95 Turkey 1.89 Australia 2.57 Turkey 3.12 New Zealand 4.58 Indonesia 5.33 Indonesia 1.90 Turkey 2.64 Cote d’Ivoire 3.47 China 4.64 Turkey 5.91 Switzerland 2.08 China 2.70 New Zealand 3.91 Turkey 5.88 China 6.76 China 3.49 Argentina 4.97 Argentina 5.90 Argentina 12.09 United States 9.37 Argentina 6.88 Brazil 8.79 United States 8.64 United States 12.63 Argentina 12.35 United States 8.51 United States 9.87 Brazil 12.14 Brazil 21.40 Brazil 20.99 Brazil
Source: Authors’ calculations based on the UNSD Comtrade database with WITS (World Trade Integration Solution) software.
Comparative advantage index for main EU competitors in global agri-food exports Few studies have analysed countries global competitiveness in agri-food products (Sarker and Ratnasena, 2014; Jambor and Babu, 2016; Bojnec and Fertő, 2018a) and during the most recent economic crisis (Bojnec and Fertő, 2018b).
Most of the analysed BRICS-5 countries (BRIC-4 and South Africa), the North American Free Trade Agreement (NAFTA-3) countries (Canada, the USA, and Mexico), MIST-4 (Mexico, Indonesia, South Korea, and Turkey), and Tiger Cup-4 countries (Indonesia, Malaysia, the Philippines, and Thailand) were found to be competitive in agri-food exports and revealed comparative advantages (RCA>1) in global markets (Table 8).
Furthermore, existing export specialisation of countries could be proved for a smaller number of agri-food products with the RCA index. A larger number of agri-food products with RCA>1 existed for some overseas countries, such as the USA and Canada among the analysed four larger trading groups. In addition, other strong competitors in global agri-food markets were Argentina, New Zealand and Australia.
Table 8. Changes in RCA indices between 2000 and 2011 for main EU competitors in global agri-food markets
Mean Median Share RCA>1 (in %)
2000 2011 2000 2011 2000 2011
Brazil 2.289 1.823 0.128 0.082 22.8 22.1
China 1.522 0.668 0.173 0.113 26.0 19.9
India 4.089 1.899 0.165 0.097 35.0 24.9
Russia 0.287 0.219 0.016 0.009 5.1 5.7
South Africa 1.764 1.297 0.198 0.153 23.5 21.8
Mexico 0.884 0.938 0.105 0.099 18.9 19.8
Argentina 4.976 4.718 0.391 0.503 39.2 39.9
Australia 3.048 1.733 0.381 0.158 35.8 22.7
Canada 0.976 1.240 0.186 0.218 24.4 25.8
Indonesia 2.223 2.360 0.066 0.060 21.4 21.3
Japan 0.094 0.122 0.012 0.010 2.4 1.7
New Zealand 10.913 9.621 0.213 0.199 32.5 33.7
South Korea 0.268 0.194 0.023 0.009 5.2 4.6
Switzerland 0.460 0.355 0.025 0.019 12.1 6.4
Turkey 4.450 2.455 0.173 0.156 29.4 26.0
United States 1.053 1.144 0.628 0.606 36.8 36.6
Malaysia 1.133 1.244 0.066 0.110 14.0 17.2
Philippines 1.979 16.261 0.059 0.100 14.4 22.6
Thailand 2.033 1.474 0.112 0.077 21.9 21.2
BRICS 1.990 1.181 0.136 0.091 22.5 18.9
NAFTA 0.971 1.107 0.306 0.308 26.7 27.4
MIST 1.956 1.487 0.092 0.081 18.7 18.0
Tiger Cup 1.842 5.335 0.076 0.087 17.9 20.6
Source: Authors’ calculations based on the UNSD Comtrade database with WITS (World Trade Integration Solution) software.
Grain supply chain
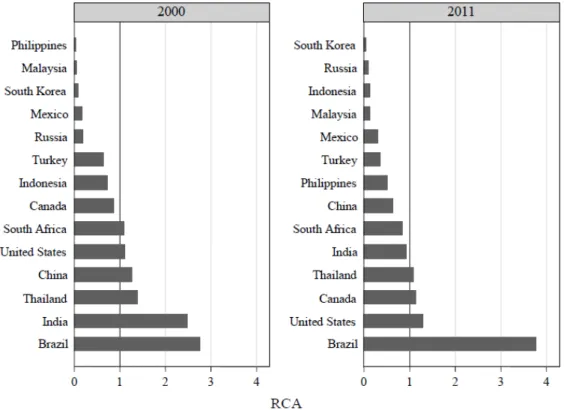
In the global grain products markets, the EU-27 member states’ export shares deteriorated slightly (Bojnec and Fertő, 2016a). The main competitors among the analysed countries were the USA, Canada, Thailand, India, Russia, and Brazil.
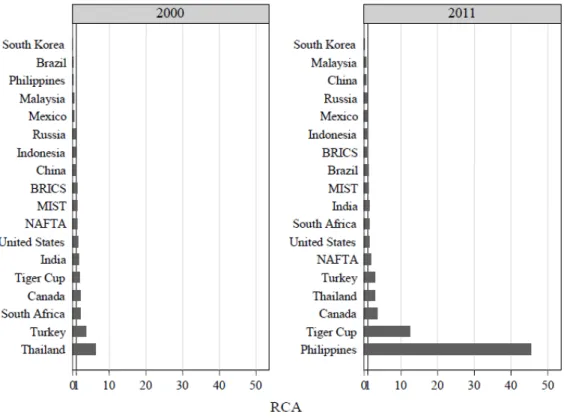
With respect to revealed comparative advantage in the global markets for grain products, Canada, the Philippines and, to a lesser extent, Brazil increased/strengthened their position (RCA>1), while the RCA>1 indices for the USA remained more stable (Figure 1). The relatively high RCA indices of Turkey and Thailand deteriorated, as well as the indices of India and South Africa.
Overall, the BRICS lost their revealed comparative advantage, while the NAFTA and especially the Tiger Cup countries gained revealed comparative advantages for grain products in this global market.
Figure 1. Mean values of RCA indices for grain products exports in global markets for main EU competitors, 2000 and 2011
Source: Authors’ calculations based on the UNSD Comtrade database with WITS (World Trade Integration Solution) software.
The analysis of grain products in the global market in a more disaggregated context with single BEC product groups renders a more detailed picture. The analysis considered the following product groups: BEC 21 with primary grain products, BEC 111 with primary grain
products mainly for industry, BEC 121 with processed grain products mainly for industry, and finally BEC 122 with processed grain products mainly for household consumption.
For BEC 21, Canada, the USA, South Africa and Brazil increased their revealed comparative advantages (RCA>1 indices).
For BEC 111, Canada, the USA, India, and Thailand (with some annual variations) strengthened their revealed comparative advantages (RCA>1 indices), while China and Turkey lost ground and achieved revealed comparative disadvantages (RCA<1 indices).
Turning to BEC 121, Canada, the Philippines, Mexico, and with annual variations particularly Indonesia and Turkey strengthened their revealed comparative advantage (RCA>1 indices), while Thailand scored/ yielded relatively high RCA>1 indices, and India and South Africa suffered deteriorations of their RCA>1 indices. Finally, the USA and particularly Russia lost their revealed comparative advantage (RCA>1 indices) to develop reveal comparative disadvantage (RCA<1 indices).
Finally, in the global markets for BEC 122, Turkey and Canada gained revealed comparative advantages (RCA>1 indices). The relatively high RCA>1 indices of Thailand deteriorated, and some of India’s RCA>1 indices also declined, while the USA lost their revealed comparative advantage in 2011.
Fruit and vegetable products supply chain
The global fruit and vegetables products markets developed as follows: The EU-27 member states’ export shares slightly declined (Bojnec and Fertő, 2016b). The USA, though with a slight deterioration over time and China with increasing significance, were the most important competitors in these markets. Turkey, Thailand, India and South Africa also could increase their importance, whereas Brazil and Canada lost importance.
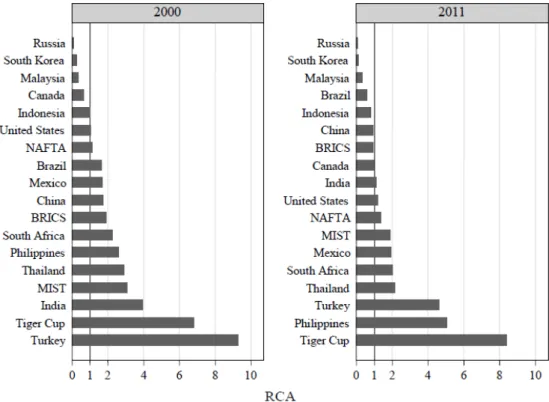
Among the countries with revealed comparative advantages (RCA>1 indices) in these markets, Mexico, the Philippines, and the USA strengthened their revealed comparative advantages during the most recent years, while some deterioration of relatively high RCA indices were observed for Turkey, India, Thailand, and, to a lesser extent, for South Africa.
Overall, the BRICS lost their revealed comparative advantage, and the MIST experienced declines in their revealed comparative advantages. Nevertheless, the NAFTA and the Tiger Cup countries increased their revealed comparative advantages (Figure 2).
The analysis of disaggregated product groups within the fruit and vegetable products supply chain was conducted with MTN groups, namely: MTN 1201 with fruit and vegetables fresh or dried, MTN 1202 with fruit and vegetables semi-processed and MTN 1203 – fruit and vegetables prepared or preserved.
South Africa, Mexico, the Philippines, the USA and, to a lesser extent, Canada increased their revealed comparative advantage (RCA>1 indices) in the global market for MTN 1201, while Turkey and Thailand had to face a slight deterioration of their relatively higher values of the RCA indices.
For MTN 1202, Mexico gained revealed comparative advantages (RCA>1 indices).
The very high RCA indices of India and Turkey declined, and China also saw a slight decline in the revealed comparative advantage (RCA>1).
Finally, in the global market for MTN 1203, the Philippines strengthened its revealed comparative advantage (RCA>1 indices). Turkey and Thailand lost as their very high RCA indices declined, while China, India, and South Africa only observed slight declines in the revealed comparative advantage (RCA>1).
Figure 2. Mean values RCA indices for fruit and vegetables products exports in global markets for main EU competitors, 2000 and 2011
Source: Authors’ calculations based on the UNSD Comtrade database with WITS (World Trade Integration Solution) software.
Dairy products supply chain
The EU-27 member states remained the major player for dairy products exports (Bojnec and Fertő, 2014a). However, the USA increased its export shares for dairy products in these global markets.
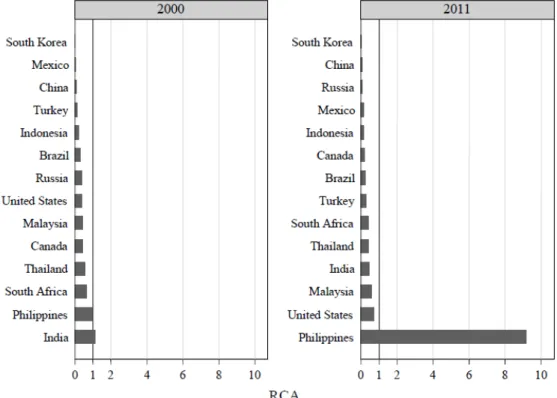
The Philippines strengthened its revealed comparative advantages (RCA>1 indices), while India lost its revealed comparative advantages (Figure 3).
Again, the more detailed analysis of the global markets is conducted with BEC product groups, namely BEC 22 with industrial dairy supplies not elsewhere specified, BEC 112 –
primary dairy products mainly for household consumption, BEC 121with processed dairy mainly for industry and BEC 122 – processed dairy mainly for household consumption.
Within BEC 22, none of the analysed countries achieved a revealed comparative advantage (RCA>1 indices). India and Russia were the only ones that lost their revealed comparative advantage within this product group.
The same holds true for BEC 112. Here as well, none of the analysed countries had a revealed comparative advantage (RCA>1 indices).
Figure 3. Mean values of RCA indices for dairy products exports in global markets for main EU competitors, 2000 and 2011
Source: Authors’ calculations based on the UNSD Comtrade database with WITS (World Trade Integration Solution) software.
In the category BEC 121, the USA strengthened its revealed comparative advantage (RCA>1 indices), while the RCA>1 indices of India deteriorated. Brazil and Canada lost their revealed comparative advantages.
For BEC 122 products, the Philippines and, to a lesser extent, Malaysia strengthened their revealed comparative advantage (RCA>1 indices).
Meat products supply chain
The EU-27 member states’ export shares in the world’s meat products markets deteriorated slightly (Bojnec and Fertő, 2014b). Among the analysed countries, the
main competitors developed differently: the USA faced declining export shares, while Brazil increased its export shares. The same went for other less important competitors.
E.g. Canada and China dealt with declining export shares, whereas India and Thailand emerged with increasing export shares.
With respect to revealed comparative advantages, Brazil, Canada and, to a smaller degree, the USA achieved growing RCA>1 indices in the global markets for meat products, while Thailand saw/ experienced some deteriorations in the RCA>1 indices (Figure 4). India, China, South Africa and Indonesia lost their revealed comparative advantage (RCA>1 indices), and in 2011 even experienced revealed comparative disadvantages (RCA<1 index).
Figure 4. Mean values of RCA indices for meat products exports in global markets for main EU competitors, 2000 and 2011
Source: Authors’ calculations based on the UNSD Comtrade database with WITS (World Trade Integration Solution) software.
As with most of the other product groups, the global markets for disaggregated meat products was analysed using the BEC classification: BEC 21 – primary meat products, BEC 22 – industrial meat supplies not elsewhere specified; processed, BEC 121 – processed meat mainly for industry, and BEC 122 – processed meat mainly for household consumption.
In markets for BEC 21, Canada, the USA, Brazil, South Africa, the Philippines, and Thailand increased their revealed comparative advantage (RCA>1 indices). A deterioration pattern in development in the relatively high RCA>1 indices was observed for China and India, while Turkey lost its revealed comparative advantage.
In the group BEC 22, the USA improved its revealed comparative advantage (RCA>1 indices), while South Africa lost its revealed comparative advantage.
For the global BEC 121 markets, the same developments were true, although with different countries: here, Canada increased its revealed comparative advantage (RCA>1 indices), while Brazil and Mexico lost their revealed comparative advantage.
Finally, as regard BEC 122, Brazil strengthened, and on a smaller scale Canada and the USA, its revealed comparative advantage (RCA>1 indices). Thailand experienced deteriorations in its RCA>1 indices, while India and Indonesia lost their revealed comparative advantage.
Conclusions
This paper intended to identify significant products and major competitors in the international and internal EU markets. The empirical results show that the EU-27 member states remain one of the larger players in the global agri-food markets on both the export and import side.
After the EU enlargements in 2004 and 2007, the EU-27 member states agri-food trade deficit was first reduced, and then switched to be positive in 2010 and 2010. The EU-27 member states, which significantly contributed to the agri-food trade surpluses, were: among the old EU-15 member states the Netherlands, France, Spain, Denmark, Ireland, and Belgium, and among the new EU-12 member states Hungary, Poland, Bulgaria, and Lithuania.
With respect to major agri-food export patterns, expressed as share of the EU-27 member states in the global agri-food exports, the whole EU-27 faced a decline, from 47.2% in 2000 to 43.3% in 2011. The highest export shares went with the following EU-27 member states: the Netherlands, Germany, France, Belgium, Spain and Italy.
On the other hand, as regards major import patterns, which are measured by the EU-27 member states share in the global agri-food imports, the corresponding share decreased from 46.5% in 2000 to 40.7% in 2011. The EU-27 member states import share was slightly lower than the export share. The highest import shares were received by the following EU-27 member states: Germany, the Netherlands, the UK, France, Italy, and Belgium.
Moreover, the results imply some correlation between import and export shares.
The EU-27 member states share in the grain exports in the global markets declined from 27.3% in 2000 to 23.0% in 2011. After the EU enlargements, the grain export shares were reduced, this was particularly true for the most important old EU-15 member states grain exporters: France (which accounted for more than one-third of export share of the EU-27 member states grain exports), Germany, the UK, Italy, Belgium, the Netherlands, and Spain. Most new EU-12 member states increased their export shares in the global grain markets.
The EU-27 member states’ fruit and vegetable export shares declined from around 46%
at the beginning of the analysed period to around 40% at the end of the analysed period.
This overall decline was also reflected in the decline of the main EU-27 exporters within this market, namely Spain, the Netherlands, Italy, Belgium, France, Greece, and the UK.
The EU-27 member states achieved a close to 50% export share in global meat products trade, however with substantial differences among the EU member states regarding both export shares and development patterns. The meat export shares were highest for the following of the EU-27 member states: Germany, the Netherlands, France, Denmark, Spain, Belgium, and Poland.
The EU-27 member states achieved the highest export shares in the global dairy markets, though at a decreasing level over time. So, the shares fell by 7.9 percentage points/pp from 73.3% in 2000 to 65.4% in 2011. The greatest export shares among the EU-27 member states were achieved by the following old EU-15 member states:
Germany, France, the Netherlands, and Belgium.
These results state that the EU-27 member states realised the highest, but lately deteriorating, global export shares for dairy products, relatively/ more or less stable export shares for meat products, and declining export shares for fruit and vegetables and grains. Among these four groups of agri-food products the lowest export shares went with grain products.
Regarding the second objective to identify major competitors in internal EU markets, Brazil, the USA and Argentina led the group of the top three external agri- food competitors in the EU-27 member states’ markets. This group was followed by China, Switzerland, Turkey, New Zealand, Indonesia, Cote d’Ivoire, Australia, and South Africa. In addition, Ukraine, Chile, and India emerged as important external competitors in the EU-27 member states’ agri-food markets during the most recent years of the investigated period.
Finally, regarding the third objective to identify major EU competitors in global agri- food trade, constructing revealed comparative advantage indices from appropriate trade data were calculated. The empirical analysis of the revealed comparative advantage indices using the global trade as the benchmark of comparisons identified some overseas countries from different destinations/parts of the world as major competitors of the EU-27 member states in global agri-food markets: among others the USA, Canada, Argentina, New Zealand, and Australia. The focus of the analysis was placed upon on BRICS-5 (Brazil, Russia, India, China and South Africa), NAFTA-3 (Canada, Mexico, and the USA), MIST-4 (Mexico, Indonesia, South Korea, and Turkey), and Tiger Cup-4 (Indonesia, Malaysia, the Philippines, and Thailand) countries.
The analysis of the major EU competitors in global agri-food chains concentrated on the previously identified four main groups of products: grains, fruit and vegetables, dairy and meat products.
In the global grain products markets important competitors of the EU-27 member states were the USA, Canada, Thailand, India, Russia, Brazil, Turkey and South Africa.
Canada, the Philippines and, to a lesser extent, Brazil could improve their revealed comparative advantage indices.
The USA and China turned out to be the major competitors in the global fruit and vegetables produce markets. Turkey, Thailand, India and South Africa also increased their importance and export competitiveness. Among the countries with revealed comparative advantages in these markets also appeared Mexico, the Philippines, Thailand and on a smaller scale, South Africa.
With respect to global dairy products, important competitors were the USA as well as the Philippines, particularly in the BEC 122 – processed dairy mainly for household consumption.
In the global meat products markets, the list of main competitors included – among others- the USA, Brazil, Canada, China, India, Thailand, and, in the BEC 21 (primary meat products) also South Africa and the Philippines.
Among study limitation, this is the coverage of data sample. Therefore, among issues for research in future is to update data sample with the most recent years, capturing the global economic and financial crises, and economic recovery with possible effects on agri-food trade and competitiveness.
Acknowledgements
This paper was generated as part of the COMPETE Project, Grant Agreement No.
312029 (http://www.compete-project.eu/), with financial support from the European Community under the 7th Framework Programme.
Conflict of interests
The authors declare no conflict of interest.
References
1. Balassa, B. (1965). Trade liberalization and revealed comparative advantage. The Manchester School of Economic and Social Studies, 33(2), 99-123.
2. Bojnec, Š., & Fertő, I. (2009). Agro-food trade competitiveness of Central European and Balkan countries. Food Policy, 34(5), 417-425.
3. Bojnec, Š., & Fertő, I. (2014a). Export competitiveness of dairy products on global markets: The case of the European Union countries. Journal of Dairy Science, 97(10), 6151-6163.
4. Bojnec, Š., & Fertő, I. (2014b). Meat export competitiveness of European Union countries on global markets. Agricultural and Food Science, 23(3), 194-206.
5. Bojnec, Š., & Fertő, I. (2015a). Agri-food export competitiveness in European Union countries. Journal of Common Market Studies, 53(3), 476-492.
6. Bojnec, Š., & Fertő, I. (2015b). Fruit and vegetable trade competitiveness of European Union countries. Mitteilungen Klosterneuburg Rebe und Wein, Obstbau und Früchteverwertung, 65(1), 56-71.
7. Bojnec, Š., & Fertő, I. (2015b). Does enlargement has caused intra and extra European Union agri-food trade? Bulgarian Journal of Agricultural Science, 21(1), 1-15.
8. Bojnec, Š., & Fertő, I. (2016a). Drivers of the duration of grain competitiveness in European Union countries. Journal of Agricultural Science and Technology, 18(5), 1173-1185.
9. Bojnec, Š., & Fertő, I. (2016b). Export competitiveness of the European Union in fruit and vegetable products in the global markets. Agricultural Economics – Czech (Zemědělská ekonomika), 62(7), 299-310.
10. Bojnec, Š., & Fertő, I. (2017a). Quality upgrades of EU agri-food exports. Journal of Agricultural Economics, 68(1), 269-279.
11. Bojnec, Š., & Fertő, I. (2017b). The duration of global agri-food export competitiveness. British Food Journal, 119(6), 1378-1393.
12. Bojnec, Š., & Fertő, I. (2018a). Drivers of the duration of comparative advantage in the European Union’s agri-food exports. Agricultural Economics – Czech (Zemědělská ekonomika), 64(2), 51-60.
13. Bojnec, Š., & Fertő, I. (2018b). Economic crisis and the fragility of comparative advantage in European agriculture. German Journal of Agricultural Economics, 67(3), 147-159.
14. Bojnec, Š., Fertő, I., & Fogarasi, J. (2015). Quality of institutions and the BRIC countries agro-food exports. China Agricultural Economic Review, 6(3), 379-394.
15. Buturac, G., Lovrinčević, Ž., & Mikulić, D. (2017). International competitiveness and restructuring of the Croatian food industry. Acta Oeconomica, 67(3), 435-462.
16. De Benedictis, L., & Tamberi, M. (2004). Overall specialization empirics:
techniques and applications. Open Economies Review, 15(4), 323-346.
17. Jambor, A., & Babu S. (2016). Competitiveness of Global Agriculture. Springer, Cham.
18. Sarker, R., & Ratnasena, S. (2014). Revealed comparative advantage and half-a- century competitiveness of Canadian agriculture: A case study of wheat, beef, and pork sectors. Canadian Journal of Agricultural Economics, 62(4), 519-544.
19. United Nations Statistical Division (UNSD). Commodity Trade Database (COMTRADE), Available through World Bank’s World Integrated Trade Solution (WITS), Retrieved from http://www.wits.worldbank.org (March 20, 2018).
20. Vollrath, T.L. (1991). A theoretical evaluation of alternative trade intensity measures of revealed comparative advantage. Weltwirtschaftliches Archiv, 130(2), 263-279.
21. World Trade Organisation (WTO). International Trade Statistics. Geneva: World Trade Organisation, Retrieved from http://www.wto.org/english/res_e/statis_e/
its_e.htm (March 20, 2018).