Volume X Number 4, 2018
Global Agri-food Trade Competitiveness: Gross Versus Value Added Exports
Imre Fertő
Institute of Economics, Centre for Economic and Regional Studies, Hungarian Academy of Sciences, and Kaposvár University, Hungary
Abstract
One of the most important features in the international trade over the recent decades has been the increased fragmentation of the production process. This has been facilitated, in part, by the development and maturation of global value chains (GVCs).The improved availability of value-added trade data allows us to identify more clearly what fragment in the production chain is internationally competitive in a particular country.
The paper examines global agri-food export performance in the light of these changes with special emphasis on the impacts of economic crisis using the concept of normalised revealed comparative advantage (NRCA) in terms of both gross exports and value-added for 61 countries over period 1995 and 2011. Systematically comparing these distributions reveals significant differences for NRCA based on gross exports versus value- added data.
Keywords
Global agri-food trade, revealed comparative advantage, gross and value added exports.
Fertö, I. (2018) “Global Agri-food Trade Competitiveness: Gross Versus Value Added Exports", AGRIS on-line Papers in Economics and Informatics, Vol. 10, No. 4, pp. 39-47. ISSN 1804-1930.
DOI 10.7160/aol.2018.100404.
Introduction
The international fragmentation of production has attracted much recent attention both in international trade theory (e.g. Grossman and Rossi-Hansberg, 2008; Costinot et al., 2013) and empirical work (Feenstra and Hanson, 1999; Hummels et al., 2001; Johnson and Noguera, 2012; Baldwin and Lopez-Gonzalez, 2014; Timmer et al., 2013, 2014; Koopman et al., 2014). International trade in goods has evolved, especially during the last two decades from trading mostly goods destined for final consumption to trading intermediate goods destined as inputs for further processing at least once prior to final consumption either domestically or traded abroad. Laipis (2009) shows that the majority of agricultural trade can also be considered as trade of intermediate products as commodities. The rise of new global competitors and the development of GVCs have challenged the dominance of major players in (agri-food) trade. Ceglowski (2017) finds countries’ export competitiveness in the GVC industries looks different through the lens of domestic value added than on the basis of conventional measures of gross
exports. She shows that there are significant differences in the degree of export competitiveness.
There is growing literature on various aspects of the competitiveness of European agri-food trade (e.g. Bojnec and Fertő, 2015, 2017a; Carraresi and Banterlee, 2015) but the research on global agri-food market is still limited (Bojnec and Fertő, 2017b). However, all of earlier studies are employing gross exports data to calculate various competitiveness indicators. The paper is the first attempt to analyse the global agri-food competitiveness through the lens of value added exports data. The aim of the paper is to assess countries’ agri-food export competitiveness through recently developed measures of revealed comparative advantage (RCA) that facilitate comparisons across countries. product and time.
It also expands the assessment of export performance in two important dimensions. First, it moves beyond measuring RCA based on gross exports by also calculating measures based on the domestic value added in foreign final demand. Second, we analyze systematically the differences between the two measures over the complete RCA distribution of agricultural and food exports separately.
Materials and methods
We employ the recently released Trade in Value-Added (TiVA) database published jointly by the OECD and the WTO. The TiVA database provides estimates of the value that is added by source in the production of goods and services for export, compiled from an international input–
output model. It reports estimated dollar values of several measures of the value added in trade for 61 individual countries. a rest-of-the-world residual and the world as a whole. For each country in the database, each value-added measure is reported for an aggregate total and 18 constituent industry categories. These categories are industry- based because the estimates are constructed from underlying input– output tables that are organised at the industry level. Thus, the analysis of countries RCA pertains to industries, not products. According to NACE code within 18 industries we can identify two agri-food related sectors: agriculture, hunting, forestry and fishing (agriculture: AtB) and food. beverages and tobacco (food: 15t16). We use the TiVA measures for gross exports and the domestic value added in foreign final demand.
The most widely used indicator in empirical trade analysis is based on the concept of revealed comparative advantage (RCA) index, which was developed by Balassa (1965). and its variants.
Despite some critiques of the RCA index as a static export specialisation index, such as the asymmetric value problem and the problem with logarithmic transformation (De Benedictis and Tamberi, 2004; Hoen and Oosterhaven, 2006), the importance of the simultaneous consideration of the import side (Vollrath, 1991), and the lack of a sound theoretical background (Leromain and Orefice, 2014), it remains a popular tool for analyzing export competitiveness in empirical trade literature. Recently, Yu et al. (2009, 2010) adopted an alternative measure to assess the dynamics of comparative advantage. utilizing the normalised revealed comparative advantage (NRCA) index to improve certain aspects of the original RCA index in static patterns in comparative advantage in order to create an appropriate export specialization index for comparison over space and the changes in comparative advantage and its trends over time.
Yu et al. (2009) define the NRCA index as follows:
(1)
where E denotes total world trade, Eij describes country i’s actual export of commodity j
in the world market, Ei is country i’s export of all commodities and Ej denotes export of commodity j by all countries. If NRCA>0, a country’s agri- food comparative advantage on the world market is revealed. The distribution of NRCA values is symmetrical, ranging from −1/4 to +1/4 with 0 being the comparative-advantage-neutral point.
Because it evaluates deviations from a country’s comparative-advantage-neutral point, the NRCA index avoids the original RCA’s tendency to yield higher values for countries or products with small world shares (Yu et al., 2009). The index is additive;
thus its value does not depend on the degree of aggregation. For our purposes, additivity also facilitates the construction of NRCA indices for the industry level aggregates. Due to these desirable properties, we employ the NRCA measure to assess countries’ export competitiveness in the agricultural and food sectors. The NRCA indexes are calculated for both gross exports and domestic value added in foreign final demand for both agriculture and food sectors and each of the 61 individual countries over period 1995 and 2011. Note that the data are available only for following years: 1995, 2000, 2005 and 2008- 2011.
Results and discussion
The evaluation has focused on a comparison of two different bases for measuring NRCA:
a conventional basis using gross export values and a second based on the domestic value added in foreign final demand. The median values of NRCA indices fluctuate considerable year by year from negative to positive values (Figure 1).
Source: own calculations based on OECD TiVA database Figure 1: Median values of NRCA indices by year.
Medians of value added NRCA are consistently higher than gross NRCA median
for both agriculture and food sectors, except 1995 in food sector. However, mean comparison tests and Wilcoxon signed rank tests are accept the equality of means and medians hypotheses between gross exports and value added NRCA indices (Table 1).
Source: own calculations based on OECD TiVA database Table 1: Mean and median comparison tests between gross
export and value added NRCA indices (p values).
t tests Wilcoxon signed rank test
Agriculture 0.7705 0.8190
Food 0.8285 0.1119
In addition, pattern of NRCA do not show clear trend during the analysed period.
We simply divide the sample into two sub periods;
pre-crisis (<2009), post-crisis (>2009). Kruskal- Wallis tests shows that there is not significant difference between sub periods for all of four indices (Table 2).
Source: own calculations based on OECD TiVA database Table 2: Kruskal-Wallis tests (p values).
Gross exports Value added exports
Agriculture 0.7773 0.8190
Food 0.8899 0.7525
Now we restrict our attention on countries with comparative advantage based on gross exports. Best performing countries for agriculture are China, United States, Brazil, Argentina and Indonesia using gross export NRCA indices (Figure 2).
Source: own calculations based on OECD TiVA database Figure 2: Median values of NRCA indices for agriculture
by country.
However, the ranking of top countries are not necessarily coincides between gross exports and value added NRCA. For example, China is the best performing countries in terms of gross
exports, but it lost its competitiveness in terms of value added. Similarly, one can observe relatively large gap between two indicators for the U.S.
Top five countries for food sector are Brazil, Argentina, Ireland France and Netherlands based on gross export NRCA (Figure 3). Note that China is in the middle of the rank, while the U.S. is not competitive in food sector. Furthermore, gross export NRCA indices are higher almost for all countries with comparative advantage. Visual inspection of Figure 3 also indicates that ranking based on two different indicators may not be necessary consistent. In other words difference between gross export and value added NRCA indices may larger at the country level as we can expect from the quick time series analysis. We investigate this issue later in more details.
Source: own calculations based on OECD TiVA database Figure 3: Median values of NRCA indices for food by country.
Identifying strong and weak sectors
Following Brakman et al (2017) we identify four possible sector classifications. First, a sector may reveal to have a comparative advantage for both gross export RCA and value-added RCA; we label this sector strong – strong. Second. a sector may reveal to have a comparative disadvantage for both gross export RCA and value-added RCA; we label this sector weak – weak. Third, therefore a sector may reveal to have a comparative disadvantage for gross exports and simultaneously a comparative advantage for value added trade; we label this sector weak – strong. Finally, a sector may reveal to have a comparative advantage for gross exports and simultaneously a comparative disadvantage for value added trade; we label this sector strong – weak.
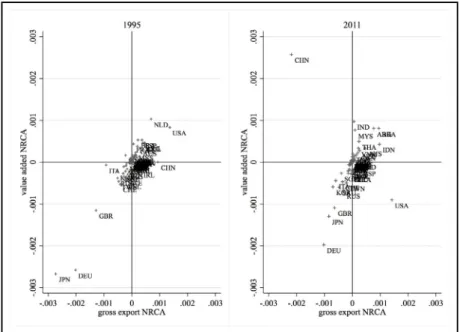
First, we employ the scatterplot of the agriculture aggregate for the entire sample of 61 countries to show country position based on both
NRCA measures in starting and ending years (Figure 4). Visual inspection of scatterplots indicate that majority of countries are lying around the diagonals with few exceptions (e.g. China and U.S in 2011). Top (strong-strong) countries in 1995 are Netherlands and U.S., whilst bottom (weak-weak) countries are Japan, Germany and UK.
The situation has remained the same on the bottom part of rank, but one can observe considerable changes among top countries at the end of analyzed period. Most striking observation is that U.S. has
lost its competitiveness in terms of value added and one can find emerging countries in the top performers including Argentina, Brazil, India, Indonesia Malaysia and Thailand.
The scatterplots are flatter for food sectors in both year indicating larger gap in values between gross exports and value added NRCA indices (Figure 5). Top (strong-strong) countries in 1995 are Netherlands and Thailand, whilst bottom (weak-weak) countries are Japan, Germany and U.S.
The situation has slightly changed on the bottom part of rank, some countries were able to improve
Source: own calculations based on OECD TiVA database
Figure 4: Gross versus value added NRCA for agriculture.
Source: own calculations based on OECD TiVA database
Figure 5: Gross versus value added NRCA for food.
their relative position including Germany and U.S.
Similarly to agriculture, emerging countries are performing even better.
Table 3 provides an overview of the sector classification for all countries over the period 1995 and 2011. The weak-weak class and strong- strong class covers the majority of observations in agriculture ranging between 70 and 83 percent altogether with considerably yearly fluctuations.
Remaining part of observations are roughly evenly distributed between strong-weak and weak strong sectors. The picture is similar for food sector, with wider range in the share of weak-weak and strong-strong sectors (75-90). These classes include 80-95 percent of observations. The share of weak strong group is higher than strong-weak class.
Consistency between gross exports and value added based measures
Following Fertő and Hubbard (2003) we check the consistency of NRCA indices based on gross exports and value added exports. Ballance et al. (1987) suggest some simple statistical tests for examining the extent to which various RCA indices are consistent in their identification of comparative advantage. The usual interpretation of an RCA index is that it identifies the extent to which a country has a comparative (dis)advantage in a product. Ballance et al. (1987) offer two other interpretations: that the index provides a ranking of products by degree of comparative advantage;
and that the index identifies a binary type demarcation of products based on comparative
advantage and comparative disadvantage. Referring to these three interpretations as cardinal, ordinal and dichotomous. they suggest a test of consistency for each.
The consistency test of the indices as cardinal measures of comparative advantage is based on the correlation coefficient between paired indices in each of the seven years and the whole period (Table 4). For agriculture, of the seven possible pairings, five (1995-2009) show a high level of correlation (≥ 0.83). Estimations present low level of correlation coefficients for last two years inflating the correlation coefficient for total sample (0.60). This suggests that the indices are still relatively consistent as cardinal measures of comparative advantage. Our calculations suggest that NRCA indices of total sample are more consistent as a cardinal measure for food industry (0.74), with lower correlation coefficients within period except last two years.
The consistency test of the indices as ordinal measures is similar but based on the rank correlation coefficient for each pairing. Results show that the indices are slightly more consistent in ranking countries by NRCA for food industry than agriculture. The test of the indices as a dichotomous measure is simply the share of countries in which both of the paired indices suggest comparative advantage or comparative disadvantage. This test indicates that all two of our indices are reasonably consistent, with all cases being ≥ 80 per cent.
Contrary to earlier tests, results are slightly better for food industry.
Source: own calculations based on OECD TiVA database
Table 3: Overview of sector classification in per cent.
sector period weak-weak strong-weak weak-strong strong-strong
agriculture 1995 45.9 9.8 9.8 34.4
2000 34.4 11.5 11.5 42.6
2005 31.1 21.3 8.2 39.3
2008 39.3 9.8 8.2 42.6
2009 32.8 16.4 6.6 44.3
2010 39.3 9.8 9.8 41.0
2011 37.7 8.2 11.5 42.6
total 41.9 7.7 9.4 41.0
food 1995 49.2 1.6 3.3 45.9
2000 44.3 8.2 3.3 44.3
2005 42.6 6.6 18.0 32.8
2008 44.3 4.9 14.8 36.0
2009 44.3 3.3 9.8 42.6
2010 47.5 3.3 11.5 37.7
2011 36.1 11.5 13.1 39.3
total 43.3 6.3 13.1 37.2
Source: own calculations based on OECD TiVA database
Table 4: Consistency tests for gross and value added based on NRCA indices.
Cardinal tests Ordinal tests Dichotomous tests
Agriculture Food Agriculture Food Agriculture Food
1995 0.9126 0.8997 0.8011 0.8097 82.0 80.3
2000 0.8632 0.8730 0.7581 0.8581 85.2 80.3
2005 0.8498 0.7231 0.8636 0.7315 86.9 75.4
2008 0.8617 0.5806 0.8091 0.7962 83.6 80.3
2009 0.8361 0.6886 0.8252 0.8491 82.0 86.9
2010 0.2182 0.7984 0.6509 0.8084 80.3 85.2
2011 0.0557 0.4977 0.6524 0.6123 80.3 75.4
total sample 0.5970 0.7401 0.7631 0.7851 82.9 80.6
Stability of classification of strong and weak sectors
The stability of sector classification that of the value of the NRCA index for particular product groups, is analyzed in two ways. First, we employ transition probability matrices to identify the persistence and mobility of classification of sectors as measured by the NRCA index. Second, the degree of mobility in patterns of specialisation can be summarised using indices of mobility. These formally evaluate the degree of mobility throughout the entire distribution of B indices and facilitate direct cross- country comparisons. The first of these indices (M1, following Shorrocks, 1978) evaluates the trace (tr) of the transition probability matrix. This index thus directly captures the relative magnitude of diagonal and off-diagonal terms and can be shown to equal the inverse of the harmonic mean of the expected duration of remaining in a given cell.
, (2) where K is the number of cells, and P is the transition probability matrix.
The second index (M2, after Shorrocks, 1978;
and Geweke et al., 1986) evaluates the determinant (det) of the transition probability matrix.
. (3)
In both indices, a higher value indicates greater mobility, with a value of zero indicating perfect immobility.
Furthermore, to test the equality of different Markov transition probabilities we apply Anderson and Goodman’s (1957) test statistics, which under null hypothesis , for each state i has an asymptotic distribution:
, where m is the member of states, pij are the estimated, are the probabilities under null, and nt(t) describes the number of sectors in cell i at time t.
Information on the dynamics of the competitiveness classification can be obtained by analysis of Markovian transition matrices, showing the probability of passing from one state to another between the starting year (1995) and the end year (2011). We employ pooled data with one year lag. The transition matrix in Table 5 suggests that classification of the NRCA index are fairly persistent for observations with weak- weak and strong-strong sectors in agriculture.
The diagonal elements for these class are 0.88-0.89, indicating a high probability that a country with a weak-weak or strong-strong sectors will have the same status at the end of the period.
However, indices in classes strong-weak and weak-strong display considerable variation in their pattern. The probability of moving from strong-weak status to weak-strong and strong- strong groups is relatively high (0.31-0.31). There is a small chance of moving from class weak- strong to class strong-strong. However there is considerable chance of moving from the weak- strong class to the weak-weak class. Anderson and Goodman’s (1957) test reject the equality of Markov transition probability matrices relative to as estimated benchmark. In other words, changes across different NRCA classes are significant.
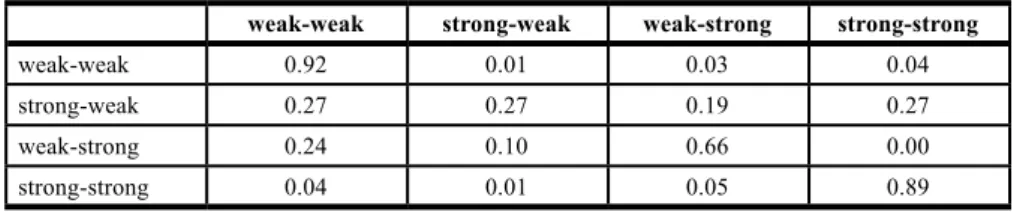
Table 6 presents the Markov transition probability matrix for the food sector. Estimation indicates that, similarly to agriculture, typology of the NRCA index is fairly persistent for observations with weak-weak and strong-strong sectors
Source: own calculations based on OECD TiVA database
Table 5: Markov matrix for agriculture.
weak-weak strong-weak weak-strong strong-strong
weak-weak 0.88 0.07 0.05 0.00
strong-weak 0.19 0.19 0.31 0.31
weak-strong 0.47 0.16 0.26 0.11
strong-strong 0.00 0.05 0.05 0.90
Source: own calculations based on OECD TiVA database
Table 6: Markov matrix for food.
weak-weak strong-weak weak-strong strong-strong
weak-weak 0.92 0.01 0.03 0.04
strong-weak 0.27 0.27 0.19 0.27
weak-strong 0.24 0.10 0.66 0.00
strong-strong 0.04 0.01 0.05 0.89
(0.89-0.92). The probability of staying with weak-strong class is still relatively high (0.67). The strong-weak class present a high level mobility with relatively equal distribution.
Anderson and Goodman’s (1957) test reject the equality of Markov transition probability matrices relative to as estimated benchmark.
Table 7 reports the mobility indices, M1, and M2 which summarize the degree of mobility in the typology of NRCA indices. Estimations suggest that the classification of NRCA for food sector is less mobile than for agriculture.
Source: own calculations based on OECD TiVA database Table 7: Mobility indices for Markov matrix.
Mobility index Agriculture Food
M1 0.593 0.416
M2 0.870 0.491
Conclusion
One of the most important features in the international trade over the recent decades has been the increased fragmentation of the production process. This has been facilitated, in part. by the development and maturation of global value chains (GVCs). The rise of new global competitors and the development of GVCs
have challenged the dominance of major industrial countries in trade. There is an increasing literature on value added trade on manufacturing industries and service sectors. but research on agricultural and food trade is still limited.
We present an analysis of comparative advantage using gross export trade data and value added trade data focusing on agricultural and food trade.
With respect to comparative advantage the differences between the two types of data are often illustrated by means of examples using a few sectors; usually measures of RCAs calculated with gross export data are compared with RCAs calculated with value added data. Systematically comparing these distributions shows that the distributions of NRCA calculated with gross exports and value added data are indeed significantly different from each other. Our results indicate that a value-added approach to assessing NRCA can provide further insights that are not apparent from an exclusive focus on gross exports.
Acknowledgements
This paper was generated as part of the project:
NKFI-115788 “Economic crises and international agricultural trade”.
Corresponding authors Professor Imre Fertő
Institute of Economics, Centre for Economic and Regional Studies, Hungarian Academy of Sciences, Tóth K. u. 4, H-1097 Budapest, Hungary
and Kaposvár University, Kaposvár Guba S.. 40, H-7400, Hungary Email: ferto.imre@krtk.mta.hu
ORCID: orcid.org/0000-0002-3742-5964
References
[1] Anderson, T. W. and Goodman, L. A. (1957) “Statistical inference about Markov chains“, Annals of Mathematical Statistics, Vol. 28, No. 1, pp. 89-110. [Online]. Available: https://www.jstor.org/
stable/2237025 [Accessed: 15 Aug. 2018].
[2] Balassa, B. (1965) “Trade liberalization and revealed comparative advantage“, The Manchester School of Economic and Social Studies, Vol. 33, No. 2, pp. 99-123.
DOI 10.1111/j.1467-9957.1965.tb00050.x.
[3] Baldwin. R. and Lopez-Gonzalez. J. (2015) “Supply-chain Trade: A Portrait of Global Patterns and Several Testable Hypotheses“, The World Economy, Vol. 38, No. 11. pp. 1682-1721.
E-ISSN 1467-9701, ISSN 0378-5920. DOI 10.1111/twec.12189.
[4] Ballance, R. H., Forstner, H., and Murray, T. (1987) “Consistency tests of alternative measures of comparative advantage“, The Review of Economics and Statistics, Vol. 69, No. 1, pp. 157-161.
DOI 10.2307/1937915.
[5] Bojnec, Š., and Fertő, I. (2015) “Agri-food export competitiveness in European Union countries“, JCMS: Journal of Common Market Studies, Vol. 53, No. 3, pp. 476-492. E-ISSN 1468-5965.
DOI 10.1111/jcms.12215.
[6] Bojnec, Š., and Fertő, I. (2017a) “Duration of global agri-food export competitiveness“, British Food Journal, Vol. 119, No. 6, pp.1378-1393, ISSN 0007-070X. DOI 10.1108/BFJ-07-2016-0302.
[7] Bojnec, Š., and Fertő, I. (2017b) “Quality Upgrades of EU Agri-Food Exports“, Journal of Agricultural Economics, Vol. 68, No. 1, pp. 269-279. ISSN 1477-9552.
DOI 10.1111/1477-9552.12204.
[8] Brakman. S., and Van Marrewijk. C. (2017) “A closer look at revealed comparative advantage:
Gross-versus value-added trade flows“, Papers in Regional Science, Vol. 96, No. 1, pp. 61-92.
E-ISSN 1435-5957. DOI 10.1111/pirs.12208.
[9] Carraresi, L., and Banterle, A. (2015) “Agri-food Competitive Performance in EU Countries:
A Fifteen-Year Retrospective“, International Food and Agribusiness Management Review, Vol. 18, No. 2, pp. 37-62. E-ISSN 1559-2448.
[10] Ceglowski. J. (2017) “Assessing Export Competitiveness through the Lens of Value Added“, The World Economy, Vol. 40, No. 2, pp. 275-296. E-ISSN 1467-9701, ISSN 0378-5920.
DOI 10.1111/twec.12362.
[11] Costinot. A., Vogel, J., and Wang, S. (2013) “An Elementary Theory of Global Supply Chains“, Review of Economic Studies, Vol. 80, No. 1, pp. 109–144. E-ISSN 1467-937X, ISSN 0034-6527.
DOI 10.1093/restud/rds023.
[12] De Benedictis, L., and Tamberi, M. (2004) “Overall specialization empirics: techniques and applications“, Open Economic Review, Vol. 15, No. 4, pp. 323-346. E-ISSN 1573-708X, ISSN 0923-7992. DOI 10.1023/B:OPEN.0000048522.97418.99.
[13] Feenstra, R. C. and Hanson, G. H. (1999) “The Impact of Outsourcing and High-Technology Capital on Wages: Estimates for the U.S.. 1979-1990“, Quarterly Journal of Economics. Vol. 114, pp. 907-940. E-ISSN 1531-4650, ISSN 0033-5533. DOI 10.1162/003355399556179.
[14] Fertő, I. and Hubbard, L. J. (2003). “Revealed comparative advantage and competitiveness in Hungarian agri-food sectors“, The World Economy, Vol. 26, No. 2, pp. 247-259.
E-ISSN 1467-9701, ISSN 0378-5920. DOI 10.1111/1467-9701.00520.
[15] Geweke, J., Marshall, R. C. and Zarkin, G. A. (1986) “Mobility indices in continuous time Markov chains“, Econometrica, Vol. 54, No. 6, pp. 1407-1423. E-ISSN 1468-0262. ISSN 0570-1864.
DOI 10.2307/1914306.
[16] Grossman, G. M. and Rossi-Hansberg, E. (2008) “Trading Tasks: A Simple Theory of Offshoring“, American Economic Review, Vol. 98, No. 5, pp. 1978-1997. ISSN 0002-8282.
DOI 10.1257/aer.98.5.1978.
[17] Hoen, A. R. and Oosterhaven, J. (2006) “On the measurement of comparative advantage“, Annals of Regional Sciences, Vol. 40, No. 3, pp. 677-691. E-ISSN 1432-0592, DOI 10.1007/s00168-006-0076-4.
[18] Hummels. D., Ishii, J., and Yi, K.-M. (2001) “The Nature and Growth of Vertical Specialization in World Trade“, Journal of International Economics, Vol. 54, No. 1, pp. 75-96. ISSN 0022-1996.
DOI 10.1016/S0022-1996(00)00093-3.
[19] Johnson, R. C. and Noguera, G. (2012) “Accounting for Intermediates: Production Sharing and Trade in Value Added“, Journal of International Economics, Vol. 86, No. 2, pp. 224-236.
ISSN 0022-1996. DOI 10.1016/j.jinteco.2011.10.003.
[20] Koopman, R., Wang. Z. and Wei. S. J. (2014) “Tracing Value-Added and Double Counting in Gross Exports“, American Economic Review, Vol. 104, No. 2, pp. 459-94. ISSN 0002-8282.
DOI 10.1257/aer.104.2.459.
[21] Leromain, E., and Orefice, G. (2014) “New revealed comparative advantage index: Dataset and empirical distribution“, International Economics, Vol. 139, pp. 48-70. ISSN 2110-7017.
DOI 10.1016/j.inteco.2014.03.003.
[22] Liapis, P. (2009) “Extensive Margins in Agriculture“, OECD Food, Agriculture and Fisheries Working Papers, No. 17, OECD Publishing. ISSN 18156797. DOI 10.1787/18156797.
[23] Shorrocks, A. F. (1978) “Income Inequality and Income Mobility“, Journal of Economic Theory, Vol. 19, No. 2, pp. 376-393. ISSN 0022-0531. DOI 10.1016/0022-0531(78)90101-1.
[24] Timmer, M. P., Erumban, A. A., Los, B., Stehrer, R. and de Vries, G. J. (2014) “Slicing Up Global Value Chains“, Journal of Economic Perspectives, Vol. 28, No. 2, pp. 99-118. ISSN 08953309.
DOI 10.1257/jep.28.2.99.
[25] Timmer. M. P.. Los, B., Stehrer, R. and de Vries, G. J. (2013) “Fragmentation. Incomes and Jobs.
An Analysis of European Competitiveness“, Economic Policy, Vol. 28, No. 76. pp. 613-661. E-ISSN 1468-0327, ISSN 0266-4658. DOI 10.1111/1468-0327.12018.
[26] Vollrath, T. L. (1991) “A Theoretical Evaluation of Alternative Trade Intensity Measures of Revealed Comparative Advantage“, Weltwirtschaftliches Archiv, Vol. 130, No. 2, pp. 265-279.
ISSN 00432636. DOI 10.1007/BF02707986.
[27] Yu, R., Cai, J. and Leung, P. S. (2009) “The normalized revealed comparative advantage index“, Annals of Regional Sciences, Vol. 43, No. 1, pp. 267–282. E-ISSN 1432-0592, ISSN 0570-1864.
DOI 10.1007/s00168-008-0213-3.
[28] Yu, R., Cai, J, Loke, M. K. and Leung, P. S. (2010) “Assessing the comparative advantage of Hawaiis agricultural exports to the US mainland market“, Annals of Regional Sciences, Vol. 45, No. 2, pp. 473-485. E-ISSN 1432-0592, ISSN 0570-1864. DOI 10.1007/s00168-009-0312-9.