Miklos Vasary
budapest metropolitan university, Hungary
THE EXPECTED iMPACT OF BREXiT FOR ViSEGRÁD COUNTRiES1 Oczekiwany wpływ Breixtu dla krajów Grupy wyszehradzkiej Key words: United Kingdom, Brexit, Trade, Visegrad Countries
Slowa kluczowe: Wielka Brytania, Brexit, handel, kraje Visegrád jel codes: Q17, F13
Abstract. As a result the UK will leave the EU intratrade will be changed significantly. Altough the UK trade with the Visegrad countries is not the most important, it is necessary to review the current flow and to present the relations related the agricultural and food sector. Based on the EU intratrade values of Eu- rostat, it can be describe that processed products are mainly involved in uk-V4 bilateral trade and from the V4 group Poland has a significant role.
introduction
on 23 June 2016, the united kingdom (uk) voted in a referendum to leave the european Union (EU). Article 50 of the Treaty of Lisbon2 was triggered on 29 march 2017 to start the process of UK leaving the EU. In this relation the agricultural affairs will be one of the utmost importance3. UK present is one of the most significant agriculture within the EU. In 2017, farmers cultivated 17.5 million ha, of which 3.2 million ha were grown on cereals. 1.9 million cattle and 5.0 million pigs and 34.8 million sheep and goats were held, and 474 thousand people were employed in agriculture [DEFRA 2018]. The UK agriculture produced less than 1% of total domestic GDP [DEFRA 2018]. More comprehensively, the UK agri-food industry produced a total gross value added of 10.3 billion pounds. In addition, the value of food, feed and beverage (FFB) exports grew in 2017 to 22.0 billion pounds during the year 2016, while the import value of the same product range was increased to 46.2 billion pounds. Thus, the trade deficit widened related to previous year by 6.2% to £24.2 billion pounds. Whisky had the highest export value, totalling £4.5 billion and the fresh fruit and vegetables together remain the highest value import categories totalling £6.2 billion. With these results, surprising but significant agri- and food trade is needed to meet internal consumption. In the case of foods, the United Kingdom can only produce 61% of its needs.
It is important to analyse trade flows and to point out the expected impacts to map the expec- ted consequences. Within this the overall aim is to describe the United Kingdom's foreign trade conditions and the agricultural trade as well. In addition to the general characterization, it is important to focus on the Visegrad countries, which have been getting closer trade connections to the UK since the beginning of EU membership. It is important to reveal the importance of V4s between Central and Eastern European countries. And it is necessary to determine which product group positions will be converted connecting the exit.
1 The study was made with the support of the János Bolyai Research Scholarship.
2 It gives to all EU member state the right to quit unilaterally form the EU. It gives the leaving country two years to negotiate an exit deal and once it's set in motion it can't be stopped except by unanimous consent of all member states [EC 2017].
3 technically it is interesting that the second most legislation concerns, after foreign relations, 3,172 pieces to this area [Maïa et al. 2017].
doi:
received: 13.07.2018 acceptance: ....08.2018 published: 24.08.2018
Material and methods
in order to present foreign trade processes, it is needed to use the database the Hm Revenue and Customs and the European Union Statistical Office, EUROSTAT. This will allow presen- ting the UK market, and processing of the values of the effects related the Member States.
Following the harmonized EUROSTAT data the extent and timing of bilateral trade in goods can be quantified too. Prior to presenting the results, however, it is necessary to record some fundamental conditions:
1. For country-by-country data, breakdown by sector and product ranges is based on the SITC (Standard International Trade Classification) and the freight rates available in the harmonized system.
2. within the territorial delimitation, it is important to note that the paper focusing just to Visegrad Countries (V4 – Czech Republic, Hungary, Poland and Slovakia).
3. During the examination of the trade process between the united kingdom and other member States will not take into account the distorting effects of VAT fraud on the internal market or the illegal trade in certain sectors, the fluctuation the exchange rates.
4. in certain commodities, it should be accepted by intra and extra eu trade that values in many cases do not indicate that the country of entry or exit and the country of destination are the same4. A loading site will be taken into account on the basis of the statistical register, although it will be further transported to other countries the internal market. This results in the role and significance of some major trading countries becoming unduly overvalued.
Results
the trade volume of agricultural and food products between the united kingdom and other EU member states is very significant, but the EU Member States can show a surplus. (fig. 1).
The importance of bilateral trade in the United Kingdom is much greater. The value of exports of food, feed and drink has been increased up to £22.0 billion, the import up to £46.2 billion in 2017. The value of food, feed and drink (FFD) imports increased by 7.1%, the export by 8.2% compared to 2016. The exports rise is a consequence of the combination of the relative strength of sterling, proactive responses to disease related issues, and an upward trend in world commodity prices. The import rise can be linked to the exchange rate, the EU enlargement and the wider efficiency of the single market which resulted even better condition to import.
In 2000 flowed into the EU (intra EU) 59.4% of goods. After 17 years this fall down to 47.8%. The causes of the process should be sought in the strengthening of partners and markets
4 An example is Belgium and the Netherlands where the statistical values are significantly distorted. The ports of Belgium (e.g. Antwerp) and the Netherlands (e.g. Rotterdam) ports are the dominant transit hubs, and partly thro- ugh the United Kingdom's land-based, Europe-wide and global trade flows. According to the statistics compiled by the Dutch Statistical Office, in the process called "Rotterdam effect", transit exports account for 48% of all
"European" exports in the Netherlands, so nearly half of all exports to the rest of Europe from the Netherlands are actually reexported. For imports this value is 38% [DSO 2016].
Figure 1. Value of UK trade in food, feed and drink at 2017 prices Source: [DeFRa 2018]
10 000 20 000 30 000 40 000 50 000
1993 1994 1995 1996 1997 1998 1999 2000 2001 2002 2003 2004 2005 2006 2007 2008 2009 2010 2011 2012 2013 2014 2015 2016 2017
trade value Export (£m) Import (£m)
£ mln
outside the eu, leading to more effective (eu) trade policy agreements, the strengthening of the economy of earlier colonies, the exchange rate effects or the rise of globalization. Parallel to this process, import ratios at the eu level (after germany and the netherlands), the second largest importing country, have also decreased compared to the 2000 base. The data shows that the united kingdom is basically a net importer, in case of the aggregate goods and the agri- -products category too.
Because of the trade evolution in 2017, 60% of UK food, feed and drink exports flow to countries in the EU and the rest 40% of UK FFD exports were to non-EU countries. Higher than the export, 70% of UK FFD imports during the same period were from the EU (fig. 2).
Figure 2. Changes in trade turnover between the united kingdom and eu, 2000-2017
Source: own editing based on [eurostat 2018]
40%
45%
50%
55%
60%
65%
2000 2001 2002 2003 2004 2005 2006 2007 2008 2009 2010 2011 2012 2013 2014 2015 2016 2017
share of intra eu export share of extra eu export
The principal EU import countries in this period were the Netherlands (£5.5 billion), France (£4.5 billion), Germany (£4.4 billion) and the Irish Republic (£4.3 billion) (fig. 3). The main UK export destinations of FFD were the Irish Republic (£3.7 billion), France (£2.3 billion), Netherlands (£1.5 billion) and Germany (£1.4 billion) in 2017.
Figure 3 shows that Poland's export role is significant in UK trade. But we can ask what kind of product are so significant and what about the other V4 countries? After seeing how British trade has developed within the Union, the effects of the V4 must be looked at more closely. But before that, it is worth exploring the importance of countries in uk trade5.
If we look in a broader sense regarding agri-food products, together the share of Central and Eastern European countries is relative high. The role and the share by agricultural and food products Poland, the Czech Republic and Hungary are the most important in the group of co- untries. It appears that the respect of all agricultural products increased significantly in value in
5 Regarding total commodity turnover, the share of total CEEC countries is not significant. Both in value and quantity during the period under consideration, Germany represented nearly 20% of the total, while Eastern Europe in 2017 together reached both 14% of the EU value in both value and volume both for exports and imports. The share of UK in exports was nearly 7%, both in value and in volume, while imports represented 11% of total EU imports.
Figure 3. Main export and import partners of FFD 2017 Source: [DeFRa 2018]
import export
0 1 2 3 4
HocHDenlbeuSFReSeiit
£ bln
0 1 2 3 4 5 6
DkDenluSbePleSFRitei
£ bln
Table 1. Trade evolution of agricultural and food products in case of V4, UK and in the EU
countries 2000* 2017
export import export import
value
[mln eur] quantity
[mln kg] value
[mln eur] quantity [mln kg] value
[mln eur] quantity
[mln kg] value
[mln eur] quantity [mln kg]
total eu 196.19 2.49 198.02 2.49 466.35 3.97 452.64 4.12
uk 16.20 0.13 27.98 0.24 25.28 0.13 51.93 0.39
Czech Republic 1.16 0.04 1.61 0.03 6.69 0.14 7.74 0.06
Hungary 2.11 0.04 0.95 0.02 7.28 0.14 5.01 0.04
Poland 2.71 0.03 2.99 0.06 26.08 0.21 16.68 0.22
Slovakia 0.38 0.01 0.73 0.01 2.46 0.04 3.92 0.03
bulgaria 10,7 5,2 28,3 24,5 68,6 46,0 66,0 132,0
estonia 10,0 4,8 0,2 0,1 31,0 13,5 11,4 35,7
lithuania 7,7 13,8 9,0 9,4 32,0 12,3 137,6 156,0
latvia 40,0 16,3 0,9 2,7 191,9 55,5 61,7 257,1
Romania 7,5 2,3 7,4 21,7 85,0 37,5 225,2 425,7
Slovenia 5,9 3,4 2,7 1,4 20,9 6,2 20,3 7,2
ceec total 8.20 0.18 9.44 0.18 61.98 0.93 55.20 0.60
* Between the EU and V4 countries has been made easier the agritrade flow during the accession negotiations. Therefore, it is necessary to illustrate the results related base year 2000
Source: own editing based on [Eurostat 2018]
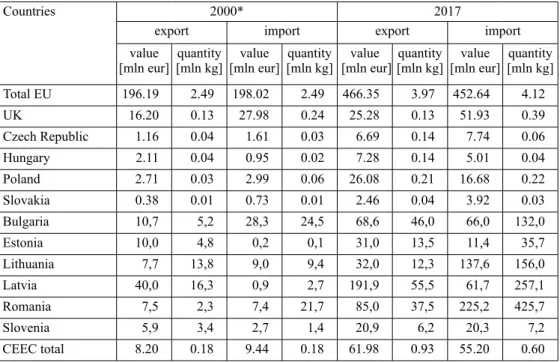
relation to intra-EU trade. Most of the countries exported significantly during the period under review. In the case of Latvia (21 times), Romania (16 times) and Lithuania (10 times) exports to other Member States have grown remarkably (tab. 1). It is obvious that the quantity is more dominant than the countries surveyed, as all the goods export is a major part of agricultural and food products. In this regard, 33% in Romania, 30% in Hungary, 28% in Bulgaria, share of agricultural and food products from total commodity exports. This is likely to be the case for low-processed bulk goods, can be traced back to the proportion of cereals.
it is evident from the data that the countries surveyed are basically importing from the uk and, at the end of the period (2017), only one third of the import value could be exported. After EU accession, significant growth has begun but a big increase occurred only after the economic crisis in 2008. During the examined 18 years the value of imports increased by 6 times (fig. 4).
Similar quantities can also be presented for volume: import volume increased by 14 times and the export increased by 2.8 times. One possible explanation for the slow export increase may be the large distance between the eu-V4, the former “un-build” relations and the importance of other traditional partners (eg. Germany).
By 2017, the dominant role of both exports and imports has evolved. It accounts UK export value for 66% of the group's, while the second is Czech Republic only 21%, Hungary 9% and Slovakia only 4% (own calculation based on Eurostat 2018). Meanwhile, the structure of the UK imports shows a much more concentrated picture. 84% of the group's total UK import value and 83% of the total quantity flows from Poland, while the second largest importer Hungary imports 7% both of total import value and quantity too.
moreover, none of the Visegrad countries can import more to uk than their exports (tab. 2). The export-import balance that depicts the country’s export import difference plastically:
BE/I = xij – mij
where BE/I gives the sum of balance, xij is the sum of export value of the given country, and mij is the sum of the similar values of import. The cover ratio is equal with the export import ratio. The ratio is the simplest export specific index that
correlates the exports of the countries to the imports:
ij ij I
E m
R / x
where RE/I is the value of index, xij is the sum of export items, currently the sum of export values of the given country, while mij gives the sum of similar values of import. The trade balance for the agricultural and food products all the countries is negative in 2017. At the beginning of the period only Slovakia had a positive value. The cover ratio presented the same process, the values are less then 1, so the UK export is smaller than the UK import, in all the cases.
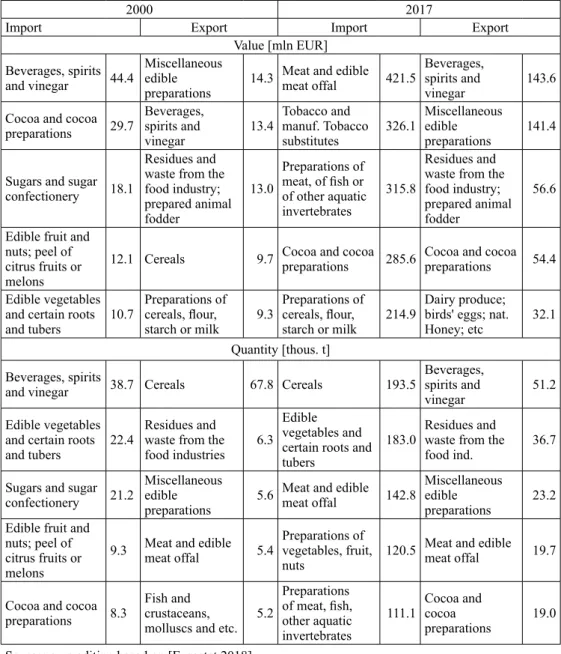
It can be seen in products that the dominance of food products is being observe today (tab. 3).
While earlier, if we are seeing trade flow – the quantity and the value as well – mainly processed products and not raw agricultural products are the most important, the processed products are dominant. Nowadays, in the UK export the alcohol category is the most important, while for UK imports meat products are the highest value, if we analysis the V4 trade.
0 200 400 600 800 1 000 1 200 1 400 1 600 1 800
0 500 1 000 1 500 2 000 2 500 3 000
2000 2001 2002 2003 2004 2005 2006 2007 2008 2009 2010 2011 2012 2013 2014 2015 2016 2017 Quantity [thous. t]
Value [mln EUR]
Import value [mln EUR]
Export value[mln EUR]
Import quantity [thous. t]
Export quantity [thous. t]
Figure 4. Agricultural and food sales between Visegrad Countries and the UK (2000-2017) Source: own editing based on [Eurostat 2018]
Table 2. Cover ratio and trade balance UK versus V4 (2000, 2017)
member
State Cover Ratio [%] trade balance [mln EUR]
2000 2017 2000 2017
Czech
Republic 0.96 0.87 -1.1 -21.4
Hungary 0.36 0.32 -31.3 -135.0
Poland 0.69 0.21 -22.3 -1,790.6
Slovakia 3.73 0.37 6.6 -46.6
V4 0.68 0.26 -48.1 -1,993.6
Source: own calculation based on [ Eurostat 2018]
Table 3. The 5 most important export and import products from the UK to V4 countries (2000, 2017)
2000 2017
import export import export
Value [mln EUR]
beverages, spirits
and vinegar 44.4 miscellaneous edible
preparations 14.3 meat and edible
meat offal 421.5 beverages, spirits and
vinegar 143.6
cocoa and cocoa
preparations 29.7 beverages, spirits and
vinegar 13.4 tobacco and manuf. Tobacco
substitutes 326.1 miscellaneous edible
preparations 141.4 Sugars and sugar
confectionery 18.1
Residues and waste from the food industry;
prepared animal fodder
13.0
Preparations of meat, of fish or of other aquatic invertebrates
315.8
Residues and waste from the food industry;
prepared animal fodder
56.6
edible fruit and nuts; peel of citrus fruits or melons
12.1 cereals 9.7 cocoa and cocoa
preparations 285.6 cocoa and cocoa preparations 54.4 edible vegetables
and certain roots
and tubers 10.7 Preparations of cereals, flour,
starch or milk 9.3 Preparations of cereals, flour,
starch or milk 214.9 Dairy produce;
birds' eggs; nat.
Honey; etc 32.1 Quantity [thous. t]
beverages, spirits
and vinegar 38.7 cereals 67.8 cereals 193.5 beverages,
spirits and
vinegar 51.2
edible vegetables and certain roots
and tubers 22.4 Residues and waste from the food industries 6.3
edible vegetables and certain roots and tubers
183.0 Residues and waste from the
food ind. 36.7
Sugars and sugar
confectionery 21.2 miscellaneous edible
preparations 5.6 meat and edible
meat offal 142.8 miscellaneous edible
preparations 23.2 edible fruit and
nuts; peel of citrus fruits or melons
9.3 meat and edible
meat offal 5.4 Preparations of vegetables, fruit,
nuts 120.5 meat and edible meat offal 19.7
cocoa and cocoa
preparations 8.3 Fish and crustaceans,
molluscs and etc. 5.2
Preparations of meat, fish, other aquatic invertebrates
111.1 cocoa and cocoa
preparations 19.0 Source: own editing based on [Eurostat 2018]
Summary
while there is no agreement yet on the terms of brexit, it is already apparent that it will have a major trade impact on the EU, as a whole. In the case of agricultural products market transformation is also expected. In this process, the V4 countries look insignificant, but due to the reversal effects, serious consequences can also be expected in their case too.
in examining the intra-eu trade in Visegrad countries, it can be concluded that, as a conse- quence of Brexit, a rapidly expanding agrarian trade process can be transformed. Using mutual
benefits, all parties were able to significantly increase their commercial activity, and in the case of the whole EU, V4 countries have also gained an increasing role. Regarding the British relationship, it can be determine that – thanks the EU single market – all parties increased their turnover in quantity and value too. It is resulting in a significant positive value for the region in the trade balance. The changing due to Brexit are most exposed to Poland, as they currently account for most of the region's foreign trade turnover. Due to the transformation effects during the scourge, all V4 countries can calculate with decline in their uk export turnover and with a significant market transformation. The possible transformation in future trade related the most relevant product group (processed products) can result a significant negative impact on V4's food industry and it is possible to effect a perceptible transformation of existing trade relations and markets.
Bibliography
DEFRA (Department for Environment, Food & Rural Affairs) 2018. Agriculture in the United Kingdom 2017. annual statistics about agriculture in the united kingdom to 2017, https://www.gov.uk/govern- ment/statistics/agriculture-in-the-united-kingdom-2017.
EDA (European Dairy Association). 2018. BREXIT: Don’t spill the milk a completely new dimension of a milk crisis, http://eda.euromilk.org/fileadmin/user_upload/Public_Documents/Press_Room__PR_
and_EDA_in_the_media_/EDA_Press_Release_Brexit_June_2018.pdf, access: 28.06.2017.
EC (European Commission). 2017. Brexit negotiations. The Article 50 negotiation process and principles for the United Kingdom’s departure from the European Union, https://ec.europa.eu/commission/brexit- negotiations_en, access: 21.10.2017.
Eurostat. 2018. Traditional international trade database access (ComExt), http://epp.eurostat.ec.europa.
eu/newxtweb/, access: 20.03.2017.
House of Lords. 2017. Brexit: trade in goods, european union committee. 16th report of session 2016- 17. hl paper 129, https://publications.parliament.uk/pa/ld201617/ldselect/ldeucom/129/129.pdf, access: 18.12.2017.
Maïa de La Baume, Ryan Heath, Quentin Ariès. 2017. 13 things you didn’t know about Brexit, https://www.
politico.eu/article/brexit-negotiation-issues-worrying-the-european-parliament/, access: 04.04.2017.
Statistics Netherlands. 2016. im-, export, transit trade, value weight, http://cbs.overheidsdata.nl/82007ENG, access: 11.12.2017.
Streszczenie
W rezultacie opuszczenia Unii Europejskiej przez Wielką Brytanię wewnętrzna wymiana handlowa Wspólnoty ulegnie znaczącym zmianom. Pomimo tego, że handel Wielkiej Brytanii z krajami Grupy Wyszehradzkiej nie jest najważniejszy, konieczne jest dokonanie przeglądu obecnego przepływu towarów i przedstawienie relacji związanych z sektorem rolno-spożyw- czym. Na podstawie danych Eurostatu dotyczących handlu wewnętrznego w Unii Europejskiej można stwierdzić, że głównie produkty przetworzone stanowią podstawę handlu dwustronnego Wielkiej Brytanii z Grupą Wyszehradzką, w szczególności z Polską.
correspondence address Miklos Vasary, PhD orcid.org/0000-0003-4501-6367 budapest metropolitan university institute of economics and business Science H-1148 Budapest, Nagy Lajos király útja 1-9. Hungary e-mail: mvasary@metropolitan.hu
![Figure 1. Value of UK trade in food, feed and drink at 2017 prices Source: [DeFRa 2018] 10 00020 00030 00040 00050 000 1993 1994 1995 1996 1997 1998 1999 2000 2001 2002 2003 2004 2005 2006 2007 2008 2009 2010 2011 2012 2013 2014 2015 2016 2017](https://thumb-eu.123doks.com/thumbv2/9dokorg/1432494.122063/2.722.79.528.694.845/figure-value-trade-food-drink-prices-source-defra.webp)

![Figure 4. Agricultural and food sales between Visegrad Countries and the UK (2000-2017) Source: own editing based on [Eurostat 2018]](https://thumb-eu.123doks.com/thumbv2/9dokorg/1432494.122063/5.722.184.649.105.328/figure-agricultural-sales-visegrad-countries-source-editing-eurostat.webp)