Article
Brexit and Power in the Council of the European Union
László Á. Kóczy 1,2
Citation: Kóczy, L.Á. Brexit and Power in the Council of the European Union.Games2021,12, 51. https://
doi.org/10.3390/g12020051
Academic Editor: Maria Montero
Received: 9 Aril 2021 Accepted: 11 June 2021 Published: 21 June 2021
Publisher’s Note:MDPI stays neutral with regard to jurisdictional claims in published maps and institutional affil- iations.
Copyright: © 2021 by the author.
Licensee MDPI, Basel, Switzerland.
This article is an open access article distributed under the terms and conditions of the Creative Commons Attribution (CC BY) license (https://
creativecommons.org/licenses/by/
4.0/).
1 Institute of Economics, Centre for Economic and Regional Studies, Tóth Kálmán u. 4., H-1097 Budapest, Hungary; koczy.laszlo@krtk.hu
2 Department of Finance, Faculty of Economic and Social Sciences, Budapest University of Technology and Economics, Magyar tudósok körútja 2., H-1111 Budapest, Hungary
Abstract:The exit of the United Kingdom from the European Union has had profound economic and political effects. Here, we look at a particular aspect, the power distribution in the Council of the European Union. Using the Shapley–Shubik power index, we calculate the member states’ powers with and without the United Kingdom and update earlier power forecasts using the Eurostat’s latest population projections. There is a remarkably sharp relation between population size and the change in power: Brexit increases the largest members’ powers while decreasing the smallest ones’ powers.
Keywords:European Union; Council of the European Union; qualified majority voting; power index;
a priori voting power; demographics JEL Classification:C71; D72
1. Introduction
Britain’s relation to the European Union has never been simple. It joined only in 1973, having been vetoed by France twice, but remained an outsider on many issues. In 2013, David Cameron, reelected conservative prime minister, committed to holding a referen- dum on the withdrawal from the European Union, orBrexit. A somewhat controversial campaign [1] led to the majority voting “leave”. The United Kingdom left the European Union on 31 January 2020.
Britain is the first major country to leave the EU (Greenland’s 1985 departure is hardly known), and Brexit has already caused drastic changes in life and economy both in the UK and in Europe [2–5]. Our goal is not to provide a comprehensive review of such likely effects: we look at the consequences of the Brexit on the voting in the Council of the European Union, better known by its former name, the Council of Ministers.
The Council is one of the main decision-making bodies of the European Union. Unlike in the European Parliament, for instance, each country is represented by a single individual;
the size differences between countries are expressed by weighted qualified majority voting.
Since the Treaty of Lisbon (effective since 2009 and the new voting rules since 2014) voting is successful if at least 55% of the countries, with at least 65% of the population, vote in favor [6]. Previously, member states had set weights, and these weights played the primary role in determining voting power. Back in those days, each extension of the European Union created long debates on the new weights; the new voting rules made the accession of Croatia smoother but also facilitated the departure of the United Kingdom.
We are interested in the member states’ power in the EU decision making, the Council, in particular, as well as its budgetary implications. How does Brexit affect members’
benefits in Euros? How is the relative balance of main regions affected? What are the long-term implications?
2. Materials and Methods
We calculate a priori power indices [7]. This approach models voting situations by simple games: cooperative games with transferable utility where winning coalitions get a
Games2021,12, 51. https://doi.org/10.3390/g12020051 https://www.mdpi.com/journal/games
payoffvof 1 and losing coalitions get 0. We are interested in the ability to change decisions.
Formally, we want to know the probability that, conditional on someone being instrumental in making a decision, they are a particular player (known as the p-power). In the context of budgetary decisions, the index shows a voter’s influence on spending a euro (or a billion).
In other words, a power index indicates the voters’ cuts from the budget as Kauppi and Widgrén [8] found for historical data.
TheShapley–Shubik indexφ[9] is the index commonly used to calculate p-power. It is the application of the Shapley value [10] to simple games: Voters arrive in a random order; if and when a coalition turns, winning of the full credit is given to the last arriving, thepivotalplayer. Formally, ifNis the set of players,φi(v) = ∑
S⊆N\{i}
s!(n−s−1)! n! v0i(S), wheren=|N|ands=|S|.
The most common alternative is the Penrose–Banzhaf measure and index, but it is more suited to calculatei-power; Zaporozhets et al. [11] find that if power and needs both determine the allocation of a budget, the nucleolus [12,13]—though difficult to compute—is, theoretically, a better alternative.
For the calculations, we only need population data. For the comparisons of Brexit vs. no Brexit, we use data from Eurostat [14]; for the long-term outlook, we use the most recent population projections [15]. While these population projections are separated by a mere 6 years, the forecasts differ drastically for some countries, including Germany, France, Belgium or Italy—perhaps due to a shift in migration patterns. Note that the 2020 statistics have no forecasts for the United Kingdom.
We have used IOP-Indices of Power 2.05 [16] to calculate the Shapley–Shubik indices of the countries, first for the current 28-member European Union, then for the 27-member European Union without the United Kingdom.
3. Results
Figure1highlights our main finding, namely a relation between the population and the relative power change due to Brexit. The detailed results of the calculations can be found in the AppendixA, in TablesA1–A4. FigureA1shows power trends for individual countries.
In the following we elaborate these findings, in particular, the necessary adjustment.
Figure 1.Adjusted power indices as a percentage of the pre-Brexit power indices at 2015 population levels labelled by EU country codes
3.1. Who Wins?
By the Property of New Members [17,18] in the appropriate restriction of a weighted voting, remaining members should have more power. The departure of the United King- dom does lead, for most players, to higher Shapley–Shubik index values (TablesA1andA2).
For the smallest member states, however, we observe a Paradox of New Members [19,20]:
they enjoy a higher power together with the United Kingdom than without. Such players do not contribute much in terms of population but can be pivotal in turning a coalition to winning if the population is there but there is a shortage of supporting countries. The departure of one of the largest member states eliminates many such opportunities; in a way, small countries are complementary to large ones. In sum, the largest gains are collected by the largest members, but most countries benefit from Brexit.
3.2. Do They Really Benefit?
This voting game is ultimately about sharing the EU budget. The United Kingdom, despite many concessions, has remained a net contributor. Brexit, therefore, does not only mean that fewer states share the cake (the budget), but also that the cake becomes smaller.
So when translating power to euros, a fair comparison should account for this loss as well. Since about 8.822% of the budget of the European Union was paid by the United Kingdom [21], this amount must be subtracted from the total shared by the remaining countries. Monetary benefits must therefore be scaled down by 91.18%. Figure1shows the adjusted post-Brexit Shapley–Shubik indices divided by the pre-Brexit Shapley–Shubik indices plotted against the 2015 population levels. TableA3shows the trends in the adjusted post-Brexit Shapley–Shubik indices using the population forecasts available around the time of the Brexit vote, while TableA4shows the updated trends with the most recent population forecasts.
The result is that countries with a population below 40 million lose up to 15%, while the four largest members—France, Germany, Italy, and Spain—gain much even after discounting.
3.3. Small vs. Large
While it is difficult to study comparative statics for power indices, it is noticeable that all small countries lose power, sometimes nearly 15%, and the biggest winners are large countries. Figure1shows the (budget-adjusted) change in power indices versus the member state populations. The trend is quite clear, but why? To understand this, we have to look at the way the Shapley–Shubik index is calculated and the rules of the qualified majority voting. The Shapley–Shubik index looks at average marginal contributions, but in a simple game, the contributions are all 0 except when the addition of a player turns a losing coalition into winning. (In the Banzhaf index, the probability of coalitions is different, the arguments and results are qualitatively similar.) The voting rule states two conditions for a win: the support of a certain number of countries and a certain percentage of the population. A large country turns a losing coalition into winning if the coalition is short just one member to reach the required participation or/and if the coalition has the required participation, but the participating countries are too small to have the required population.
When the incomplete coalition is of the first kind, any country works; when it is of the second, large players are generally more useful. What about small countries? If only one extra member is needed, small countries are equally useful, but when a greater population is missing, they are, generally, less interesting. The United Kingdom was one of the largest members; its departure means that the number of incomplete coalitions due to insufficient participation decreases more than of those with insufficient populations. This way, smaller countries find themselves useful less often, while the change is less pronounced for large countries. In other words, the UK is a substitute for large, but a complement for small countries. Due to the normalisation, the large countries benefit, the small ones suffer. This is further elaborated by Petróczy, Rogers, and Kóczy [22].
3.4. Power Balance
Brexit has had profound effects on the power balance within the Union. We present the power projections in Figure2for four regions (similar graphs for individual countries are presented in the AppendixA), here looking at the unscaled power indices. These four regions (East, West (or Core), North (including former EFTAn Austria), South) are affected differently by the introduction of the new Lisbon voting rules (effective since 2014, shown first by the figures for 2015), the demographics, and Brexit, which took place in 2020. In 2010, with the Nice rules still in place, the four regions had approximately the same aggregate power; with Brexit, this changes completely. While the core countries see their influence go up by some 60% vs. the Nice rules, Nordic countries, including Britain and Austria, had a steady, demographics-driven increase until Brexit. Southern countries are mixed — Italy balances the decline in mid-sized members of this group — and the net result of the various effects is a relatively small variation of their total power. Finally, the Central and East European countries exhibit a steady decline, both individually and as a group. While these four groups had roughly equal power before the Lisbon treaty, the Core countries are expected to have over twice the power of the CEECs by the end of the examined period. Brexit has a small, temporary positive effect on the region, but we do not see the rising star Göllner [23] found by looking at the Banzhaf values, a result potentially driven by an arithmetic error. The six founding members of the EEC had about one-third of the total power before Lisbon, while the same countries have more than half with Brexit.
Figure 2.Power index projections for four regions color-coded on the map. Dotted/solid lines show the 2014 pre-Brexit status quo/Brexit forecasts, respectively.
3.5. Inertia
One of the main reasons for the Lisbon voting reform was to reduce the decision inertia.
Despite the drastic improvement, the EU is still seen rather impotent in making decisions.
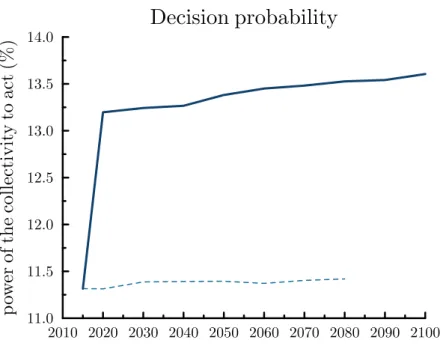
How does Brexit affect its power to act? We use thepower of a collectivity to act[24], which is simply the share of coalitions that pass the majority requirements.
It has been remarked before that the United Kingdom has mostly taken a critical position in EU matters, so one would expect to see a greater momentum in making decisions.
When we look at the power of the collectivity to act (Figure 3), such aspects are not considered, and thus the increased decision probability is independent of this. While the increase is less than 2%, the increment is comparable to the EU’s power to act before the Lisbon reform. In other words, the departure of the United Kingdom results in a significant improvement in the power to act.
Figure 3.Predictions for the power of a collectivity to act for the European Union. Dashed and solid lines, respectively, show the 2014 pre-Brexit status quo and 2019 Brexit forecasts.
3.6. Brexit as a Threat
Kroll and Leuffen [25] explain the game that the UK wanted to play by threatening Europe with Brexit: a continued membership would be conditional on further concessions.
Kroll and Leuffen [25], Hix et al. [26] discuss how member states with different policy positions reacted; here, we add power and monetary considerations. A blocking minority actually benefited from Brexit, making it impossible to achieve the desired deal.
3.7. Extensions and Generalizations
Our analysis has certain limitations. It follows the literature looking at a priori power indices, where it is assumed that the topics of voting are not known, so all coalitions are equally probable. In practice, some member states may have similar interests, often together [27,28], or may have characteristic communication structures [29] or policy po- sitions that naturally rule out infeasible (nonconvex) coalitions [30,31]. Such extensions would provide extra insight but remain conceptually and computationally challenging.
It is natural to ask how the results would generalize to other voting problems or other exits. Unfortunately, the problem is very irregular, so no general findings can be made. It would suggest that the departure of a large member state benefits other large members, and, perhaps, similarly for small members. Actually, this is not the case. Preliminary results suggest that this also depends on the actual number of states. A subsequent departure of a large member would not have the same effect: as the number of states is reduced to 26, the population quota decreases, while the (number) quota does not, making large countries relatively less important. It seems, therefore, that some of these results are driven by the two majority requirements in the Council of the European Union.
Funding:This research was funded by the National Research, Development and Innovation Office grant number K-128573 and by the Higher Education Institutional Excellence Program 2020 of the Ministry of Innovation and Technology in the framework of the “Financial and Public Services” grant number TKP2020-IKA-02 at the Corvinus University of Budapest.
Institutional Review Board Statement:Not applicable.
Informed Consent Statement:Not applicable.
Data Availability Statement:See references.
Acknowledgments:I would like to thank the insightful comments of the referees and the editor that have led to considerable improvements of the paper.
Conflicts of Interest:The authors declare no conflict of interest.
Abbreviations
The following abbreviations are used in this manuscript:
CEEC Central and Eastern European Country EEC European Economic Community EU European Union
UK United Kingdom Appendix A. Tables
Table A1.Shapley–Shubik index projections for the status quo.
2015 2020 2030 2040 2050 2060 2070 2080
Austria 2.02 2.04 2.10 2.13 2.14 2.15 2.15 2.15
Belgium 2.42 2.48 2.62 2.73 2.86 2.96 3.05 3.13
Bulgaria 1.82 1.78 1.70 1.64 1.60 1.57 1.54 1.51
Croatia 1.39 1.38 1.38 1.36 1.33 1.33 1.32 1.32
Cyprus 0.92 0.92 0.94 0.95 0.96 0.98 1.00 1.02
Czech Republic 2.30 2.30 2.31 2.31 2.33 2.35 2.34 2.34
Denmark 1.59 1.61 1.65 1.67 1.68 1.71 1.75 1.77
Estonia 0.98 0.98 0.98 0.98 0.97 0.98 0.99 0.99
Finland 1.57 1.58 1.62 1.64 1.66 1.67 1.70 1.71
France 11.27 11.45 11.78 12.13 12.35 12.65 12.98 13.26
Germany 14.43 14.23 13.76 13.15 12.43 11.74 11.14 10.61
Greece 2.37 2.31 2.21 2.13 2.06 2.00 1.94 1.89
Hungary 2.21 2.18 2.15 2.11 2.10 2.08 2.05 2.03
Ireland 1.44 1.44 1.44 1.45 1.49 1.53 1.58 1.65
Italy 10.24 10.35 10.59 10.88 10.97 10.85 10.69 10.55
Latvia 1.08 1.06 1.03 1.02 1.03 1.02 1.03 1.04
Lithuania 1.20 1.17 1.11 1.09 1.08 1.07 1.08 1.09
Luxembourg 0.88 0.88 0.92 0.94 0.97 0.98 1.00 1.02
Malta 0.85 0.85 0.88 0.89 0.90 0.90 0.91 0.92
Netherlands 3.27 3.28 3.31 3.29 3.24 3.20 3.18 3.14
Poland 6.43 6.33 6.07 5.79 5.58 5.39 5.15 4.89
Portugal 2.28 2.22 2.17 2.10 2.03 1.94 1.87 1.81
Romania 3.74 3.69 3.53 3.42 3.33 3.25 3.16 3.09
Slovakia 1.56 1.55 1.54 1.51 1.48 1.45 1.41 1.37
Slovenia 1.09 1.09 1.10 1.10 1.11 1.10 1.11 1.12
Spain 7.56 7.37 6.98 6.85 6.88 6.97 7.00 7.13
Sweden 2.18 2.22 2.34 2.42 2.51 2.63 2.70 2.78
United Kingdom 10.95 11.25 11.80 12.33 12.94 13.59 14.15 14.66
Figure A1.Shapley–Shubik index forecasts per country. Dotted lines show 2010 [6] and 2014 pre- Brexit (thick, TableA1), solid Brexit 2014 (thick, TableA3), 2020 (thin, TableA4). The two thick lines directly compare the Brexit/no-Brexit forecasts from around the time of the Brexit campaign.
Table A2.Shapley–Shubik index projections after Brexit.
2015 2020 2030 2040 2050 2060 2070 2080
Austria 2.16 2.18 2.24 2.27 2.29 2.31 2.31 2.32
Belgium 2.59 2.66 2.82 2.96 3.09 3.21 3.32 3.41
Bulgaria 1.91 1.87 1.79 1.71 1.66 1.62 1.59 1.54
Croatia 1.42 1.42 1.41 1.38 1.35 1.34 1.34 1.32
Cyprus 0.88 0.89 0.90 0.91 0.91 0.93 0.95 0.97
Czech Republic 2.46 2.46 2.48 2.48 2.51 2.52 2.54 2.53
Denmark 1.65 1.68 1.73 1.74 1.76 1.78 1.83 1.85
Estonia 0.95 0.95 0.94 0.94 0.93 0.93 0.93 0.93
Finland 1.63 1.64 1.69 1.71 1.73 1.73 1.76 1.78
France 13.41 13.68 14.21 14.77 15.28 15.94 16.58 17.19
Germany 17.42 17.23 16.77 16.14 15.38 14.67 14.05 13.53
Greece 2.54 2.48 2.37 2.27 2.20 2.13 2.06 2.00
Hungary 2.36 2.34 2.30 2.26 2.24 2.22 2.19 2.18
Ireland 1.49 1.48 1.49 1.49 1.54 1.57 1.64 1.70
Italy 12.12 12.31 12.68 13.15 13.47 13.50 13.46 13.46
Latvia 1.06 1.05 1.01 0.99 0.99 0.97 0.98 0.99
Lithuania 1.21 1.18 1.10 1.07 1.05 1.03 1.04 1.06
Luxembourg 0.84 0.84 0.88 0.89 0.93 0.93 0.95 0.97
Malta 0.81 0.81 0.83 0.83 0.83 0.83 0.84 0.85
Netherlands 3.51 3.53 3.57 3.55 3.51 3.48 3.46 3.42
Poland 7.11 7.08 6.90 6.64 6.34 6.13 5.82 5.45
Portugal 2.44 2.39 2.32 2.24 2.16 2.06 1.98 1.90
Romania 4.01 3.94 3.79 3.68 3.60 3.52 3.45 3.36
Slovakia 1.61 1.61 1.60 1.56 1.52 1.48 1.43 1.38
Slovenia 1.08 1.08 1.09 1.09 1.08 1.07 1.08 1.09
Spain 9.00 8.86 8.58 8.67 8.94 9.26 9.49 9.81
Sweden 2.33 2.39 2.51 2.60 2.71 2.85 2.95 3.01
Table A3.Adjusted projections after Brexit.
2015 2020 2030 2040 2050 2060 2070 2080
Austria 1.97 1.98 2.04 2.07 2.09 2.10 2.10 2.11
Belgium 2.36 2.42 2.57 2.70 2.82 2.92 3.03 3.11
Bulgaria 1.74 1.70 1.63 1.56 1.52 1.48 1.45 1.40
Croatia 1.30 1.29 1.28 1.25 1.23 1.22 1.22 1.20
Cyprus 0.81 0.81 0.82 0.83 0.83 0.84 0.87 0.89
Czech Republic 2.24 2.25 2.26 2.26 2.29 2.30 2.31 2.31
Denmark 1.50 1.53 1.57 1.59 1.61 1.62 1.67 1.69
Estonia 0.87 0.87 0.86 0.86 0.85 0.84 0.85 0.84
Finland 1.49 1.50 1.54 1.56 1.58 1.58 1.61 1.63
France 12.22 12.48 12.95 13.46 13.93 14.54 15.11 15.67
Germany 15.88 15.71 15.29 14.71 14.03 13.37 12.81 12.34
Greece 2.32 2.26 2.16 2.07 2.00 1.94 1.87 1.82
Hungary 2.16 2.13 2.10 2.06 2.05 2.03 2.00 1.99
Ireland 1.36 1.35 1.35 1.36 1.40 1.44 1.49 1.55
Italy 11.05 11.23 11.56 11.99 12.28 12.31 12.27 12.27
Latvia 0.97 0.95 0.92 0.90 0.90 0.89 0.90 0.90
Lithuania 1.10 1.07 1.01 0.98 0.96 0.94 0.95 0.96
Luxembourg 0.76 0.76 0.80 0.81 0.85 0.84 0.87 0.89
Malta 0.73 0.74 0.76 0.76 0.76 0.76 0.76 0.77
Netherlands 3.20 3.21 3.26 3.24 3.20 3.17 3.16 3.12
Poland 6.48 6.45 6.29 6.05 5.78 5.59 5.31 4.97
Table A3.Cont.
2015 2020 2030 2040 2050 2060 2070 2080
Portugal 2.23 2.18 2.12 2.05 1.97 1.88 1.80 1.73
Romania 3.65 3.59 3.45 3.35 3.28 3.21 3.14 3.06
Slovakia 1.47 1.47 1.46 1.42 1.39 1.35 1.31 1.26
Slovenia 0.98 0.98 0.99 0.99 0.99 0.97 0.98 0.99
Spain 8.20 8.08 7.83 7.90 8.15 8.44 8.65 8.95
Sweden 2.13 2.18 2.29 2.37 2.47 2.60 2.69 2.74
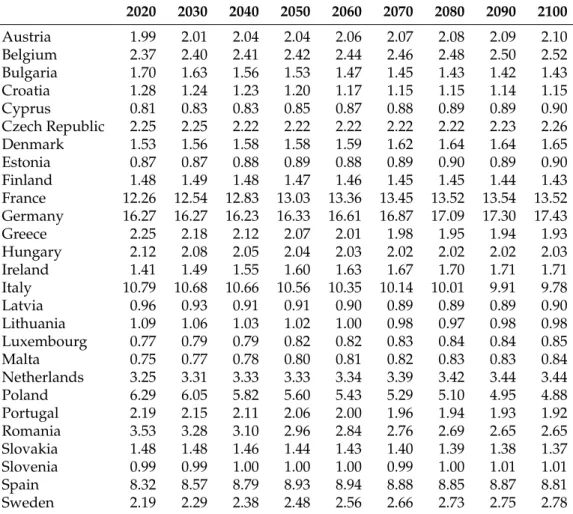
Table A4.Current adjusted projections after Brexit.
2020 2030 2040 2050 2060 2070 2080 2090 2100
Austria 1.99 2.01 2.04 2.04 2.06 2.07 2.08 2.09 2.10
Belgium 2.37 2.40 2.41 2.42 2.44 2.46 2.48 2.50 2.52
Bulgaria 1.70 1.63 1.56 1.53 1.47 1.45 1.43 1.42 1.43
Croatia 1.28 1.24 1.23 1.20 1.17 1.15 1.15 1.14 1.15
Cyprus 0.81 0.83 0.83 0.85 0.87 0.88 0.89 0.89 0.90
Czech Republic 2.25 2.25 2.22 2.22 2.22 2.22 2.22 2.23 2.26
Denmark 1.53 1.56 1.58 1.58 1.59 1.62 1.64 1.64 1.65
Estonia 0.87 0.87 0.88 0.89 0.88 0.89 0.90 0.89 0.90
Finland 1.48 1.49 1.48 1.47 1.46 1.45 1.45 1.44 1.43
France 12.26 12.54 12.83 13.03 13.36 13.45 13.52 13.54 13.52 Germany 16.27 16.27 16.23 16.33 16.61 16.87 17.09 17.30 17.43
Greece 2.25 2.18 2.12 2.07 2.01 1.98 1.95 1.94 1.93
Hungary 2.12 2.08 2.05 2.04 2.03 2.02 2.02 2.02 2.03
Ireland 1.41 1.49 1.55 1.60 1.63 1.67 1.70 1.71 1.71
Italy 10.79 10.68 10.66 10.56 10.35 10.14 10.01 9.91 9.78
Latvia 0.96 0.93 0.91 0.91 0.90 0.89 0.89 0.89 0.90
Lithuania 1.09 1.06 1.03 1.02 1.00 0.98 0.97 0.98 0.98
Luxembourg 0.77 0.79 0.79 0.82 0.82 0.83 0.84 0.84 0.85
Malta 0.75 0.77 0.78 0.80 0.81 0.82 0.83 0.83 0.84
Netherlands 3.25 3.31 3.33 3.33 3.34 3.39 3.42 3.44 3.44
Poland 6.29 6.05 5.82 5.60 5.43 5.29 5.10 4.95 4.88
Portugal 2.19 2.15 2.11 2.06 2.00 1.96 1.94 1.93 1.92
Romania 3.53 3.28 3.10 2.96 2.84 2.76 2.69 2.65 2.65
Slovakia 1.48 1.48 1.46 1.44 1.43 1.40 1.39 1.38 1.37
Slovenia 0.99 0.99 1.00 1.00 1.00 0.99 1.00 1.01 1.01
Spain 8.32 8.57 8.79 8.93 8.94 8.88 8.85 8.87 8.81
Sweden 2.19 2.29 2.38 2.48 2.56 2.66 2.73 2.75 2.78
References
1. Goodwin, M.; Hix, S.; Pickup, M. For and against Brexit: A survey experiment of the impact of campaign effects on public attitudes toward EU membership.Br. J. Political Sci.2020,50, 481–495. [CrossRef]
2. Buckle, R.; Hewish, T.; Hulsman, J.C.; Mansfield, I.; Oulds, R.Directions for Britain Outside the EU; Institute or Economic Affairs:
London, UK, 2015.
3. Celebi, K. Quo Vadis, Britain?—Implications of the Brexit process on the UK’s real economy. Int. Econ. Econ. Policy2021, 18, 267–307. [CrossRef]
4. Dagnis Jensen, M.; Snaith, H. When politics prevails: The political economy of a Brexit.J. Eur. Public Policy2016,1763, 1–9.
5. Oliver, T. European and international views of Brexit.J. Eur. Public Policy2016,1763, 1–8. [CrossRef]
6. Kóczy, L.Á. Beyond Lisbon: Demographic trends and voting power in the European Union Council of Ministers.Math. Soc. Sci.
2012,63, 152–158. [CrossRef]
7. Felsenthal, D.S.; Machover, M. A priori voting power: What is it all about?Political Stud. Rev.2004,2, 1–23. [CrossRef]
8. Kauppi, H.; Widgrén, M. What determines EU decision making? Needs, power or both?Econ. Policy2004,39, 221–266. [CrossRef]
9. Shapley, L.S.; Shubik, M. A method for evaluating the distribution of power in a committee system.Am. Political Sci. Rev.1954, 48, 787–792. [CrossRef]
10. Shapley, L.S. A value for n-person games. InContributions to the Theory of Games II, Vol. II of Annals of Mathematics Studies;
Kuhn, H.W., Tucker, A.W., Eds.; Princeton University Press: Princeton, NJ, USA, 1953; pp. 307–317.
11. Zaporozhets, V.; García-Valiñas, M.; Kurz, S. Key drivers of EU budget allocation: Does power matter?Eur. J. Political Econ.2016, 43, 57–70. [CrossRef]
12. Montero, M. On the nucleolus as a power index.Homo Oeconomicus2013,22, 551–567.
13. Schmeidler, D. The nucleolus of a characteristic function game, SIAM.J. Appl. Math.1969,17, 1163–1170.
14. Eurostat , 2014, EUROPOP2013—Convergence Scenario, National Level, Population Predictions—[tps00002]. Available online:
https://ec.europa.eu/eurostat/databrowser/view/tps00002/default/table?lang=en(accessed on 16 April 2016).
15. Eurostat , 2020, EUROPOP2019—Convergence Scenario, National Level, Population Predictions—[tps00002]. Available online:
https://ec.europa.eu/eurostat/databrowser/view/PROJ_19NP/default/table?lang=en(accessed on 29 May 2020).
16. Bräuninger, T.; König, T. Indices of Power IOP 2.0. 2005. Available online:http://www.tbraeuninger.de/IOP.html(accessed on 10 November 2018).
17. Brams, S.J.; Affuso, P.J. Power and size: A new paradox.Theory Decis.1976,7, 29–56. [CrossRef]
18. Kóczy, L.Á. Measuring voting power: The paradox of new members vs. the null player axiom. InTowards Intelligent Engineering and Information Technology; Rudas, I.J., Fodor, J., Kacprzyk, J., Eds.; Springer: Berlin/Heidelberg, Germany, 2009; pp. 67–78.
19. van Deemen, A.; Rusinowska, A. Paradoxes of voting power in Dutch politics.Public Choice2003,115, 109–137. [CrossRef]
20. Rusinowska, A.; van Deemen, A. The Redistribution Paradox and the Paradox of New Members in the German Parliament. In Game Theory and Applications; Petrosyan, L.A., Mazalov, V.V., Eds.; Nova: New York, NY, USA, 2005; pp. 153–174.
21. European Parliament. EU Budget Explained: Expenditure and Contribution by Member State. United Kingdom. 2015. Available online:http://www.europarl.europa.eu/news/en/news-room/20141202IFG82334/EU-budget-explained-expenditure-and- contribution-by-member-state(accessed on 16 April 2016).
22. Petróczy, D.G.; Rogers, M.F.; Kóczy, L.Á. Brexit: The belated threat.arXiv2018, arXiv:1808.05142v1.
23. Göllner, R.T. The Visegrád Group—A rising star post-Brexit? Changing distribution of power in the European Council.Open Political Sci.2008,1, 1–6. [CrossRef]
24. Coleman, J.S. Control of collectives and the power of a collectivity to act. InSocial Choice; Lieberman, B., Ed.; Gordon and Breach:
New York, NY, USA, 1971; pp. 192–225.
25. Kroll, D.A.; Leuffen, D. Ties that bind, can also strangle: The Brexit threat and the hardships of reforming the EU.J. Eur. Public Policy2016,23, 1–10. [CrossRef]
26. Hix, S.; Hagemann, S.; Frantescu, D. Would Brexit Matter? The UK’s Voting Record in the Council and the European Parliament, Tech. Rep. April, VoteWatch Europe, Brussels. 2016. Available online:http://www.votewatch.eu/blog/special-report-would- brexit-matter-the-uks-voting-record-in-the-council-and-the-european-parliament/(accessed on 16 May 2018).
27. Gładysz, B.; Mercik, J.; Ramsey, D.M. The Effect of Brexit on the Balance of Power in the European Union Council Revisited:
A Fuzzy Multicriteria Attempt. InTransactions on Computational Collective Intelligence XXXI. Lecture Notes in Computer Science;
Nguyen, N., Kowalczyk, R., Mercik, J., Motylska-Ku´zma, A., Eds.; Springer: Berlin/Heidelberg, Germany, 2017; Volume 11290, pp. 87–107.
28. Mercik, J.; Ramsey, D.M. The effect of Brexit on the balance of power in the European Union Council: An approach based on pre-coalitions. InTransactions on Computational Collective Intelligence XXVII. Lecture Notes in Computer Science; Nguyen, N., Kowalczyk, R., Mercik, J., Eds.; Springer: Cham, Switzerland, 2017; Volume 10480, pp. 87–107.
29. Mayer, A. Luxembourg in the Early Days of the EEC: Null Player or Not?Games2018,9, 29. [CrossRef]
30. Fert˝o, I.; Kóczy, L.Á.; Kovács, A.; Sziklai, B.R. The power ranking of the member s of the Agricultural Committee of the European Parliament.Eur. J. Agric. Econ.2020,47, 1897–1919. [CrossRef]
31. Kóczy, L.Á.; Sziklai, B. Electing the Pope.Homo Oeconomicus2015,32, 101–116.


![Figure A1. Shapley–Shubik index forecasts per country. Dotted lines show 2010 [6] and 2014 pre- pre-Brexit (thick, Table A1), solid Brexit 2014 (thick, Table A3), 2020 (thin, Table A4)](https://thumb-eu.123doks.com/thumbv2/9dokorg/758959.32802/7.892.251.727.137.918/figure-shapley-shubik-forecasts-country-dotted-brexit-brexit.webp)