Anita Pelle – Gabriella Tabajdi
Research and Development in the EU Member States’ Performance in R&D&I
European Innovation Scoreboard
Lecture 10
This teaching material has been made at the University of Szeged, and supported by the European Union.
Project ID: EFOP-3.4.3-16-2016-00014
University of Szeged
6720 Szeged, Dugonics tér 13.Hungary www.u-szeged.hu
www.szechenyi2020.hu
Member States’ performance in R&D&I European Innovation Scoreboard
Lecture 10
In this lecture you will learn about:
− What the European Innovation Scoreboard is
− How the EU is performing in innovation
− How the member states perform in innovation
The European Innovation Scoreboard
Before going into details on member states’ performance in innovation first we check how the EU measures innovation performance. For this purpose, it uses the European Innovation Scoreboard (EIS).
“The European innovation scoreboard provides a comparative analysis of innovation performance in EU countries, other European countries, and regional neighbours. It assesses relative strengths and weaknesses of national innovation systems and helps countries identify areas they need to address.”
The European Innovation Scoreboard is released every year since 2001. The 2020 edition was published on 23rd of June, but this EIS misses the United Kingdom from the scope of analysed countries (due to that the UK is leaving the EU). The innovation Scoreboard assesses innovation and research performance of EU member states plus some selected non-member state countries. The EIS allows for better understanding on the innovation performance of single countries and regions thus allows for better targeting of those regions that need support the most to improve their innovation performance.
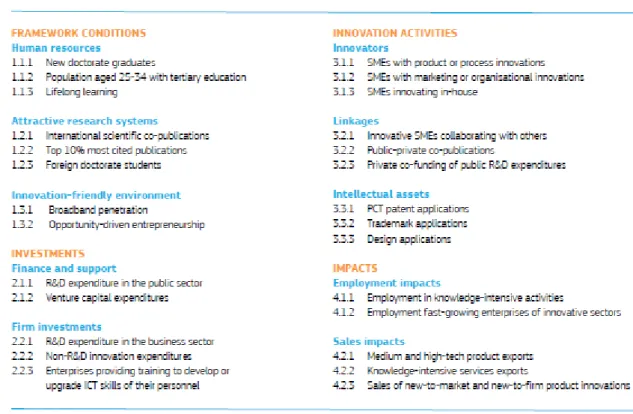
Figure 1. The measurement framework of EIS
Source: EC (2020) pp. 8.
The EIS identifies 4 main activity types: Framework conditions, Investments, Innovation activities and Impacts (EC 2020).
“Framework conditions captures the main drivers of innovation performance external to the firm” (EC 2020 pp. 9.).
“Investments captures investments made in both the public and business sector” (EC 2020 pp. 9.).
“Innovation activities captures different aspects of innovation in the business sector” (EC 2020 pp. 9.).
“Impacts captures the effects of firms’ innovation activities” (EC 2020 pp. 9.).
It distinguishes 10 innovation dimensions and altogether 27 indicators. It assesses the innovation through these framework conditions, dimensions, and indicators (EC 2020).
Human resources dimension “measures the availability of a high-skilled and educated workforce”
(EC 2020 pp. 9.).
Attractive research systems “measures the international competitiveness” (EC 2020 pp. 9.).
“Innovation-friendly environment captures the environment in which enterprises operate” (EC 2020 pp. 9.).
Finance and support “measures the availability of finance for innovation projects” (EC 2020 pp. 9.).
“Firm investments includes three indicators of both R&D and Non-R&D investments that firms make to generate innovations and the efforts enterprises make to upgrade the ICT skills of their personnel” (EC 2020 pp. 9.).
Innovators measures “the share of firms that have introduced innovations into the market or within their organisations” (EC 2020 pp. 9.).
Linkages measures innovation capabilities, “research collaboration between the private and public sector, and the extent to which the private sector finances public R&D activities” (EC 2020 pp. 9.).
Intellectual assets “captures different forms of Intellectual Property Rights (IPR) generated in the innovation process” (EC 2020 pp. 9.).
Employment impacts “measures the impact on employment” (EC 2020 pp. 9.).
Sales impacts “measures the economic impact of innovation” (EC 2020 pp. 9.).
Based on the average of these elements a Summary Innovation Index is created. Then based on their performance, countries are classified into 4 groups: Innovation Leaders, Strong Innovators, Moderate Innovators and Modest Innovators (EC 2020).
The EU’s and its member states’ performance in the European Innovation Scoreboard
Based on the weighted averages of the different dimensions, the Summary Innovation Index is composed, and the performance of member states is analysed based on this index.
Figure 2 The EIS performance of EU member states
Source: EC (2020) pp. 13
Based on the Summary Innovation Indicator, European countries can be put into 4 groups:
• modest innovators (performance below 50% of the EU average) are: Romania and Bulgaria
• moderate innovators (performance between 50% and 95% of the EU average) are: 13 countries covering the majority of Central and East European and Southern European member states
• strong innovators (performance between 95% and 125% of the EU average) are: 7 countries mainly the bigger and stronger (mainly Western European) economies of the EU, plus Estonia and Portugal
• innovation leaders (performance above 125% of the EU average): 5 countries belonging to this group, these are Northern European member states.
Based on Figure 2, without deep analysis, we can make the following conclusions:
• Sweden is the most innovative, the innovation leader in the EU
• as a country group/ region, the Northern European member states are the innovation leaders
• there is a gap between Southern and Northern, Western and Eastern member states
• from Southern Europe Portugal, from Central and Eastern Europe Estonia stands out as both countries are innovation leaders
• most of the countries could increase or at least maintain their innovation performance compared to 2012 (exceptions are: Romania and Slovenia)
• the performance of the EU also increased, on average its innovation performance increased by 8.9% from 2012 to 2018
• innovation performance increased in 24 member states.
Figure 3. The change in EU member states’ innovation performance from 2012 to 2019
Source: EC (2020) pp. 15
Figure 3 shows us the performance changes in innovation index from 2012 to 2019. Based on that we can say the followings:
• 20 %-points or higher improvement in 5 countries (Lithuania, Malta, Latvia, Portugal, and Greece)
• innovation performance increased the most in Lithuania by 27.8 %-points
• an improvement of 15 %-points and 20 %-points: Finland improved by 19 %-points
• an improvement between 10 %-points and 15 %-points: in 7 countries including countries from all regions of the EU
• an improvement between 5%-points and 10 %-points: in 8 member states mainly from Central Europe
• an improvement between 0 %-points and 5 %-points: in 3 countries
• a performance decline between 0 and 5 %-points: in Germany innovation performance decreased by -0.4 %-points
• a decline higher than 5 %-points: in Romania and Slovenia
• most countries could improve their innovation performance between 5 and 15 %- points
• innovation performance decreased in 3 countries, including Germany
• the less innovative countries could improve their innovation performance faster
• between 2012 and 2019 there has been a convergence in innovation performance between member states, with lower performing countries improving their innovation performance at a greater rate than higher performing countries (EC 2020).
“In selected areas of innovation, the EU leaders are: Sweden– human resources; Luxembourg – attractive research systems; intellectual assets; Denmark – innovation-friendly environment;
finance and support; Germany– firm investment; Portugal –innovation in small and medium- sized enterprises; Austria – linkages and collaboration; Ireland– employment impacts and sales impacts”.
Questions for self-study
− What is the European Innovation Scoreboard and what are its main activities?
− What are the four main innovation categories of the EIS? Which countries belong to these categories? What can we say about the innovation performance of the member states?
References:
EC (2020): European Innovation Scoreboard 2020. European Commission Report, Luxembourg. available online:
https://ec.europa.eu/growth/industry/policy/innovation/scoreboards_en Innovation leaders in selected areas: :
https://ec.europa.eu/commission/presscorner/detail/en/ip_20_1158
The European Innovation Scoreboard basics: http://www.eurada.org/european-innovation- scoreboard-2020-assessing-the-performance-of-the-eu-countries/
The European Innovation Scoreboard definition:
https://ec.europa.eu/growth/industry/policy/innovation/scoreboards_en