Agraarteadus 2 ● XXX ● 2019 In Press
Journal of Agricultural Science 2 ● XXX ● 2019 In Press
AGRI-FOOD COMPARATIVE ADVANTAGES IN THE EUROPEAN UNION COUNTRIES BY VALUE CHAINS BEFORE AND AFTER
ENLARGEMENT TOWARDS THE EAST
Štefan Bojnec1, Imre Fertő2,3
1University of Primorska, Faculty of Management, Cankarjeva 5, SI-6101 Koper, Slovenia
2Institute of Economics, Centre for Regional and Economic Studies, Lorand Eotvos Research Network, Tóth K. u. 4, H-1097 Budapest, Hungary, e-mail: ferto.imre@krtk.mta.hu
3Kaposvár University, Guba Sándor u. 4, H-74000 Kaposvár, Hungary
Saabunud:
31.07.2019 Received:
Aktsepteeritud:
24.10.2019 Accepted:
Avaldatud veebis:
24.10.2019 Published online:
Vastutav autor: Štefan Bojnec Corresponding author:
E-mail: stefan.bojnec@fm-kp.si, stefan.bojnec@siol.net Keywords: agri-food export competitiveness, European Union, revealed comparative advantage index.
doi: 10.15159/jas.19.10
ABSTRACT. To identify the European Union (EU) member states strong exports sectors and food chains, the revealed comparative advantage indices from trade data were calculated using the total global trade as the benchmark of comparison. The empirical results show that the level and patterns in the development of the revealed comparative advantage indices for agri-food products for each of the EU countries in the global markets were mixed. The most successful EU member states in agri-food export competitiveness in global markets were the Netherlands, France, and Spain. Differences between the EU member states were also identified for the main agri-food product groups. Latvia, Bulgaria, Estonia, Lithuania, and Luxembourg were the five EU countries that competed most successfully in global grain markets. In terms of fruit and vegetable produce exports Greece, Cyprus, Spain, Lithuania, and Bulgaria were the most competitive EU countries in world markets. With respect to global dairy markets Denmark, Luxembourg, Latvia, Ireland, and the Nether- lands achieved the largest export advantages, although strong export competitiveness was evident for almost all of the EU member states in the global dairy markets. Cyprus, Bulgaria, Ireland, Hungary, and Denmark revealed significant export advantages in global meat markets. New EU- member states, particularly Bulgaria and Latvia, achieved high export advantages in the global markets for the select product groups.
© 2019 Akadeemiline Põllumajanduse Selts. | © 2019 Estonian Academic Agricultural Society.
Introduction
Exports and international competitiveness are crucial driving forces of contemporary sectoral and economic development. This can explain the motivation of studies investigating competitiveness and economic development scenarios as an analysis and economic policy issue (Traill, Pitts, 1998; Bierut, Kuziemska- Pawlak, 2017; Auzina-Emsina et al., 2018). In spite of widespread subsidies for agriculture and rural develop- ment that might influence competitiveness, literature on investigation of agri-food sectors competitive performance in general and in European Union (EU) countries (Carraresi, Banterle, 2015; Harvey et al., 2017; Smutka et al., 2018) as well as country case studies (Qineti et al., 2009; Vitunskiene, Serva, 2015) have been developed.
There are rare studies to compare agri-food compe- titiveness between countries, four value chains, and before and after the European Union (EU) enlargement towards the East. More specifically, this paper investi- gates the key insights of revealed comparative advanta- ges focusing on four main agri-food product chains in the EU-27 member states (prior of accession of Croatia to EU): grain products, fruit and vegetable products, dairy products and meat products. Buturac et al. (2017) investigated Croatian agri-food international compe- titiveness, while Croatian dairy sector competitiveness by Frohberg et al. (2010). The specific contribution is synthesis and comparisons of own empirical results between EU-27 member states for four different agri- food value chains before and after the EU enlargement towards the East. Our focus is on comparisons of agri- food comparative advantages in the EU-27 countries by value chains before and after enlargement towards the
2 Paper in Press. Published on 24. October, 2019 as Manuscript JAS660719
East in 2004 (Estonia, the Czech Republic, Hungary, Latvia, Lithuania, Poland, Slovakia and Slovenia) and in 2007 (Bulgaria and Romania). In 2004, Cyprus and Malta joined the EU as well.
The remainder of the paper is organised as follows:
the next section presents materials and methods on revealed comparative advantage indices for agri-food exports by the EU-27 member states in global markets.
The following section reports and discuses result on revealed comparative advantage indices for main agri- food supply chains by the EU-27 member states in global markets. The final section draws some conclusions.
Materials and Methods
The concept of 'revealed' comparative advantage was introduced by Liesner (1958) and later redefined by Balassa (1965). This index empirically identifies a country's weak and strong export sectors (e.g. Bojnec, Fertő, 2014a). Balassa (1965) defined the Revealed Comparative Advantage (RCA) index as:
RCA = (Xij / Xit) / (Xnj / Xnt) (1)
where X represents exports, i is a country, j is a commodity, t is a set of commodities, and n is a set of countries that are used as the benchmark of comparison for export markets. RCA is based on observed export patterns. The results of the RCA index presented here are calculated at the World Customs Organisation's Harmonised System (HS) at the six-digit level. The calculated RCA indices at the six-digit level (in principle for 789 agri-food products/year/country, but the actual numbers of the RCA indices depend on the number of agri-food products exported by a certain EU country) are aggregated on the averages for subsectors of the Broad Economic Categories (BEC) for grain products, meat products and dairy products value chains exports, and on the averages for subsectors of the product groups of the Multilateral Trade Negotiations (MTN) for fruit and vegetable products value chain exports. Therefore, the presented results are calculated RCA averages for subsectors of the BEC/MTN categories from the HS at the six-digit level.
The RCA measures a country's exports of a commodity relative to its total exports and to the corres- ponding export performance of a set of countries, e.g.
the world's agri-food exports. If RCA > 1, then a country's agri-food comparative advantage in the world market is revealed. The benchmark of the RCA index is the world market in denominator indicating that world market includes both extra-EU trade and intra- EU trade. In this way, we aim to capture global agri- food export competitiveness within and outside EU markets.
Despite some critiques of the RCA index as an export specialisation index, such as the asymmetric value problem (Laursen, 2015), the problem with logarithmic transformation (De Benedictis, Tamberi, 2004), gross- versus value-added trade flows (Brakman, Van Marrewijk, 2017) and the importance of the simultaneous consideration of the import side (Vollrath, 1991), it can provide useful evidence regarding the competitiveness in academic and policy analyses (French, 2017), in our case for the EU-27 agri- food export competitiveness in global markets.
The period of this study covers the years between 2000 and 2011. This retrospective approach and studied period have been selected due to captures similar length of the years pre and post EU enlargement towards the East. Following the literature on international trade liberalization and RCA index (Balassa, 1961, 1965), our main assumption is that the EU enlargement towards the East might have strengthened product specialization towards comparative advantages and utilization of economies of scale with positive effects on the EU-27 agri-food export competitiveness in global markets.
The UN Comtrade database – International Trade Statistics at the six-digit harmonised commodity description and coding systems (HS6-1996) is used for agri-food exports of the EU-27 countries to world markets. Agri-food trade as defined by the World Customs Organisation contains 789 product groups.
The UN Comtrade database is used with the World Integrated Trade Solution (WITS) software developed by the World Bank, in close collaboration and consultation with various international organisations, including the United Nations Conference on Trade and Development (UNCTAD), the International Trade Center (ITC), the United Nations Statistical Division (UNSD, 2018) and the WTO (2018).
Results and Discussion
Comparative advantage indices for agri-food exports by the EU-27 member states in global
markets
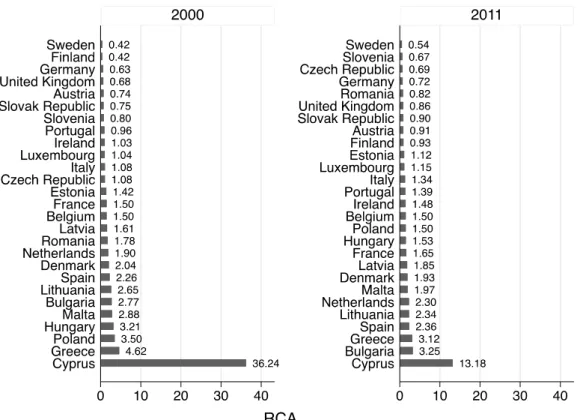
The revealed comparative advantage (RCA) indices differ between the EU-27 countries. The EU enlarge- ments have slightly increased the agri-food export com- petitiveness of the EU-27 countries in global markets as a whole, and particularly of some of the established EU-15 countries (Figure 1).
The results for the RCA indices illustrate that most of the EU-27 countries had a mean value of RCA>1 for agri-food exports in /to the world markets in 2011, thus indeed indicating revealed comparative advantages.
However, in most of these countries, the median values amounted to less than 0.5 which in turn suggests that the majority of agri-food products exhibited revealed comparative disadvantages (RCA<1).
Figure 1. Mean values of RCA indices for agri-food exports in global markets for the EU-27 member states in 2000 and 2011 Source: Authors' calculations based on the UNSD Comtrade database with WITS (World Trade Integration Solution) software.
Comparative advantage indices for main agri-food value chains exports by the EU-27 member states
in global markets
Grain products value chain. Grain products value chain international competitiveness varies between the EU-27 countries (Svatoš et al., 2010; Bojnec, Fertő, 2016a). Particularly focussing on grain products, some new EU-12 member states could strengthen their export competitiveness (revealed comparative advantage with RCA > 1 indices) in the global grain markets (Figu- re 2): Bulgaria, Estonia, Hungary, Latvia, Lithuania, Romania, and Slovakia. A result that is also valid for some of the old EU-15 member states, namely Austria, Denmark, Finland, France, Ireland, Luxembourg, the Netherlands, and Spain.
Moreover, a deterioration pattern in export compe- titiveness in the global grain markets was experienced by Belgium, Cyprus, and Greece.
Revealed comparative disadvantages existed for the Czech Republic, Germany, Italy, Malta, Portugal, Slovenia, Sweden, and the United Kingdom (UK).
To quantify differences within the class of grain products, the analysis considers a more disaggregated level selecting the following BEC product groups: BEC 21 with primary grain products, BEC 111 with primary grain products mainly for industry, BEC 121 with processed grain products for industry, and finally the BEC 122 with processed grain food and grain products intended for final consumption in households. Figure A1 in Appendix presents disaggregated calculated RCA index results for grain products value chain exports.
As regards BEC 21, Austria, Bulgaria, Estonia, France, Hungary, Ireland, Latvia, Lithuania, Romania, Slovakia, and Sweden strengthened their revealed comparative advantage for the, while the other EU-27 member states largely suffered revealed comparative disadvantages in the global BEC markets.
Turning to the global markets for BEC 111, Bulgaria, France, Greece, Hungary, and Lithuania, and in most recent years also Denmark, Estonia, Latvia, Luxem- bourg, Poland, and Romania could gain revealed com- parative advantages.
For the BEC 121, revealed comparative advantages could be experienced by Bulgaria, Cyprus, France, Hungary, Lithuania, Luxembourg, the Netherlands, Poland, and Spain, and in most recent years also Austria, Belgium, Denmark, Estonia, Finland, Greece, Ireland, Italy, Latvia, Portugal, and Slovakia.
In the global markets for BEC 122, revealed compa- rative advantages were gained by Austria, Belgium, Finland, France, Latvia, Lithuania, Slovakia, Spain, the UK, and in most recent years also Bulgaria, Cyprus, Denmark, Estonia, Ireland, and, to a lesser extent, the Netherlands.
Fruit and vegetable products value chain. In spite of the increasing importance of fruit and vegetables products value chain in developed countries nutrition, it has attracted less academic attention regarding their international competitiveness (Bojnec, Fertő, 2015, 2016b). In the group of fruit and vegetable products exports, only the three-member states Spain, Greece and Cyprus could achieve higher values of the RCA indices in the global markets than the other EU-27 countries (Figure 2).
4 Paper in Press. Published on 24. October, 2019 as Manuscript JAS660719
Figure 2. Mean values of RCA indices for grain products, fruit and vegetable products, dairy products and meat products exports in global markets for the EU-27 member states, averages of the years in the period 2000–2011
Source: Authors’ calculations based on the UNSD Comtrade database with WITS (World Trade Integration Solution) software.
In addition, revealed comparative advantages were observed by the following EU-27 member states:
Belgium, Bulgaria, France, Hungary, Italy, the Nether- lands, Poland, and in most recent years also Lithuania, and Portugal.
However, considering the product groups of the MTN, then the corresponding results were different.
Figure A2 in Appendix presents disaggregated RCA index results for fruit and vegetable products value chain exports. The analysis was conducted via the following MTN product groups: MTN 1201, with fruit and vegetables fresh or dried products, MTN 1202 denoting fruit and vegetables semi-processed products and MTN 1203 containing fruit and vegetables prepared or preserved products.
For MTN 1201, Cyprus, France, Greece, Italy, the Netherlands, Spain, and in most recent years Lithuania and Portugal gained/had revealed comparative advanta- ges in these global markets.
For MTN 1202, the countries Bulgaria, Estonia, Greece, Italy, Lithuania, Poland, Romania, Spain, and in most recent years Belgium, Latvia, and the Nether- lands achieved revealed comparative advantages in the global markets.
Finally, for MTN 1203, Belgium, Bulgaria, France, Greece, Hungary, Italy, the Netherlands, Poland, Spain, and in most recent years Portugal realised revealed comparative advantages.
Dairy products value chain. Dairy products are important agri-food sector in EU-27 member states and in global agri-food trade. This can be also a reason that more studies have investigated export competitiveness of dairy products (Drescher, Maurer, 1999; Tacken et al., 2009; Van Berkum, 2009; Bojnec, Fertő, 2014a;
Couillard, Turkina, 2015; Irz, Jansik, 2015; Viira et al., 2015; Krieviňa et al., 2016; Balogh, Jambor, 2018).
Concerning dairy products exports, revealed compa- rative advantages in the global markets could be achieved by Austria, Belgium, Cyprus, Denmark, Esto- nia, France, Germany, Greece, Ireland, Latvia, Lithua- nia, Luxembourg, the Netherlands, Poland, Portugal, and in most recent years also Finland, Slovenia and Spain (Figure 2).
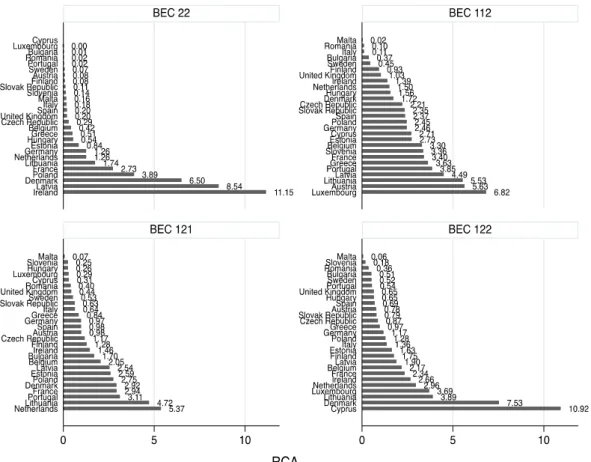
Figure A3 in the Appendix presents disaggregated calculated RCA index results for dairy products value chain exports. For the BEC 22 including industrial dairy supplies not elsewhere specified or processed, revealed comparative advantages could be gained by Denmark, France, Germany, Ireland, Latvia, and Poland.
Looking at the group of primary dairy products mainly for households’ consumption as specified in BEC 112, more than half of the EU member states realised revealed comparative advantages, namely Austria, Belgium, Denmark, Estonia, France, Ger- many, Greece, Ireland, Lithuania, Luxembourg, the Netherlands, Portugal, Slovakia, Slovenia, Spain, and in most recent years also the Czech Republic, Finland, Hungary, Latvia, Poland, and the UK.
Almost the same goes for BEC 121 with processed dairy products mainly for industry. Here as well, a large group of member states experienced revealed compara- tive advantages: Belgium, Denmark, Estonia, France, Lithuania, the Netherlands, Poland, Portugal, and in most recent years also Bulgaria, Cyprus, Finland, Germany, Greece, Ireland, Latvia, and Spain.
Finally, exports to the global markets in the group of BEC 122 containing processed food and dairy products intended for final consumption in households also helped a relatively large number of EU-27 countries to get revealed comparative advantages: Belgium, Den- mark, Estonia, France, Germany, Ireland, Italy, Latvia, Lithuania, Luxembourg, the Netherlands, and in most recent years Finland, Greece, Poland, and Sweden.
In summary, these results indicate export compe- titiveness for various dairy products for a large number of the EU-27 member states. The crucial role in dairy trade competitiveness can play processed products (Bojnec, Fertő, 2008).
Meat products value chain. Meat and meat products export competitiveness of EU countries on global markets have already attracted attention (Banterle, Carraresi, 2007; Fischer, Schornberg, 2007; Bojnec, Fertő, 2014b; Torok, Jambor, 2016). Considering meat products exports, the group of EU-countries that achieved revealed comparative advantages in the global markets including Belgium, Bulgaria, Cyprus, Denmark, France, Hungary, Ireland, the Netherlands, Poland, Spain, and in most recent years the UK also (Figure 2).
Having a closer look at more specific meat product groups, the group of countries with revealed compara- tive advantages in the global markets is changing both in number and in size (Figure A4 in Appendix):
Regarding only the primary meat products in BEC 21, revealed comparative advantages could be achieved by Belgium, Bulgaria, Cyprus, Denmark, Greece, Spain, the UK, and in most recent years also Austria, the Netherlands, and Slovakia.
For the group BEC 22 with industrial meat supplies not elsewhere specified or processed, the number of countries with revealed comparative advantages decli- ned including Belgium, France, Slovakia, the UK, and, to a lesser extent, Denmark, and in most recent years Ireland, Italy, Portugal, and Spain.
In contrast to the just mentioned product group, BEC 121 with processed meat products mainly for industry, more countries scored revealed comparative advan- tages: Belgium, Denmark, France, Hungary, Italy, the Netherlands, Poland, Spain, and in the most recent years also Austria, Cyprus, Germany, and Lithuania.
Turning to processed food and meat products inten- ded for final consumption in households in the BEC 122, again a relatively large number of countries rea- lised revealed comparative advantages, namely Bel- gium, Bulgaria, Cyprus, Denmark, France, Hungary, Ireland, the Netherlands, Poland, Spain and in most recent years Lithuania and the UK.
In summary, Belgium, Cyprus, Denmark, France, Hungary, the Netherlands, and Spain are the EU-27 member states, which most frequently are competitive regarding meat products exports in the global markets.
Conclusion
The objective of this paper was to identify the EU-27 member states strong exports sectors and food chains.
The revealed comparative advantage indices from the available trade data were calculated for the EU-27 member states using the total global trade as the bench- mark of comparison. The empirical results indicate mixed revealed comparative advantage indices for agri- food products for each of the EU-27 countries in world markets, i.e. the calculated levels and patterns failed to indicate a unique development in the analysed period.
Moreover, our main assumption that the EU enlarge- ment towards the East might have increased the EU-27 agri-food export competitiveness was only partly approved. We have found that the EU enlargements from EU-15 to EU-27 was of limited effect since they only slightly increased the agri-food export compe- titiveness (RCA > 1) of the EU-27 countries in global markets as a whole, and in particular of some estab- lished EU-15 countries. This can be explained by a fact that the new EU member states might need more time to restructure and specialize their agri-food products value chains towards comparative advantages and utilization of economies of scale to compete with EU and other global competitors in intra- and extra-EU trade flows. However, the findings could identify/
prove the three established countries Netherlands, France and Spain as the most successful member states in agri-food export competitiveness in global markets.
Looking at the development of the export compe- titiveness indices for agri-food products for each of the EU-27 countries in global markets, the calculations yielded mixed levels and patterns. Differences between the EU-27 member states were also identified for the main four agri-food product groups. In the global grain markets, an increase of revealed comparative advan- tage indices was true for, firstly the new EU-12 member states Bulgaria, Estonia, Hungary, Latvia, Lithuania, Romania, and Slovakia, and secondly, the old EU-15 member states Austria, Denmark, Finland, France, Ireland, Luxembourg, the Netherlands, and Spain. In the global fruit and vegetable markets, Spain, Greece and Cyprus achieved strong revealed comparative advantage indices, followed by Belgium, Bulgaria, France, Hungary, Italy, the Netherlands, Poland, and, during the most recent years Lithuania and Portugal also. In the global dairy markets relatively high revea- led comparative advantage indices could be realised by
6 Paper in Press. Published on 24. October, 2019 as Manuscript JAS660719
Austria, Belgium, Cyprus, Denmark, Estonia, France, Germany, Greece, Ireland, Latvia, Lithuania, Luxem- bourg, the Netherlands, Poland, Portugal, and, during the most recent years, also Finland, Slovenia and Spain.
These results imply that there really was high export competitiveness for most of the EU-27 member states in the global dairy markets. As compared to the former product group, in the global meat markets only a smaller number of countries could gain good revealed comparative advantage indices: Belgium, Bulgaria, Cyprus, Denmark, France, Hungary, Ireland, the Netherlands, Poland, Spain, and during the most recent years also the UK.
The results suggest that most competitive EU-27 countries in a certain agri-food product do not neces- sarily represent a significant proportion of total EU-27 countries agri-food production and exports. Agri-food export competitiveness does not depend only on less or more favourable natural conditions for agricultural production and/or on less or more favourable structure of agricultural holdings, but also on some other factors of competitiveness in agri-food value chains as an issue for further research. Among study limitations, the presented results are based on calculated RCA index as a relative indicator of export competitiveness. In research in future it can be used in conjunction with some other trade indicators such as export unit price, average annual growth rate of export and other to display country export competitiveness.
The current paper focuses on pre- and post-EU enlargement agri-food export competitiveness. Mean- while Croatia joined the EU and the UK is in a stage of Brexit. Yet, most EU countries have experienced the recession affecting their agri-food sector performance and export competitiveness. In addition, some impor- tant drivers of export competitiveness especially for dairy, meat and fruit markets are not captured in our results such as Russian embargo and African swine fever. Therefore, the update of data sample, recalcu- lation with the updated datasets and drivers of export competitiveness are challenge for research in future.
Conflict of interest
The authors declare that they have no conflict of interest.
Author contributions
SB study conception and design; interpretation of data;
drafting of the manuscript; critical revision and approval of the final manuscript.
IF acquisition of data; data analysis and drafting of the manuscript.
References
Auzina-Emsina, A., Ozolina, V., Pocs, R. 2018.
Competitiveness and economic development scenarios of Latvia. – Business, Management and Education, 16(1):40–53, doi: 10.3846/bme.2018. 2399.
Balassa, B. 1961. The Theory of Economic Integration.
London, George Allen & Unwin Ltd.
Balassa, B. 1965. Trade liberalization and revealed comparative advantage. – The Manchester School of Economic and Social Studies, 33(2):99–123.
Balogh, J.M., Jambor, A. 2018. On the duration of comparative advantages: The case of European cheese industry. – Bulgarian Journal of Agricultural Science, 24(1):1–7.
Banterle, A., Carraresi, L. 2007. Competitive perfor- mance analysis and European Union trade: The case of the prepared swine meat sector. – Acta Agricultu- rae Scandinavica: Section C. Food Economics, 4(3):159–172, doi: 10.1080/ 16507540701597048.
Bierut, B.K., Kuziemska-Pawlak, K. 2017. Competi- tiveness and export performance of CEE countries. – Eastern European Economics, 55(6):522–542.
Bojnec, Š., Fertő, I. 2008. Dairy trade competitiveness:
crucial role of processed products. – Milchwissen- schaft, 63(4):434–438.
Bojnec, Š., Fertő, I. 2014a. Export competitiveness of dairy products on global markets: The case of the European Union countries. – Journal of Dairy Science, 97(10):6151–6163, doi: 10.3168/jds.2013- 7711.
Bojnec, Š., Fertő, I. 2014b. Meat export competitive- ness of European Union countries on global markets.
– Agricultural and Food Science, 23(3):194–206, doi:
10.23986/afsci.9373.
Bojnec, Š., Fertő, I. 2015. Fruit and vegetable trade competitiveness of European Union countries. – Mitteilungen Klosterneuburg Rebe und Wein, Obstbau und Früchteverwertung, 65(1):56–71.
Bojnec, Š., Fertő, I. 2016a. Drivers of the duration of grain competitiveness in European Union countries. – Journal of Agricultural Science and Technology, 18(5):1173–1185.
Bojnec, Š., Fertő, I. 2016b. Export competitiveness of the European Union in fruit and vegetable products in the global markets. – Agricultural Economics – Czech, 62(7):299–310, 10.17221/156/2015- AGRICECON.
Brakman, S., Van Marrewijk, C. 2017. A closer look at revealed comparative advantage: gross-versus value- added trade flows. – Papers in Regional Science, 96(1):61–92, doi: 10.1111/pirs.12208.
Buturac, G., Lovrinčević, Ž., Mikulić, D. 2017.
International competitiveness and restructuring of the Croatian food industry. – Acta Oeconomica, 67(3):435–462, doi: 10.1556/032.2017.67.3.7.
Carraresi, L., Banterle A. 2015. Agri-food competitive performance in EU Countries: A fifteen-year retrospective. – International Food and Agribusiness Management Review, 18(2):37–62.
Couillard, C., Turkina E. 2015. Trade liberalisation: The effects of free trade agreements on the competitiveness of the dairy sector. – The World Economy, 38(6):1015–1033, doi: 10.1111/twec. 12181.
De Benedictis, L., Tamberi, M. 2004. Overall specialization empirics: techniques and applications.
– Open Economies Review, 15(4):323–346, doi:
10.1023/B:OPEN.0000048522.97418.99.
Drescher, K., Maurer, O. 1999. Competitiveness of the European dairy industries. – Agribusiness, 15(2):163–177.
Fischer, C., Schornberg, S. 2007. The competitiveness situation of the EU meat processing and beverage manufacturing sectors. – Acta Agriculturae Scandinavica Section C, 4(3):148–158, doi:
10.1080/16507540701597139.
French, S. 2017. Revealed comparative advantage:
what is it good for? – Journal of International Economics, 106(C):83–103, doi: 10.1016/j.jinteco.
2017.02.002 .
Frohberg, K., Zier, P., Möllers, J., Buchenrieder, G.
2010. Croatia's dairy sector – Can it compete in the European Market? – International Advances in Economic Research, 16(2):223–236, doi: 10.1007/
s11294-009-9253-4.
Harvey, D., Hubbard, C., Gorton, M., Tocco, B. 2017.
How competitive is the EU's agri-food sector? An introduction to a special feature on EU agri-food competitiveness. – Journal of Agricultural Economics, 68(1):199–205, doi: 10.1111/1477- 9552.12215.
Irz, X., Jansik, C. 2015. Competitiveness of dairy farms in northern Europe: A cross-country analysis. – Agricultural and Food Science, 24(3):206–218, doi:
10.23986/afsci.50881.
Krieviňa, A., Hâzners, J., Melece, L. 2016. Competi- tiveness of Latvian dairy sector: Productivity and export. – Research for Rural Development, 2:181–
188.
Laursen, K. 2015. Revealed comparative advantage and the alternatives as measures of international specialization. – Eurasian Business Review, 5(1), 99–
115, doi: 10.1007/s40821-015-0017-1.
Liesner, H.H. 1958. The European Common Market and British industry. – Economic Journal, 68(270):
302–316, doi: 10.2307/2227597.
Qineti, A., Rajcaniova, M., Matejkova, E. 2009. The competitiveness and comparative advantage of the Slovak and the EU agri-food trade with Russia and Ukraine. – Agricultural Economics – Czech, 55(8):375–383.
Smutka, L., Maitah, M., Svatoš, M. 2018. Changes in the Czech agrarian foreign trade competitiveness – different groups of partners' specifics. – Agricultural Economics – Czech, 64(9):399–411.
Svatoš, M., Smutka, L., Miffek, O. 2010. Competitive- ness of agrarian trade of EU-15 countries in comparison with new EU member states. – Agricultural Economics – Czech, 56(12):569–582, doi:10.17221/129/2010-AGRICECON.
Tacken, G.M.L., Batowska, A, Gardebroek, C., Nesha Turi, K., Banse, M., Wijnands, J.H.M., Poppe, K.J.
2009. Competitiveness of the EU dairy industry. – Report 2009-011 March 2009 Project code 20964 LEI Wageningen UR, The Hague.
Torok A., Jambor A. 2016. Determinants of the revealed comparative advantages: The case of the European ham trade. – Agricultural Economics – Czech, 62(10):471–482, 10.17221/177/2015- AGRICECON.
Traill, W.B., Pitts, E. (eds.) 1998. Competitiveness in the food industry. London, Blackie Academic &
Professional.
United Nations Statistical Division (UNSD). 2018.
Commodity Trade Database (COMTRADE).
Available through World Bank's World Integrated Trade Solution (WITS) at: http://www.wits.
worldbank. org [Accessed 20 March 2018].
Viira, A.-H., Omel, R., Värnik, R., Luik, H., Maasing, B., Põldaru, R. 2015. Competitiveness of the Estonian dairy sector, 1994–2014. – Agraarteadus, 26(2):84–
105.
Vollrath, T.L. 1991. A theoretical evaluation of alternative trade intensity measures of revealed comparative advantage. – Weltwirtschaftliches Archiv, 130(2):263–279.
Van Berkum, S. 2009. Dairy chain competitiveness in EU's new member states, candidate and potential candidate countries. – German Journal of Agricultural Economics, 58(7):314–323.
Vitunskiene, V., Serva, E. 2015. Shifts in Lithuania’s agri-food industry export competitiveness: a comparative analysis versus high- and medium-high technology manufacturing industries. – Oeconomia Copernicana, 6(1):7–31, doi: 10.12775/OeC.2015.
001.
World Trade Organisation (WTO). 2018. International Trade Statistics. Geneva: World Trade Organisation.
Available at: http://www.wto.org/english/res_e/
statis_e/its_e.htm [Accessed 20 March 2018].
8 Paper in Press. Published on 24. October, 2019 as Manuscript JAS660719
Appendix
Figure A1. Mean values of RCA indices for grain products value chain exports in global markets for the EU-27 member states, averages of the years in the period 2000–2011
Source: Authors' calculations based on the UNSD Comtrade database with WITS (World Trade Integration Solution) software.
Figure A2. Mean values of RCA indices for fruit and vegetable products value chain exports in global markets for the EU-27 member states, averages of the years in the period 2000–2011
Source: Authors' calculations based on the UNSD Comtrade database with WITS (World Trade Integration Solution) software.
Figure A3. Mean values of RCA indices for dairy products value chain exports in global markets for the EU-27 member states, averages of the years in the period 2000–2011
Source: Authors' calculations based on the UNSD Comtrade database with WITS (World Trade Integration Solution) software.
Figure A4. Mean values of RCA indices for meat products value chain exports in global markets for the EU-27 member states, averages of the years in the period 2000–2011
Source: Authors' calculations based on the UNSD Comtrade database with WITS (World Trade Integration Solution) software.