Introduction
The COVID-19 pandemic has affected many aspects of what we understand as ‘normality’. Looking back at 2020, the implementation of lockdowns and other restrictive measures became a worldwide strategy to curb the spread of the virus.
These measures have heavily affected the hotel, restaurant, and catering (HORECA) sector, the activities of local retail- ers, the way in which we work and possibilities for travelling.
Since March 2020, various global economic outlooks have reported on the potential impact of the pandemic on GDP (World Bank, 2020; IMF, 2020; OECD, 2020a). Most of these focus on the consequences globally or for large world regions, lacking insights at country and sector levels1, especially in the European Union (EU).
The course of 2020 revealed that the sectors most affected by the pandemic were those with a lower share of jobs demanding tertiary education (McKinsey, 2020).
However, the agri-food industry was extremely resilient in responding to a challenging context characterised by the lack of (or extremely low) demand from the HORECA sector, the ‘stockpiling’ behaviour of consumers in the early days of the pandemic, the increase in e-commerce, initial labour shortages, and some disruptions in logistics (OECD, 2020b;
WTO, 2020). Since the start of the pandemic, a variety of measures were implemented by the EU and at Member State level, with the aim of providing social safety nets and finan- cial liquidity in agriculture and other sectors.
1 OECD (2020c) uses the AGLINK-COSIMO model to simulate two different scenarios which assume a single and a second wave for the spread of the virus respec- tively. The study indicates a progressive reduction of agricultural output in response to lower consumer demand; with livestock production expected to experience larger declines than cereal production.
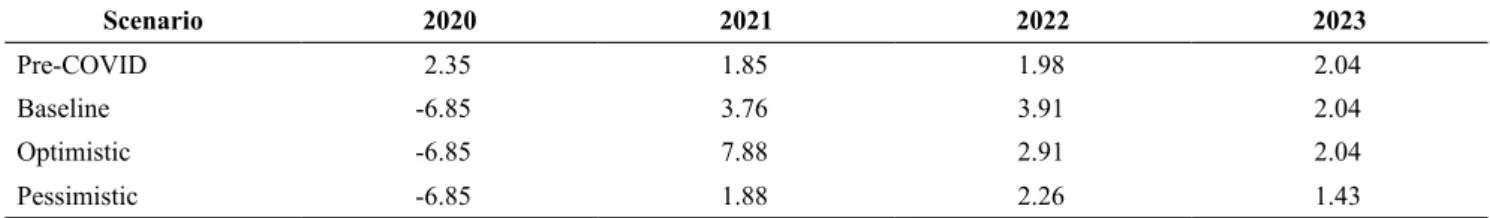
This paper aims at assessing how COVID-19 affected the agriculture and food sectors in selected EU Member States – the Netherlands, Germany, Italy, and Hungary – and exploring potential mid-term recovery pathways by using the AGMEMOD (Agricultural Member State Modelling) model. The recovery pathways are captured in a baseline and two extreme scenarios, based on differing economic prospects. The main drivers are the degree of success of the vaccination campaign, removals of lockdown measures, implementation of recovery packages, and the magnitude of permanent damages to productive capacity caused by the virus outbreak and containment measures. More specifically, an optimistic scenario assumes that the vaccination cam- paign delivers positive outcomes which permit the economy to return to pre-COVID rates of growth by 2023. In contrast, a pessimistic situation is also considered in which vaccina- tion would happen at a slower path with successive waves of coronavirus pandemic delaying economic recovery. The baseline scenario is consistent with the expected economic developments for the period 2020-2022 as projected by the World Bank (World Bank, 2021) for the Euro Area, Bulgaria, Croatia, and Poland.
Methodology
For assessing the consequences of alternative COVID-19 recovery pathways for the agri-food sector, a simula- tion exercise using the AGMEMOD model2 is carried out.
AGMEMOD is a dynamic, partial, multi-country, multi- market equilibrium system which represents the main
2 The AGMEMOD model (Agricultural Member State Modelling) documentation is available at: https://agmemod.eu/.
Short communication
Ana Rosa GONZALEZ-MARTINEZ*, Roel JONGENEEL*, Petra SALAMON**, Annalisa ZEZZA***, Federica DE MARIA*** and Norbert POTORI****
The COVID-19 pandemic and the EU agri-food sector: Member State impacts and recovery pathways
This paper investigates the effects of three different simulated post-COVID-19 recovery GDP growth rates during 2021-2023 (baseline, optimistic and pessimistic scenarios) for agricultural markets in four selected EU Member States (the Netherlands, Germany, Italy, and Hungary) compared to a pre-COVID-19 projection. Empirical results are derived from the AGMEMOD model. A self-sufficiency ratio is utilised to summarise the net effects on consumption and supply in the agricultural markets.
The country level analysis confirms that the agriculture sector in the EU has been quite resilient during the pandemic. The simulated impacts of the different GDP shocks on the agri-food sector are limited, which also conforms to reality, but changes in consumer behaviour could lead to longer lasting impacts on specific sectors.
Keywords: COVID-19, agri-food sector, AGMEMOD model, GDP shocks JEL classification: Q11, Q12, Q18
* Wageningen University & Research, 6708 PB Wageningen, The Netherlands. Corresponding author: ana.gonzalezmartinez@wur.nl
** Johann Heinrich von Thünen-Institut, Bundesallee 50, 38116 Braunschweig, Germany.
*** Council for Agricultural Research and Agricultural Economy Analysis, Via Po, 14 - 00198 Rome, Italy.
**** Institute of Agricultural Economics Nonprofit Kft., Zsil utca 3-5., 1093 Budapest, Hungary.
Received: 16 October 2021, Revised: 10 November 2021, Accepted: 12 November 2021
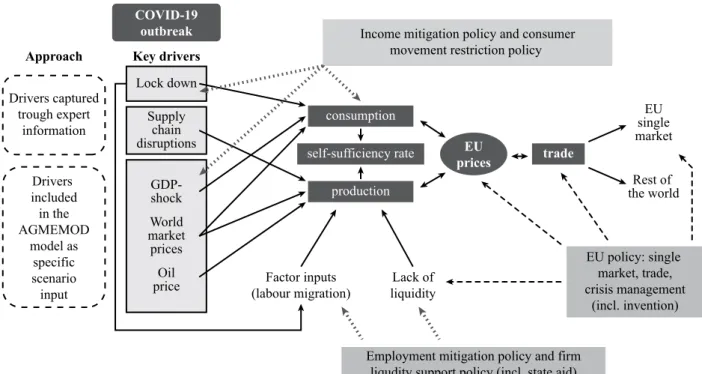
agricultural sectors in each EU Member State. The model incorporates behavioural responses of economic agents to changes in agricultural prices and policy instruments. How the pandemic has affected the agri-food sector, and how and the associated measures implemented by the EU and at Member State level were translated into assumptions about the rate of economic growth are summarised in Figure 1.
At the time of carrying out this assessment, the World Bank outlook (World Bank, 2021) was the most up-to-date.
Since AGMEMOD is Member-State specific, information at country level is required for each scenario. Consequently, the economic prospects for the Euro Area as a whole need to be translated into country-specific projections. In doing so, the distribution projected by OECD (2020a) is applied to the aggregate World Bank figures. For countries which are not included in the OECD outlook, the projected rates of growth are taken from the World Economic Outlook October 2020 published by IMF. For the period 2023-2030, it is assumed that the economy will grow at the same ‘speed’, i.e. rate of growth, as could have been expected if the COVID-19 outbreak had never happened. For the selected Member States (the Netherlands, Italy, Germany, and Hungary) GDP assumptions were taken from national statistical sources for 2020 and 2021.
Of the three recovery pathways, the extreme optimistic and pessimistic scenarios are modelled for sensitivity pur- poses. The pessimistic scenario attempts to simulate the potential negative consequences of an unsuccessful vaccina- tion campaign, the emergence of new variants of the coro- navirus, negative economic sentiment, as well as important losses of productive capacity resulting from deterioration in the quality of education during this period and the shutdown of companies among other factors. All these could delay eco- nomic recovery with ‘pre-COVID’ GDP growth rates only
reached by 2029. In this extreme scenario, the 2021 rates of growth are assumed to be half of those in the reference scenario. For 2022 and 2023, GDP growth rates are assumed to be 60% and 70% of the expected GDP rates for 2021 and 2023, respectively, in the baseline. For 2024, 80% of the average of the expected 2025 rate of growth in the baseline and the rate of growth in the previous year of the scenario are assumed. For the period 2026-2028, the rates of growth are calculated by applying the following percentages for the baseline rates of growth for the corresponding year: 80%, 85%, and 90% for 2026, 2027, and 2028, respectively.
The optimistic scenario assumes a successful vaccina- tion campaign which leads to the containment of the virus in early 2022, accompanied by public measures which promote private sector investments and favour structural reforms sup- porting future economic growth. The GDP level that corre- sponds to this scenario is calculated as the average value of the projected GDP levels that were expected in March 2020 (2019 AGMEMOD baseline) and the current baseline. GDP developments that were assumed for each scenario are pre- sented in Table 1 and Figure 2.
Other important scenario inputs are world market prices, oil prices, inflation, and exchange rates. The expected devel- opments for exchange rates over the period 2020-2022 are taken from the OECD Economic Outlook (OECD, 2020a). Oil prices are updated to reflect the situation in March 2020. The developments for world market prices indicate a return to the pre-COVID level by 20253. No differences in inflation rates among the scenarios are assumed. This is so since the optimis- tic and the pessimistic scenarios are simulated with the aim of examining the sensitivity of the results to changes in GDP.
3 Available at: https://ec.europa.eu/info/sites/info/files/food-farming-fisheries/farm- ing/documents/agricultural-outlook-2020-report_en.pdf.
Lock down Supply
chain disruptions
GDP-shock World market prices
priceOil Key drivers Approach
Factor inputs
(labour migration) Lack of liquidity consumption self-sufficiency rate
production
Employment mitigation policy and firm liqudity support policy (incl. state aid)
EU policy: single market, trade, crisis management
(incl. invention) singleEU market
Rest of the world COVID-19
outbreak
Drivers captured trough expert
information
Drivers included in the AGMEMOD
model as specific scenario input
Income mitigation policy and consumer movement restriction policy
pricesEU trade
Figure 1: Analytical framework.
Source: Own composition
Figure 3 provides a comparison of the assumptions made regarding the prospects for world market prices of broad agricultural commodity groups. These price assumptions take into consideration exchange rate impacts, among which some depreciation of the euro in relation to the dollar, con- firmed in early 2021, is particularly noteworthy.
Results
At the time of conducting this assessment, Dutch GDP was expected to decline by 6.2% in 2020. The impact of the COVID-19 crisis on the Dutch agri-food sector has turned out to be smaller than expected during the earlier days of the Table 1: GDP developments for EU27, average rate of growth (%).
Scenario 2020 2021 2022 2023
Pre-COVID 2.35 1.85 1.98 2.04
Baseline -6.85 3.76 3.91 2.04
Optimistic -6.85 7.88 2.91 2.04
Pessimistic -6.85 1.88 2.26 1.43
Source: Own compilation based on OECD (2020a), World Bank (2021) and others
-1010-8-6-4-202468
2020 2021 2022 2023
Rate of growth (%)
2020 2021 2022 2023
-1010-8-6-4-202468
Rate of growth (%)
2020 2021 2022 2023 2020 2021 2022 2023
The Netherlands
Italy
Germany
Hungary
Pre-COVID Baseline Optimistic Pessimistic Figure 2: GDP developments for selected MS, rate of growth (%).
Source: Own compilation based on OECD (2020a), World Bank (2021) and others
55 65 75 85 95 105 115
Pre-COVID,
crop price COVID scenarios, crop price
Pre-COVID,
meat price COVID scenarios, meat price
Pre-COVID,
dairy price COVID scenarios, dairy price
Pre-COVID,
oil price COVID scenarios,
oil price
Price Index (2019=100)
2019 2021 2024
Figure 3: World Market Prices.
Source: Own compilation based on OECD (2020a) and others
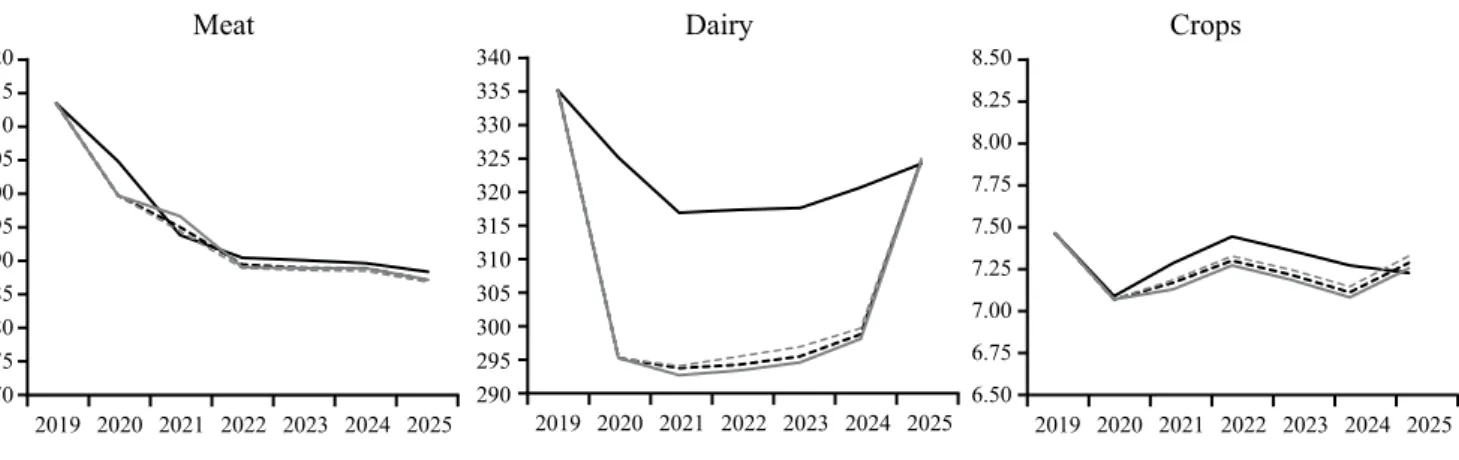
pandemic. Initial trade disruptions, labour shortages and the adoption of a variety of containment measures were the key elements threatening the sector. Nevertheless, the measures taken at national (and international) level, including the par- tial closure of the Dutch HORECA sector since October 2020, have left some ‘scars’ in terms of sales and prices. Lockdown measures led to a strong decline in international sales of prod- ucts such as flowers4 and potatoes; while domestically, con- sumers’ dietary concerns resulted in consumption increases of free-range eggs, milk, fruit, and vegetables. These effects on international and domestic sales were subsequently translated into price impacts leading, for example, to price increases for free-range eggs and vegetables. In contrast, potato prices are estimated to be around 16% lower for 2020 when compared the pre-COVID case and the COVID-19 scenarios, returning to a level of €14.4/100 Kg by 2022 in the baseline case.
When reporting the scenario outcomes, a synthetic indi- cator that condenses production and consumption develop- ments into a single element is used, i.e. the self-sufficiency rate5 (SSR) (Figure 4). In relative terms, dairy products ‘suf- fer’ more from the pandemic than crops or meat, which show only modest changes. The net demand for dairy products increased due to higher domestic and EU demand for fresh dairy products and cheese (irrespective of reduced exports, e.g. cheese to Japan), while milk production showed a slight increase. The result is a decrease in the self-sufficiency indicator. In the medium term, crop and dairy production are expected to remain slightly below the pre-pandemic situation, driven by price prospects at the international level.
Total consumption of dairy products is expected to remain around 3-5% below the pre-COVID case over 2020-2024 in the pessimistic case.
In Germany, GDP fell significantly in 2020, by around 5.3%. During 2020, the closure of the HORECA sector and
4 In the first weeks of the pandemic, Dutch prices for ornamentals were 30-50%
lower than usual with a significant share of the supply having to be destroyed. See, also: https://www.floraldaily.com/article/9199470/ornamental-industry-trying-to-sur- vive-covid-19-frenzy/.
5 The indicator is calculated as production/consumption ×100. Several considerations should be kept in mind when interpreting the outcomes. The meat indicator is not ‘track- ing’ trade of live animals. The dairy indicator is a weighted average (based on fat content) including cheese, butter, drinking milk, cream, fresh dairy products, SMP and WMP.
The crop indicator covers durum wheat, soft wheat, oats, barley, maize, triticale, rye, rapeseed, soybean, and sunflower. Weighting factors are based on end uses of each crop.
the services delivered by contact-based professions were compensated to a relatively high degree by increases in manufacturing. In general terms, agri-food was affected by shifts in demand. Other important elements that ‘shaped’
the development of the agri-food sector were COVID-19 outbreaks in some food-processing firms, a shortage of sea- sonal workers, increases in operating costs related to meas- ures for preventing the spread of the virus, as well as mar- ket developments at the global level. Increases in demand for organic products, fresh fruit and vegetables were led by private households. In contrast, the closure of restaurants led to a reduced consumption of beef, frozen vegetables, and potatoes.
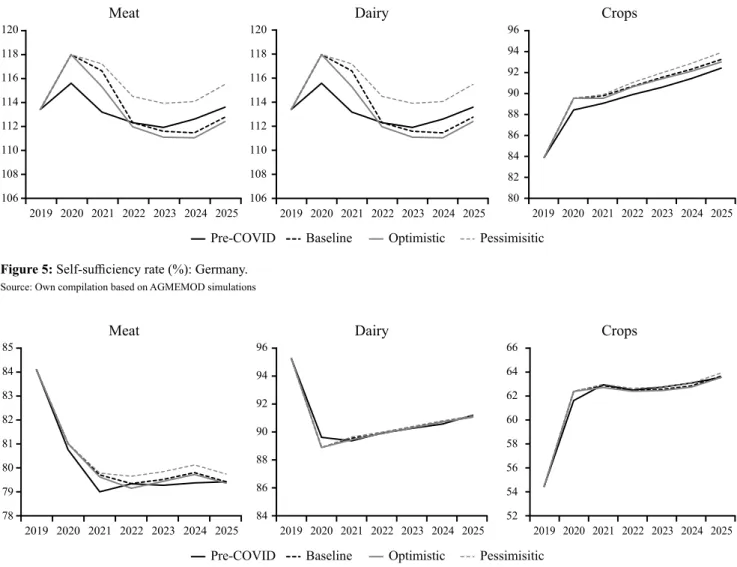
When aggregating the outcomes of the simulations, the German agri-food sector appears to be affected only to a limited extent. Stronger impacts are identified in the self- sufficiency rates of meat (Figure 5). It is important to note, however, that the pre-COVID baseline does not reflect the impacts of the African Swine Fever (ASF) outbreak in Sep- tember 2020. All the scenarios suggest that self-sufficiency rates will increase at least until 2023 compared to the situ- ation before the pandemic. In general, domestic demand is expected to be sluggish due to reduced economic activity.
This would eventually create a need for exporting the sur- plus at reduced international prices, reinforcing the sub- liminal trend of meat consumption decline. This situation could prevail until 2025 in the pessimistic scenario. In the case of dairy, the pre-COVID baseline shows a higher self- sufficiency rate, reflecting lower world market prices. This expected trend could lead to a slight production decline.
Nevertheless, the impacts of the COVID-19 scenarios on the self-sufficiency rate of the dairy sector are expected to be low although marginally stronger in the pessimistic case. In general, the self-sufficiency rates of crops are expected to be only marginally affected.
In 2020, Italian GDP showed a strong 8.8% contraction.
The total or partial closure of the HORECA sector affected the various supply chains differently. Sectors such as wine, fish and horticulture were the ones that suffered the most.
However, an improvement in the agri-food trade balance was registered by the end of 2020. Compared to the previous year, the trade surplus exceeded 3 billion euros, given the stability of exports and a 5.1% decrease in imports. Exports
170 175 180 185 190 195 200 205 210 215 220
2019 2020 2021 2022 2023 2024 2025 290 295 300 305 310 315 320 325 330 335 340
6.50 6.75 7.00 7.25 7.50 7.75 8.00 8.25 8.50
Pre-COVID Baseline Optimistic Pessimisitic
Meat Dairy Crops
2019 2020 2021 2022 2023 2024 2025 2019 2020 2021 2022 2023 2024 2025
Figure 4: Self-sufficiency rate (%): Netherlands.
Source: Own compilation based on AGMEMOD simulations
Pre-COVID Baseline Optimistic Pessimisitic 106
108 110 112 114 116 118 120
2019 2020 2021 2022 2023 2024 2025 106 108 110 112 114 116 118 120
2019 2020 2021 2022 2023 2024 2025 80 82 84 86 88 90 92 94
Meat Dairy 96 Crops
2019 2020 2021 2022 2023 2024 2025
Figure 5: Self-sufficiency rate (%): Germany.
Source: Own compilation based on AGMEMOD simulations
Pre-COVID Baseline Optimistic Pessimisitic 78
79 80 81 82 83 84 85
84 86 88 90 92 94 96
52 54 56 58 60 62 64
Meat Dairy 66 Crops
2019 2020 2021 2022 2023 2024 2025 2019 2020 2021 2022 2023 2024 2025 2019 2020 2021 2022 2023 2024 2025
Figure 6: Self-sufficiency rate (%): Italy.
Source: Own compilation based on AGMEMOD simulations
of pasta, rice, olive oil and tomato preserves increased.
Declines in imports were mainly registered for cereals, fish products, baked goods, and cheeses. As shown in the sce- nario simulations (Figure 6), the value of dairy exports is expected to recover to the pre-COVID level only by 2024 given the expected decline in global demand and prices.
An increase in domestic demand for meat products was observed in 2020, leading to a lower self-sufficiency rate.
The scenarios suggest that per capita consumption could sta- bilise by 2022. For crops, available data for 2020 confirms the simulation results, with marginal changes when compar- ing the pre-COVID baseline with the pandemic situation.
Nevertheless, the decrease in prices for the three sectors raises some concerns regarding the impact on farm incomes.
In general terms, prices are expected to return to pre-COVID levels only by 2025.
Taking Hungary in Central-Eastern Europe as an exam- ple, Hungarian GDP declined by -5.0% in 2020. The slow- down of economic activities is expected to have a notice- able and, with respect to the projected strengthening of meat prices, lasting impact on meat consumption trends in some EU Member States. After the ‘panic-buying’ rush that char- acterised the first weeks of the pandemic, the demand for meat declined and remained sluggish through most of 2020.
The closure of the HORECA sector, the erosion of consumer
spending by 2.5% and the overall increase in food prices by 7.4% contributed to this.
National data on meat production and trade reflects the drop in domestic consumption. In 2020, total slaughter of cat- tle, sheep, pigs, and poultry, expressed in slaughter weight, decreased by 1%. In addition, imports of beef and pork declined by 6% and 22%, respectively, compared to 2019, respectively. The trade balance showed a slight improvement for beef and turned positive for pork. At the same time, poul- try meat imports stagnated, while exports shrunk by 10%
compared to 2019, which is explained, in part, by the avian influenza outbreaks in the country. The pressure on producer prices as well as increasing feed costs have forced many poultry farmers to suspend the placing of day-old chicks and to liquidate breeding flocks which resulted in a shortage of poultry for slaughter in early 2021.
If we look further ahead, meat consumption is expected to lag increasingly behind the pre-COVID scenario in the coming years from around 4% to 6% in the pessimistic sce- nario (Figure 7). Even in the optimistic scenario, this gap is unlikely to close before 2025. However, slack domestic demand for meat is expected to be overcompensated by growing exports, especially for poultry meat, driven by rising international prices and a weak domestic currency. Improv- ing international competitiveness might help total Hungarian
meat production to overshoot the pre-COVID case slightly in all scenarios. As for dairy, the rising SSR values are also explained by contracting domestic demand.
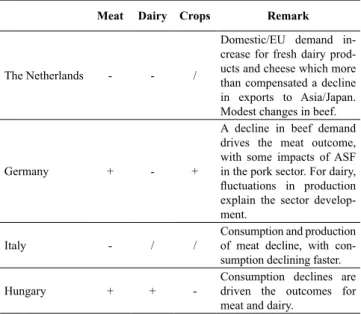
The modelling results for the ‘COVID-19’ scenarios for meat, dairy and crops at the country level are summarised in Table 2.
Conclusions
The country level analysis confirms that the EU’s agri- culture sector has been quite resilient during the pandemic, and it is expected to remain so, even though the food sec- tor in the Member States was affected in different ways. The impacts of GDP shocks on the agri-food sector are limited, but changes in consumer behaviour could lead to longer last- ing impacts on specific sectors (e.g. meat production). Trade flows contributed to buffering domestic market disruptions but induced some strong price changes in local as well as
Pre-COVID Baseline Optimistic Pessimisitic
Meat Dairy Crops
95 100 105 110 115 120 125 130 135
120 125 130 135 140 145 150
142 144 146 148 150 152 154
2019 2020 2021 2022 2023 2024 2025 2019 2020 2021 2022 2023 2024 2025 2019 2020 2021 2022 2023 2024 2025
Figure 7: Self-sufficiency rate (%): Hungary.
Source: Own compilation based on AGMEMOD simulations
Table 2: Overview of country results.
Meat Dairy Crops Remark
The Netherlands - - /
Domestic/EU demand in- crease for fresh dairy prod- ucts and cheese which more than compensated a decline in exports to Asia/Japan.
Modest changes in beef.
Germany + - +
A decline in beef demand drives the meat outcome, with some impacts of ASF in the pork sector. For dairy, fluctuations in production explain the sector develop- ment.
Italy - / / Consumption and production
of meat decline, with con- sumption declining faster.
Hungary + + - Consumption declines are
driven the outcomes for meat and dairy.
Note: +(-) indicates an increase (decline) in SSR in the case of the ‘COVID-19’
scenarios compared to the pre-pandemic case / indicates that SSR remains stable.
Source: Own composition
References
International Monetary Fund (2020): World Economic Outlook, April 2020: The Great Lockdown. 2020. Retrieved from:
https://www.imf.org/en/Publications/WEO/Issues/2020/04/14/
World-Economic-Outlook-April-2020-The-Great-Lock- down-49306 (Accessed in 2 September 2021)
McKinsey (2020): Safeguarding Europe’s livelihoods: Mitigating the employment impact of COVID-19, April 19. Retrieved from: https://www.mckinsey.com/industries/public-and-social- sector/our-insights/safeguarding-europes-livelihoods-miti- gating-the-employment-impact-of-covid-19 (Accessed in 10 August 2021)
OECD (2020a): Turning hope into reality, OECD Economic Out- look. Paris, 1 December. Retrieved from: https://www.oecd- ilibrary.org/sites/39a88ab1-en/index.html?itemId=/content/
publication/39a88ab1-en (Accessed in 5 August 2021) OECD (2020b): Food Supply Chains and COVID-19: Impacts and
Policy Lessons. Paris, 2 June. Retrieved from: https://read.oecd- ilibrary.org/view/?ref=134_134305-ybqvdf0kg9&title=Food- Supply-Chains-and-COVID-19-Impacts-and-policy-lessons (Accessed in 5 September 2021)
OECD (2020c): The Impact of Covid-19 on Agricultural Markets and GHG Emissions. Paris, 25 November. Retrieved from:
http://www.oecd.org/coronavirus/en/ (Accessed in 3 July 2021) The World Bank (2021): Global Economic Prospects - World Bank
Group. January 2021. Retrieved from: https://www.worldbank.
org/en/publication/global-economic-prospects (Accessed in 1 July 2021)
WTO (2020): COVID-19 and agriculture: a story of resilience.
Retrieved from: https://www.wto.org/english/tratop_e/covid19 _e/agric_report_e.pdf (Accessed in 4 June 2021)
world markets (e.g. the ornamental and potato sectors). On the supply side, price developments had a considerably larger impact compared to the effects related to implemen- tation of lockdown measures. The partial closure of food services has imposed a variety of challenges for producers and food processors who had to react quickly to supply the
‘private’ kitchens of consumers who became increasingly concerned about adopting new dietary patterns. The impact of the income shock seems to have been limited due to the low-income elasticity of food products, as well as policy support measures implemented to mitigate the destruction of jobs and the overall economic collapse.