Introduction
Agricultural production is not distributed evenly world- wide, hence there is a need to conduct trade between regions with surpluses and those characterised by deficits. The trans- fer of demand and supply shocks among regions, which facilitates balancing surpluses with shortages, is called the spatial integration of markets (Fackler and Goodwin, 2001).
Spatial market integration is a pre-condition for the efficient allocation of production factors and the maximisation of economic welfare. Without spatial market integration, no signals would be transmitted between the surplus and deficit regions, prices would be more volatile, specialisation would not take place according to the comparative advantage the- ory, while no potential benefits of trade would be gained.
The integration with external markets is also an opportunity for increased production and consumption, without a need to influence prices in the local market (Donaldson, 2015).
Increased spatial market integration is evidenced by the intensification of trade, a reduction in trade costs and an increase in price co-movement (Barrett and Li, 2002). In this context, the COVID-19 pandemic together with the accom- panying supply and demand shocks may be considered as an important factor affecting the degree of spatial market integration.
The COVID-19 pandemic has had a significant impact on all spheres of human activity. Its course and socio-economic effects are the subject of daily news reports as well as sci- ence and policy debates. Several facts can be mentioned to illustrate the socio-economic consequences of the pandemic.
According to IMF (2021), the global economy contracted by 3.5% in 2020, more than during the global financial crisis in 2009, when GDP fell by 0.1% year-on-year. Weak final demand from consumers and firms led to a 10% decrease in global trade. The unemployment rate in advanced economies,
which had been gradually declining since 2012 and reached 4.8% in 2019, rose to 7.3% in 2020. Economic contraction and elevated fiscal support resulted in the global public debt approaching 98% of GDP compared to 83.5% in 2019.
The agri-food sector has not been immune to the impacts of the pandemic. There are many reports and papers that ana- lyse the sectoral effects of the crisis (e.g. Aday and Aday, 2020; Nakat and Bou-Mitri, 2021; OECD, 2020). The pri- mary source of observed changes was associated with the reduced demand in the food service sector and its shift to retail. Supply chain disruptions, such as labour shortages, plant closures and logistical constraints played rather limited and temporary roles. However, the situations vary across food commodities and countries. Lack of seasonal workers impacted fruit harvest, whereas demand and supply market disruptions led to a decrease in world meat production (FAO, 2020).
Despite the visible impact of COVID-19 on the volume of agri-food commodity production, trade, and employment in the sector, its effects on agri-food commodity prices are rarely addressed. In fact, there are only a few studies that aim to identify price implications of the crisis. This is due to the unavailability of data, national and market specificities, or the strength with which COVID-19 affected individual coun- tries. Most of the studies have so far focused on retail prices, covering the first phase of the pandemic, which was char- acterised by panic purchases of food, especially long shelf life products. Research by Akter (2020) for the European market, Imai et al. (2020) for India and Yu et al. (2020) for China showed a positive relationship between the severity of the pandemic and/or the strength of imposed restrictions and changes in retail prices. In addition, Imai et al. (2020) pointed to an increase in the price gap between retail and wholesale prices in one of the Indian states most affected by the pandemic. On the other hand, Varshney et al. (2020) Mariusz HAMULCZUK* and Marta SKRZYPCZYK*
COVID-19, spatial market integration and producer prices: A case study of EU agri-food markets
The spread of COVID-19 has had a significant impact on economic and social activities, with the agri-food sector being no exception. Since the COVID-19 outbreak, numerous studies investigating its sectoral influence have been carried out, putting emphasis on demand and supply shocks and changes in trade volumes. However, there has not been much research into the implications of the pandemic for prices. To fill the research gap, this paper is an attempt to examine the impact of COVID-19 on producer prices in the EU-27 in Q2 and Q3 of 2020. The study is based on monthly data on trade in agri-food commodities according to the SITC classification in 2015-2020 and the monthly producer prices index of food (2015 = 100) in the EU coun- tries. It was assumed that the agri-food trade balance is the key factor determining the level and changes of domestic prices.
The theoretical background for empirical research is provided by a spatial partial equilibrium model and the concept of spatial market integration. The results of the study reveal that there is a negative and statistically significant relationship between an export-import ratio (which illustrates the country’s self-sufficiency level) in the pre-COVID-19 period and price changes in Q2 of 2020 as well as Q3 of 2020. However, no statistically significant results were obtained for the regression models explaining the relationship between changes in the export/import ratio and price changes in second and third quarters of 2020.
Keywords: COVID-19, agri-food prices, international trade, market integration, European Union JEL classifications: Q02; Q11, Q13; Q17
* Warsaw University of Life Sciences – SGGW, Nowoursynowska Str 166, 02-787 Warsaw, Poland. Corresponding author: mariusz_hamulczuk@sggw.edu.pl Received: 16 March 2021, Revised: 20 May 2021, Accepted: 24 May 2021.
in a study of wholesale prices and Hillen (2020) in a study of online prices for food found no relationship between the magnitude of price changes and the nature of the product (non-perishable vs. perishable, most demanded compared with less demanded).
The purpose of this paper is to determine the impact of COVID-19 on producer prices for agri-food products in the EU in Q2 and Q3 of 2020. The study assumes that under the conditions of an open economy, the key determinant of the level and changes in domestic prices is the trade balance of agri-food commodities. It reflects all demand and supply factors domestically and abroad, including the disruption of global supply chains. Since the trade balance depends, among other things, on the size of the country, for the econometric calculations the export to import ratio is used in this paper.
To the best of our knowledge, no one has so far addressed the issue of agri-food price changes in this respect.
Literature review
This section presents a brief discussion of the recent liter- ature analysing the impact of the COVID-19 pandemic on the whole food chain with particular emphasis on prices. The vast majority of the papers have focused on demand and supply shocks, which were the result of the spread of the Sars-Cov-2 virus and restrictions imposed both on economic activity and human mobility. In the first phase of the pandemic, changes on the demand side were particularly evident. As empha- sised in the literature, purchases of long shelf life products such as flour, pasta, dried, canned or frozen foods increased significantly, which often led to shortages. Moreover, the closure of restaurants, bars and hotels translated into a shift from out‐of‐home to at‐home food consumption and thus in a demand shift from food service to retail (Aday and Aday, 2020; Dong and Zeballos, 2021; Weersink et al., 2021). As a result, retail sales of food and beverages grew markedly. For example, in the EU-27 in March 2020, it was 4.8% higher than in February 2020 (Eurostat, 2021). In addition, due to the lockdown measures and as an attempt to decrease per- sonal physical interactions, online sales have soared (Hillen, 2020). For the most part, the above surge in demand seems to be a short-term problem (in April 2020, retail sale of food and beverages in the EU-27 declined by 6.0% m/m - Euro- stat, 2021). Long-term demand-driven effects on food supply chains will come rather from declining consumer incomes as well as shifts in product categories (Hobbs, 2020).
Supply-side disruptions being a result of COVID-19 included labour shortages, temporary plant closures and logistical constraints (Aday and Aday, 2020; Varshney et al., 2020). Given the nature of the restrictions put in place, labour-intensive food processing plants were particularly vulnerable to production downtime (Hobbs, 2020). Further- more, as emphasised by Weersink et al. (2020), factories, often specialised and operating on production schedules based on well-known customer requirements, needed time to adapt their production lines to the sudden shift in the vol- ume and form of food demanded. Adapting to these changes was an even greater challenge for agriculture, which, due to its biological nature, is less flexible, especially in the case
of highly perishable products. Thus, there were incidents of some commodities being disposed of while systems adjusted.
However, most authors conclude that the food sector has proven to be relatively resilient to supply shocks caused by the COVID-19 pandemic. Cranfield (2020) claimed that in the long run, demand‐side rather than supply-side factors will determine most of the changes in food markets.
Supply and demand shock impacted not only local mar- kets, but also aggregate trade flows (Baldwin, 2020). The above changes together with additional border controls, sanitary measures (such as temperature checks), the lim- ited availability of drivers as well as workers at ports and import/export inspectors (particularly in the first phase of the pandemic) disrupted the flow of goods, including food and agricultural commodities (OECD, 2020; WTO, 2020). At the same time, trade protocols were changed, with additional documentation and quarantine measures being introduced.
Moreover, some governments imposed export restrictions to ensure the uninterrupted supply of a number of products in the domestic market. The above (especially in the short term) was reflected in the availability and prices of agricultural and food commodities. For instance, due to global trade distur- bances, farmers were facing a shortage of agricultural inputs such as seeds, fertilisers and pesticides (Poudel et al., 2020).
Export restrictions increased world prices of cereals such as wheat, maize and rice (Aday and Aday, 2020), whereas transport and logistics problems were most pronounced for perishable high-value products, such as fruits and vegetables (OECD, 2020). The above has primarily a bearing on the situation in countries with shortages of domestic food supply (Yu et al., 2020).
Although trade in agriculture and food products rela- tively quickly returned to near-normal operations (OECD, 2020), long-term repercussions could be significant. Anti- globalisation movements are expected to intensify and some governments may wish to increase self-sufficiency to reduce dependence on other countries. On the other hand, there may be a desire to strengthen international cooperation to aid in keeping supply chains operating in times of crisis (Kerr, 2020).
The changes described above were reflected, to a greater or lesser extent, in food and agricultural products prices.
In the short-term, the combined effect of supply disruption and demand surge led to retail food price inflation (Akter, 2020). However, the impact of COVID-19 on food prices is ambiguous. After an initial period of panic buying, with food stocks built up and restrictions placed on the hospital- ity industry (often referred to as HoReCa sector), demand for food has eased. The long-term situation will depend on income effects. A prolonged pandemic and the resulting recession will translate into lower incomes, which in turn may reduce food consumption (OECD, 2020). If the demand drops more than the supply, the market prices will fall, and conversely a stronger decrease in supply will translate into higher prices (Yu et al., 2020).
The vast majority of studies dedicated to the issue of price changes have focused on retail prices having regard to the three aspects of the pandemic’s impact on the agri-food sector: (1) the severity of the pandemic and/or the strength of imposed restrictions; (2) the different nature of food products
(staple vs. more nutritious; perishable vs. non-perishable) and (3) time effects. The studies mainly concerned the first phase of the pandemic, i.e. March – June 2020.
Akter (2020) assessed the impact of COVID-19 related
‘stay-at-home’ restrictions on food prices in 31 European countries (25 EU countries and the United Kingdom, Nor- way, Iceland, Switzerland, Serbia and Turkey) using a difference-in-difference regression. She combined the Har- monised Index of Consumer Prices (HICP) for January-May 2020 with the Stay-at-Home Restriction Index from the Oxford Covid-19 Government Response Tracker dataset.
Research findings reveal that relatively stringent restrictions had a positive impact on retail food prices – they translated into an almost 1% increase in overall food prices in March 2020, compared to January and February 2020. The food categories that showed the most significant surges in prices included meat, fish and seafood, and vegetables. However, prices of bread and cereals, fruits, milk, cheese and eggs, or oils and fats were not significantly affected.
The correlation between the severity of the pandemic and price changes has been confirmed in a study by Imai et al.
(2020). Those authors examined in detail the wholesale and retail prices of selected food commodities in three states in India, using static and dynamic panel models, i.e. the Haus- man-Taylor panel model with fixed or random effects and a dynamic panel SGMM model, which allows to establish cau- sality between the severity of the COVID-19 pandemic and prices. The state-level weekly data from March to June 2020 on commodity prices as well as the weekly panel data of the COVID-19 cumulative severity ratio were used. The conclu- sion was that in the states most affected by the pandemic retail prices of commodities as well as the gap between retail and wholesale prices increased significantly, which was not necessarily seen in the other states.
In turn, Yu et al. (2020) examined the Chinese market.
Daily price series for four major food products (rice, wheat flour, pork and Chinese cabbage) were collected from three provinces of China for the period from January 1, 2020 to April 8, 2020 (and 2019 as a comparison) and an iGARCH model was applied. Research findings reveal no significant changes in prices of staple foods, such as rice and wheat flour, a slight increase in prices of vegetables proxied by the Chinese cabbage, and various changes in prices of pork. In the Hubei Province, the epicenter of COVID-19, the out- break of the COVID-19 pandemic resulted in an increase in pork prices, which according to those authors may have been an effect of both consumer panic and the lockdown policy.
However, in Beijing pork prices dropped slightly after the COVID-19 outbreak probably due to reduced demand.
Another issue addressed in the studies was whether the price implication of a pandemic depends on the nature of the product and the time of analysis. Varshney et al. (2020) com- pared wholesale prices and quantities traded of non-perisha- ble (wheat) and perishable commodities (tomato and onion).
A dataset comprising daily observations for April–June 2020, relative to the same period in 2019, from nearly 1000 mar- kets across five states of India was used and a double- and triple-difference estimation strategy was adopted. The study revealed that the immediate (within a month) effect differs from the short-term (over 3 months) effect. While all prices
spiked initially in April, they recovered relatively quickly and in the case of wheat in May-June 2020 they were signifi- cantly lower compared to 2019. Nevertheless, regardless of the nature of the product (perishable vs. non-perishable), the impact of the pandemic on price changes was not statistically significant. On the other hand, its influence on quantities traded of all surveyed products was positive and significant, especially for the two perishable goods.
An interesting study in the context of price changes is the analysis of prices of food products sold online (Hillen, 2020). The data consisted of daily price quotes collected from the Amazon Fresh website for the customer location Los Angeles from December 2, 2019 to June 18, 2020. The main conclusion was that despite rising food price indices in the USA and a strong demand surge, Amazon Fresh’s online price level did not increase during the COVID‐19 pan- demic. In addition, no difference was found in the price set- ting of storable goods compared with perishable, or highly demanded compared with less demanded products.
Methodology
The theoretical background for empirical research adopted in this study is a spatial partial equilibrium model (Figure 1). Under the assumption of an open economy, the difference between the prices of homogeneous goods in two countries (A and B) equals the trade costs τAB. Trade costs include transportation, insurance, information search, or costs of breaking down the trade barriers. Therefore, trade flow is equal to Q1 = X1 = M1, where X – export, M – import.
In other words, spatial market equilibrium is reached when excessive export supply in country A (XSA) equals excessive import demand in country B (MDB) corrected by the impact of trade cost τAB (Barrett and Li, 2002; Baulch 1997).
Demand and supply shocks, in one or both countries, lead to the new market equilibrium. Moreover, any disrup- tions of trade due to increase of tariff or non-tariff barriers in the short run cause an increase in price differences as well as a reduction in trade volume. COVID-19 could lead to sup- ply and demand shocks as well as to trade constrains. The logistic limitations arising from COVID-19 leading to trade reduction are in essence similar to those of non-tariff barriers such as import or export quotas. They do not totally prohibit the trade as would be the case with trade bans but instead limit it, which may also have price implications.
Referring to Figure 1, let us assume that as a result of COVID-19 trade between these countries has decreased to the Q2 level. This manifests in a decrease in exports from country A to the X2 level and a decrease in imports from country B to the M2 level. The aforementioned changes should result in lower prices in the country with surpluses and higher prices in the country with shortages. Therefore, it can be concluded that the restrictions related to COVID-19 should lead to the weakening of spatial integration of agri- food commodity markets. Of course, this degree will depend e.g. on the type of goods and their storability, or on the elas- ticity of domestic demand and supply.
In order to verify this mechanism in the context of COVID-19, monthly data on trade in agri-food commodities
(total, intra and extra, export and import values expressed in euro) according to the SITC classification in 2015-2020 were used. Changes in the international trade itself are an indication of strengthening or weakening of the spatial mar- ket integration. The export position of a country and its com- petitiveness is demonstrated by its trade balance known as net export (Latruffe, 2010). In an open economy, net export takes into account both domestic and foreign factors affect- ing supply and demand, and consequently prices. A variable that reflects changes in the trade balance, and it is at the same time commonly used in econometric calculations, is the ratio of the export Xij to the import Mij:
, (1) where X – export, M – import, i – analysed country, j – analysed commodity. At the same time, the above- mentioned ratio roughly illustrates a countries’ level of self- sufficiency.
The second variable used was the monthly producer prices index of food (2015 = 100) in the EU countries. This variable seems to be more reliable in international compari- sons than agricultural prices as it reflects the situation on the broader commodity market. Retail prices, on the other hand, were found to be more susceptible to local short- term demand shocks, i.e., panic buying (Imai et al. (2020) point to the growth of the gap between retail and wholesale prices) and on the pricing policy of the retailer (Hillen, 2020). Thus, producer prices appear to better reflect the potential changes in spatial integration of agri-food com- modity markets.
The source of this information was Eurostat’s food price monitoring tool (2021) which uses data collected by Eurostat and National Statistical Offices and comprises agricultural and food price indices and annual rates of price change for EU countries. In total, price time series in 21 EU coun- tries were used. Due to the lack of statistical data for such countries as Malta, Luxemburg, Estonia, Latvia, Slovakia and Cyprus they were not included in the study. A certain
limitation of the study stems from the fact that these indices express prices in national currencies.
During the research design, we also considered tak- ing into account smaller aggregates (e.g. markets of meat, vegetables, milk). However, we faced another limitation in view of the insufficient availability of price information in the Eurostat database. In such cases, the number of units (countries) would be much smaller than in the case of food aggregates. Smaller geographical regions (e.g. NUTS 2) also do not fit the proposed methodology related to the spatial market integration due to a complete lack of trade data that reflects the self-sufficiency of regions.
Another difficulty when analysing small aggregates is to separate the impact of COVID-19 from specific factors shap- ing the situation on a given market (e.g. weather conditions, inventory levels, changes in yields, etc.). So the remaining factors are assumed as ceteris paribus.
Due to the potential impact of seasonality on trade and prices, these variables were deseasonalised using the X-12 ARIMA procedure (X-12-ARIMA, 2011). If the seasonality was non-significant, then the original data was used.
In the study, simple descriptive indicators and lin- ear regression models based on cross-sectional data were used. In regression models, price changes ∆P in countries (i = 1, … , N) between period t0 and t0 + T were explained using export to import ratio NEX in initial period t0. Two forms of equations were employed1:
, (2) , (3)
1 We also estimated regression models based on the following equation:
. In that case, in line with spatial equi- librium, the expected sign of β_1 was positive. However, obtained results indicated a non-significant relationship between changes in trade balance and price changes in the COVID-19 pandemic period.
Region A Trade Region B
P P P
P1A
P0B P2B P1B
P2A P0A
X1 X2
SA
Q Q Q
DA
MDB XSA
τAB M1
M2 SB DB
Q2 Q1 Figure 1: Partial spatial equilibrium model.
Source: own composition based on Samuelson (1952)
Here, (initial) period t0 representing the pre-COVID-19 era was the first quarter of 2020 or the year 2019, whereas t0 + Treflected period covered by COVID-19 (2nd and 3rd quarter of 2020 or particular month IV-IX of 2020). Models 2 and 3 were estimated using OLS method. Standard errors of estimation were calculated by using OLS estimator as well as White estimator, often referred to as heteroscedastic- ity-consistent estimator. The second case standard errors are robust in the presence of possible heteroscedasticity.
It was expected that the occurrence of substantial trade constraints due to COVID-19 would result in the estimated regression coefficient β1 being negative and statistically signif- icant. Therefore, the anticipated reaction of surplus countries is a fall in prices, while that of countries with shortages is an increase in prices of agri-food products. To sum up, under the conditions of supply-demand shocks accompanied by signifi- cant trade constraints stemming from COVID-19, the coun- tries and regions with surpluses or shortages are more exposed to price changes than countries with balanced trade.
Results
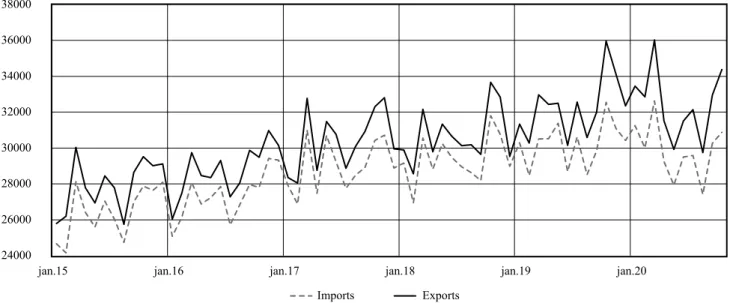
From the theoretical point of view and the literature review, international trade is one of the main channels through which COVID-19 may affect prices of agri-food products. It is commonly believed that COVID-19 has led to disturbances in global supply chains (e.g. Aday and Aday, 2020; Baldwin, 2020; OECD 2020), which is reflected in the decline in trade of agri-food products. Figure 2 shows the value of exports and imports of agri-food products in the analysed 21 EU countries. There are relatively deep declines in both cases in Q2 and Q3 of 2020, which can be mainly attributed to COVID-19 restrictions.
It is worth noting that on the year-to-year basis, the shrinkages in the value of exports and imports of agri-food products in the 2nd and 3rd quarter of 2020 were small due to the upward tendencies of these variables. For example, the decline in exports and imports in the second quarter of 2020
compared to the second quarter of 2019 was 4.3 and 2.2%, respectively.
A much stronger deterioration of international trade can be observed when comparing its value in the 2nd and 3rd quarter of 2020 to trade value in the 1st quarter of 2020.
The export of agri-food products in Q2 of 2020 decreased by 9.1%, and in Q3 of 2020 – by 7.3%. In turn, imports in the 2nd and 3rd quarters of 2020 were lower by 7.7% and 7.0%, respectively. These results may be disturbed by the seasonality in exports and imports. Calculations performed on seasonally adjusted data show that exports in Q2 and Q3 of 2020, compared to their values in Q1 of 2020, were lower by 9.3% and 6.2%, while imports fell by 2.8% and 2.5%, respectively. Interestingly, the volume of industrial produc- tion of agri-food products in the EU-27 in the 2nd and 3rd quarter of 2020 decreased by 6.9% and 2.1%, respectively (seasonally adjusted data). Presented results are the evidence of a deterioration in spatial integration of agri-food markets in the EU countries in the first phase of the COVID-19 pan- demic.
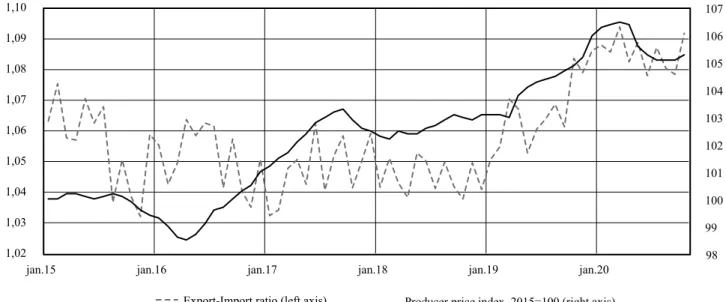
Despite the deterioration of the trade balance in agri-food products in the EU countries in the second and third quar- ters of 2020, the export-import ratio was still high. It can be noticed that producer prices in the EU-27 also decreased during this period (Figure 3). The agri-food producer prices in Q2 of 2020 fell by 0.6% and in Q3 of 2020 by 1.3%, com- pared to the Q1 2020 price level. It seems that this can be largely attributed to the COVID-19 effect, as the decrease in the X/M ratio illustrates the possible appearance of surpluses in the EU market, while the price mechanism enables the demand to be balanced with supply.
However, the estimates made for aggregated data do not reflect potential changes in individual countries or sectors.
As a result of COVID-19 constraints, agri-food prices could both rise and fall depending on the initial net export posi- tion of the country. Thereby, it can be expected that prices in countries (or markets) with export surpluses should decline, whereas prices in countries with shortages should raise.
The graphs in Figure 4 essentially confirm this thesis (see
24000 26000 28000 30000 32000 34000 36000 38000
jan.15 jan.16 jan.17 jan.18 jan.19 jan.20
Imports Exports
Figure 2: Value of exports and imports of agri-food commodities from January 2015 to October 2020 in analysed EU countries (billion euro).
Source: own composition based on the Eurostat database
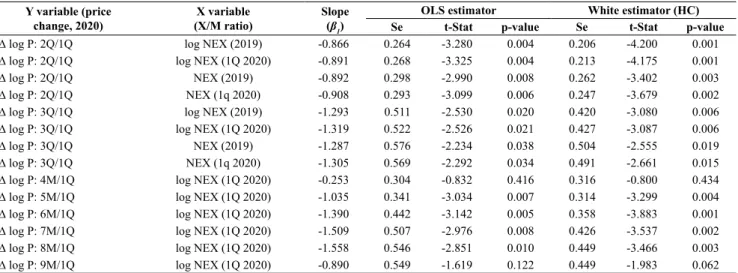
tistically significant for both OLS estimator as well as a heteroscedasticity-consistent estimator (for HC estimator even lower standard errors were obtained than for OLS estimator). It can be seen that the absolute magnitudes of β1 coefficients in regression models estimated for Q3/Q1 2020 price changes are higher than for Q2/Q1 2020 price changes. This implies a stronger impact of the country’s initial self-sufficiency level on prices in the 3rd rather than the 2nd quarter of 2020. Although the magnitudes β1 were greater for regressions models where the dependent vari- eq. 2 and 3). There is a negative and statistically significant
(p = 0.05) relationship between the level of the export-import ratio or its log in the 1st quarter of 2020 and price changes in the 2nd and 3rd quarter of 2020. It is worth adding that simi- lar conclusions were obtained when the export-import ratio for the year 2019 was assumed as the independent variable (Table 1).
Table 1 provides more detailed estimates of these relationships (only the slope β1 of the regression coeffi- cient and its statistics are presented). The results are sta-
98 99 100 101 102 103 104 105 106 107
1,02 1,03 1,04 1,05 1,06 1,07 1,08 1,09 1,10
jan.15 jan.16 jan.17 jan.18 jan.19 jan.20
Export-Import ratio (left axis) Producer price index, 2015=100 (right axis)
Figure 3: The export-import ratio for agri-food commodities in analysed 21 EU countries and the index of producer prices in the EU-27 (seasonally adjusted data).
Source: own composition based on the Eurostat database
y = -0,91x + 0,75 R² = 0,34
-1,5 -1 -0,5 0 0,5 1
0,2 0,6 1 1,4 1,8
log of price change Q2/Q1 2020
X/M Q1 2020
y = -0,89x - 0,23 R² = 0,37
-1,5 -1 -0,5
0 0,5
1
-1 -0,6 -0,2 0,2 0,6
log of price change Q2/Q1 2020
log X/M Q1 2020 y = -1,31x + 0,66
R² = 0,22
-3 -2,5 -2 -1,5 -1 -0,5 0 0,5 1 1,5 2
0,2 0,6 1 1,4 1,8
log of price change Q3/Q1 2020
X/M Q1 2020
y = -1,32x - 0,75 R² = 0,25
-3 -2,5
-2 -1,5
-1 -0,5
0 0,5
1 1,5
2
-1 -0,6 -0,2 0,2 0,6
log of price change Q3/Q1 2020
log X/M Q1 2020
Figure 4: The relationship between changes in producer prices of agri-food commodities and the export-import ratio in 21 EU countries (based on seasonally adjusted data).
Source: own composition based on the Eurostat database
able was the price change between Q3 and Q1 of 2020 than for models where it was the price change between Q2 and Q1 of 2020, the first relationship was slightly less statisti- cally significant (see: t-Stat, p-value, R2). This may indi- cate that in the long-run other factors (e.g. exchange rates, domestic demand, etc.) play an increasingly greater role in determining domestic prices.
Table 1 also presents β1 estimates for models, where the dependent variables were price changes between specific months (M4-M9) and the first quarter of 2020, whereas the independent variable was a log2 of the export-import ratio
2 Conclusions drawn from regression models, where the independent variable was the level of the export-import ratio were essentially the same.
in Q1 of 2020. The estimated β1 coefficients and Student’s t-statistics indicate that in April 2020 there were no statisti- cally significant price effects of the COVID-19 pandemic.
This can be justified by a speculative increase in demand for food products in the first months of the pandemic (Akter, 2020). It was only from May 2020 until August 2020 that the relationship between price changes and the export position was negative and significant. It can also be noticed that the impact of the initial export-import ratio on the price change between September 2020 and the 1st quarter of 2020 weak- ened again.
Bearing in mind that the used price information is in the form of indices based on prices expressed in national cur- Table 1: Slope estimates for regression models for 21 countries.
Y variable (price
change, 2020) X variable
(X/M ratio) Slope
(β1) OLS estimator White estimator (HC)
Se t-Stat p-value Se t-Stat p-value
∆ log P: 2Q/1Q log NEX (2019) -0.866 0.264 -3.280 0.004 0.206 -4.200 0.001
∆ log P: 2Q/1Q log NEX (1Q 2020) -0.891 0.268 -3.325 0.004 0.213 -4.175 0.001
∆ log P: 2Q/1Q NEX (2019) -0.892 0.298 -2.990 0.008 0.262 -3.402 0.003
∆ log P: 2Q/1Q NEX (1q 2020) -0.908 0.293 -3.099 0.006 0.247 -3.679 0.002
∆ log P: 3Q/1Q log NEX (2019) -1.293 0.511 -2.530 0.020 0.420 -3.080 0.006
∆ log P: 3Q/1Q log NEX (1Q 2020) -1.319 0.522 -2.526 0.021 0.427 -3.087 0.006
∆ log P: 3Q/1Q NEX (2019) -1.287 0.576 -2.234 0.038 0.504 -2.555 0.019
∆ log P: 3Q/1Q NEX (1q 2020) -1.305 0.569 -2.292 0.034 0.491 -2.661 0.015
∆ log P: 4M/1Q log NEX (1Q 2020) -0.253 0.304 -0.832 0.416 0.316 -0.800 0.434
∆ log P: 5M/1Q log NEX (1Q 2020) -1.035 0.341 -3.034 0.007 0.314 -3.299 0.004
∆ log P: 6M/1Q log NEX (1Q 2020) -1.390 0.442 -3.142 0.005 0.358 -3.883 0.001
∆ log P: 7M/1Q log NEX (1Q 2020) -1.509 0.507 -2.976 0.008 0.426 -3.537 0.002
∆ log P: 8M/1Q log NEX (1Q 2020) -1.558 0.546 -2.851 0.010 0.449 -3.466 0.003
∆ log P: 9M/1Q log NEX (1Q 2020) -0.890 0.549 -1.619 0.122 0.449 -1.983 0.062
Source: own calculations based on the Eurostat database
y = -1,12x + 0,81 R² = 0,46
-1,5 -1 -0,5 0 0,5 1
0,2 0,6 1 1,4 1,8
log of price change Q2/Q1 2020
X/M Q1 2020
y = -1,03x - 0,38 R² = 0,50
-1,5 -1 -0,5
0 0,5
1
-1 -0,6 -0,2 0,2 0,6
log of price change Q2/Q1 2020
log X/M Q1 2020 y = -1,42x + 0,67
R² = 0,23
-3 -2,5 -2 -1,5 -1 -0,5 0 0,5 1 1,5
0,2 0,6 1 1,4 1,8
log of price change Q3/Q1 2020
X/M Q1 2020
y = -1,37x - 0,85 R² = 0,28
-3 -2,5
-2 -1,5
-1 -0,5
0 0,5
1 1,5
-1 -0,6 -0,2 0,2 0,6
log of price change Q3/Q1 2020
log X/M Q1 2020
Figure 5: The relationship between changes in producer prices of agri-food commodities and the export-import ratio in 13 EU euro area countries (based on seasonally adjusted data).
Source: own composition based on the Eurostat database
rencies, fluctuations both in exchange rates and in the gen- eral level of countries’ inflation may play a significant role.
Hence, analyses for the euro area countries as a relatively homogeneous group might be more reliable. The estimated regression equations for 13 euro area countries are included in Figure 5. Comparing Figures 5 and 4 it can be seen that the correlations between price changes in Q2/Q1 of 2020 and the level of the trade balance in Q1 of 2020 for the euro area countries are stronger than in the group of 21 EU countries (see slope and R2). However, we cannot see any differences for the regression models (21 countries vs 13 countries) explaining the price movements between Q3 and Q1 of 2020. Although in this case there are only 13 countries, the results also show a statistically significant impact of the level of food self-sufficiency of the euro area countries on changes in food prices in the first two quarters of the pandemic (p = 0.05 for HC and p=0.10 for OLS estimator).
It is worth emphasizing that we have also studied the rela- tionships between price changes and trade balance changes in the 2nd and 3rd quarters of 2020. Obtained results for the 21 and 13 countries indicated on positive, but not statistically significant (p-values over 0.1), relationship in 2nd quarter of 2020 between analysed variables (as it had been expected).
For the third quarter correlations were close to zero. This may be due to the fact that changes in the trade balance are much more volatile than the level of the trade balance itself.
Such results also mean that it was the threat of surplus stocks in countries with surpluses and the threat of food shortages in countries with low self-sufficiency that was significant driving force behind price changes in the first months of the COVID-19 pandemic.
Conclusions
The aim of the research was to determine the importance of the trade balance for changes in agri-food producer prices in the EU countries in the first two quarters covered by the COVID-19 pandemic. Overall, in the whole EU in the 2nd and 3rd quarters of 2020 agri-food exports as well as imports significantly decreased. This implies a deterioration of spa- tial integration of the UE agri-food markets (both intra- and extra-EU). Therefore, the economic consequence of the COVID-19 pandemic, in line with the spatial integration concept, is the reduction of economic welfare. Due to the fact that in this period exports in the EU decreased more than imports, the trade balance also deteriorated. This resulted in a decline in agri-food producer prices in the EU.
Research conducted on a group of 21 countries belonging to the EU and on a group of 13 countries belonging to the euro area confirmed the significant impact of the countries’
level of self-sufficiency on changes in agri-food prices in the second and third quarter of 2020. The negative relationships between the countries’ export-import ratio and price trends during the COVID-19 pandemic indicate that agri-food prices in the surplus countries fell and in the countries with food shortages increased due to the COVID-19 pandemic, ceteris paribus. Therefore, one of the key driving forces determining agri-food prices in the EU in the 2nd and 3rd quarter of 2020 was related to the exposure to food shortages
and surpluses. We are not of the opinion that the level of self-sufficiency is the only factor determining the behaviour of food prices during the COVID-19 pandemic; neverthe- less, it is one of the most important, next to the severity of the imposed restriction as indicated in the literature. Tak- ing it into account allows for a better understanding of the impacts of the pandemic on the agri-food sector and explain- ing different directions in price movements across countries referred to in literature and statistics.
Our study has also some limitations related to the data and methodology used. One of them is the fact that agri- food prices have been expressed in national currencies, so their changes may also be caused by other factors (e.g.
exchange rate changes). Moreover, small sample and the lack of control variables slightly limit the power of infer- ence. In order to increase the power of inference, one can consider applying panel models using high-frequency data (for example monthly, weekly, or even daily). However, in this case probably we should look for structural changes due to COVID-19 and/or include other variables explaining pandemic severity and other characteristics of the investi- gated countries or commodity markets. In future research, it seems advisable to carry out analyses involving smaller aggregates or specific markets, however, there might be a problem of collection of comparable data for a large num- ber of the EU countries.
References
Aday, S. and Aday, M. S. (2020): Impact of COVID-19 on the food supply chain. Food Quality and Safety, 4 (4), 167–180.
https://doi.org/10.1093/fqsafe/fyaa024
Akter, S. (2020): The impact of COVID-19 related ‘stay- at-home’ restrictions on food prices in Europe: findings from a preliminary analysis. Food Security, 12, 719–725.
https://doi.org/10.1007/s12571-020-01082-3
Baldwin, R. and Tomiura E. (2020): Thinking ahead about the trade impact of COVID-19. IN Baldwin and di Mauro (eds.). Eco- nomics in the Time of COVID-19, 59–71. Centre for Economic Policy Research (CEPR).
Barrett, C.B. and Li, J.R. (2002): Distinguishing between Equi- librium and Integration in Spatial Price Analysis. Ameri- can Journal of Agricultural Economics, 84 (2), 292–307.
https://doi.org/10.1111/1467-8276.00298
Baulch, B. (1997): Transfer Costs, Spatial Arbitrage, and Testing for Food Market Integration. American Journal of Agricultural Economics, 79 (2), 477–487. https://doi.org/10.2307/1244145 Cranfield, J.A.L. (2020): Framing consumer food demand respons-
es in a viral pandemic. Canadian Journal of Agricultural Eco- nomics/Revue Canadienne D’Agroeconomie, 68 (2), 151–156.
https://doi.org/10.1111/cjag.12246
Donaldson, D. (2015): The gains from market integration. Annual Review of Economics, 7, 617–647. https://doi.org/10.1146/
annurev-economics-080213-041015
Dong, X. and Zeballos, E. (2021): COVID-19 Working Paper: The Effects of COVID-19 on Food Sales. AP-088 USDA, Economic Research Service http://doi.org/10.22004/ag.econ.309615 Eurostat (2021): https://ec.europa.eu/eurostat (Acessed in May
2021)
Fackler, P. and Goodwin, B. (2001): Spatial Price Analysis. IN Gardner, B. and Rausser, G. (eds.): Handbook of Agricultural Economics, 971-1024. Elsevier Science.
FAO (2020): Food Outlook - Biannual Report on Global Food Markets – November 2020. Rome. https://doi.org/10.4060/
cb1993en
Food price monitoring tool (2021): Eurostat. Retrieved from:
http://appsso.eurostat.ec.europa.eu/nui/show.do?dataset=prc_
fsc_idx&lang=en (Accessed in February, 2021)
Hillen, J. (2020): Online food prices during the COV- ID-19 pandemic. Agribusiness, 37 (1), 91–107.
https://doi.org/10.1002/agr.21673
Hobbs, J. E. (2020): Food supply chains during the COVID-19 pandemic. Canadian Journal of Agricultural Economics, 68 (2), 71–176. https://doi.org/10.1111/cjag.12237
Imai, K.S., Kaicker, N. and Gaiha, R. (2020): The Covid-19 impact on food prices in India. GDI Working Paper 2020-051. Man- chester: The University of Manchester.
IMF (2021): World Economic Outlook Update January. Interna- tional Monetary Fund, Retrieved from: https://www.imf.org/en/
Publications/WEO/Issues/2021/01/26/2021-world-economic- outlook-update (Accessed in February, 2021).
Kerr, W. A. (2020): The COVID-19 pandemic and agriculture:
Short- and long-run implications for international trade rela- tions. Canadian Journal of Agricultural Economics, 68 (2), 225–229. https://doi.org/10.1111/cjag.12230
Latruffe, L. (2010): Competitiveness, Productivity and Efficiency in the Agri-cultural and Agri-Food Sectors. OECD Food, Ag- riculture and Fisheries Working Papers No. 30. Paris: OECD Publishing. https://doi.org/10.1787/5km91nkdt6d6-en
Nakat, Z. and Bou-Mitri, Ch. (2021): COVID-19 and the food industry: Readiness assessment. Food Control, 121, 107661.
https://doi.org/10.1016/j.foodcont.2020.107661
OECD (2020): Food Supply Chains and COVID-19: Impacts and Policy Lessons. Retrieved from: http://www.oecd.org/coro- navirus/policy-responses/food-supply-chains-and-COVID- 19-impacts-and-policy-lessons-71b57aea/ (Accessed in Febru- ary, 2021).
Poudel P. B., Poudel M. R., Gautam, A., Phuyal, S., Tiwari, Ch. K., Bashyal, N. and Bashyal, S. (2020): COVID-19 and its Global Impact on Food and Agriculture. Journal of Biology and To- day’s World, 9 (5), 221.
Samuelson, P. (1952): Spatial Price Equilibrium and Linear Pro- gramming. American Economic Review, 42 (3), 283–303.
Varshney, D., Roy, D. and Meenakshi, J.V. (2020): Impact of COVID-19 on agricultural markets: assessing the roles of com- modity characteristics, disease caseload and market reforms.
Indian Economic Review, 55, 83–103. https://doi.org/10.1007/
s41775-020-00095-1
Weersink, A., von Massow, M., Bannon, N., Ifft, J., Maples, J., McEwan, K., McKendree, M. G. S., Nicholson, Ch., Nova- kovic, A., Rangarajan, A., Richards, T., Rickard, B., Rude, J., Schipanski, M., Schnitkey, G., Schulz, L., Schuurman, D., Schwartzkopf-Genswein, K., Stephenson, M., Thompson, J.
and Wood, K. (2021): COVID-19 and the agri-food system in the United States and Canada. Agricultural Systems, 188, 103039. https://doi.org/10.1016/j.agsy.2020.103039
WTO (2020): Trade costs in the time of global pandemic. World Trade Organization, Retrieved from: https://www.wto.org/eng- lish/tratop_e/covid19_e/trade_costs_report_e.pdf (Accessed in February, 2021).
X-12-ARIMA Reference Manual (2011): Time Series Research Staff, Centre for Statistical Research and Methodology, US Census Bureau. Retrieved from: http://www.census.gov/ts/
x12a/v03/x12adocV03.pdf (Accessed in February, 2021).
Yu, X., Liu, Ch., Wang, H. and Feil, J-H. (2020): The impact of COVID-19 on food prices in China: evidence of four major food products from Beijing, Shandong and Hubei Provinces.
China Agricultural Economic Review, 12 (3), 445–458.
https://doi.org/10.1108/CAER-04-2020-0054