DOI: 10.1556/446.14.2018.S1.7
1786-335X @ 2018 Akadémiai Kiadó, Budapest
Effect of Ripening Temperature on the Texture of Cow Milk Kashkaval Cheese
G. IVANOV1*, A.BOGDANOVA2, G. ZSIVANOVITS3
Abstract. Texture development during ripening of cow milk Kashkaval cheese at different temperatures (9±1 °С, 11±1 °С and 13±1 °С) was studied. Texture parameters representing cheese hardness, cohesiveness, springiness, adhesiveness, gumminess and chewiness were determined by texture profile analysis. It was found that hardness, gumminess and adhesiveness of all studied samples increased, while springiness and cohesiveness decreased during ripening. An increase of chewiness values during the first stages of ripening was observed, followed by a decrease to the 60th day. It was found that ripening time, as well as ripening temperature had a significant effect on the changes in Kashakaval texture parameters. Cheese samples ripened at higher temperatures had lower values for hardness, cohesiveness, gumminess and chewiness.
Ripening temperature had no significant effect on the changes in springiness and adhesiveness of the studied samples. The results obtained showed that by an appropriate combination of the two factors, ripening time and temperature, the changes in the Kashkaval cheese texture can be controlled, which is important for the quality of the final product.
Keywords: texture profile analysis, Kashkaval cheese, ripening, cheese rheology
Introduction
Texture is one of the most essential components of food quality and could be defined as disposition and arrangement for the different parts of a system. Texture represents all the rheological and structural attributes of food products, perceptible by means of mechanical, tactile, and in some cases visual receptors. Instrumental methods provide relevant information on food textural properties (Fisher and Windhad, 2011). Texture Profile Analysis is used as common instrumental measurement for cheese texture
* Corresponding author. E-mail: ivanovgalin@yahoo.com
1University of Food Technologies, Department: Milk and Dairy Products Technology
2University of Food Technologies, Department: Food Preservation and Refrigeration Technology
3Food Research and Development Institute, Division: Food Safety and Quality
evaluation (Gunasekaran et al., 2002). Instrumental texture profile analysis (ITPA) imitates mastication. Due to limitations of time, panel training, panelist psychology and labor-intensive nature of sensory analysis, instrumental methods have been designed to measure food properties that relate to relevant sensory characteristics (Rosenthal et al., 1999). A TPA generates values of firmness, cohesiveness, elasticity, adhesiveness, gumminess and chewiness that enable the definition of the texture parameters of cheese (Amar et al., 2012).
The changes in processing conditions of cheese manufacture such as heating temperature, salting, stretching, and ripening could cause variations in the chemical composition of the products (Rasmussen et al., 2007).
Chemical composition is one of the most important factors influencing cheese quality and texture. Protein, fat, and moisture are the major constituents, which affect textural and functional properties of cheese (Yates et al., 2007). Additionally, sodium chloride (NaCl) has a direct effect on cheese texture and rheology, because NaCl addition increased the amount of the protein matrix as well as casein hydration and solubilization via calcium displacement (Rulikowska et al., 2013). Several studies focused on the effect of different factors, as chemical composition, storage temperature, rate of proteolysis, etc., on the cheese texture (Kertész, and Felföldi, 2016, Zheng et al., 2016).
The aim of the present study was to investigate the effect of ripening temperature and respectively the extent of proteolysis on the texture parameters of cow milk Kashkaval cheese.
Materials and Methods Cheese making
Kashkaval samples were produced at a local dairy plant (Bor-Chvor -RK Ltd, Plovdiv) from a single vat of milk according to the following procedure. Cow's milk of 3.9% fat was heat-treated at t = 65±1 °С for 15 s and cooled to t = 33±1 °С, pumped into a cheese vat, and inoculated with a thermophilic culture which consisted of Streptococcus thermophilus and Lactobacillus delbrueckii subsp. bulgaricus. Subsequently, calcium chloride and commercial animal rennet were also added. Following a 30 min set, the curd was cut and allowed to heal for 5 min. Next, the curd was stirred gently without heat for another 20 min, followed by heating to 39±1 °C for 40 min with continuous agitation. After that, the whey was drained from the curd,
which was partially molded. The curd was kept at cooking temperature for cheddaring until the pH reached 5.3 (about 2 h). Then the curd was milled and stretched on a blade mixer under a concentrated salt solution (13%) at 72 °C. The Kashkaval loaves were molded into 1 kg parallelepiped forms.
After 15 h the Kashkaval loaves were vacuum-packaged in polyethylene foil under 90–99.8 Pa and left to ripen at three different regimes – 9 ± 1 °С, 11 ± 1 °С and 13 ± 1 °С and relative humidity of 75–80% for 60 days. The gaseous permeability of the polyethylene foil was 175 (pO2) cm3.d–l.m–2.atm–1 and 1000 (pCO2) cm3.d–l.m–2.atm–1, and water vapor permeability was 4 g.cm–2.d–1 at 23 oC.
The samples were investigated at 1, 15, 30 and 60 days of ripening. The measurements of every one examined indicator were repeated three times.
The mean values of those three independent determinations were indicated in the tables and figures.
Physicochemical analyses
The Kashkaval samples were analyzed for moisture content (heat at 105 °C to constant weight), pH, fat content according to Gerber-Van Gulik (BSI, 1955), NaCl content in the aqueous phase according to Mohr (1992).
Noncasein nitrogen, nonprotein nitrogen and total nitrogen content were determined by the Vakaleris and Price method (Vakaleris and Price, 1959) modified to suit the specific conditions of the analysis. Nitrogen determination was performed in duplicate by the Kjeldahl method using a Kjeltec Auto 1030 Analyzer (Tecator Sweden) combined with the Digestion System 20. Total protein (TP) was calculated as total nitrogen multiplied by 6.38.
Texture Profile Analysis (TPA)
The textural parameters of the cheese cubes (25*25*25 mm) were investigated by texture analyser StableMicroSystems TA-XT2i (Stable Micro System, Ltd, UK) equipped with loading cell 50 kg and specialized software
“Texture Exponent 6.1“. The TPA test was done by a flat plate probe (P 50- Stainless steel cylinder probe, Ø = 50 mm) with test speed 1 mm·s−1, a strain of 50% and two bite time interval 5 s. The sample preparation includes measurement of the sample sizes (length, width and height) by digital caliper and measurement of the sample weight by laboratory scales. Before Texture Profile Analysis samples were tempered to room temperature (18–
20 °C). Each TPA test was repeated on 3 cubes. An individual sample was
used for each measurement. Firmness force (F) is determined as the maximum force coordinate of 1st peek of the curve. The adhesiveness can be defined like the stress, necessary to pull up the measure probe after the 50%
compression (negative integrated area, Nmm), the distance of the detected height of the product on the second compression divided by the original compression distance (Length 2 /Length 1) is the springiness; cohesiveness is defined as the ratio between the 2nd and 1st loading area (A2/A1), gumminess was computed like cohesiveness multiplied by the firmness and chewiness was computed like cohesiveness multiplied by the firmness and the springiness (Zeng et al., 2016).
Statistical analysis
Statistical analyses were carried out on the averages of the triplicate results.
Two-way multivariate analysis of variance (MANOVA) and multiple comparison tests were carried out to study the effect of both ripening time and temperature on the physicochemical characteristics and texture parameters of Kashkaval samples (Box et al., 1978). Differences in the averages and F tests were considered significant when the computed probabilities were less than 0.05. All statistical procedures were computed using the Microsoft Excel and Sigma Plot 2001 software.
Results and Discussion Cheese composition and proteolysis
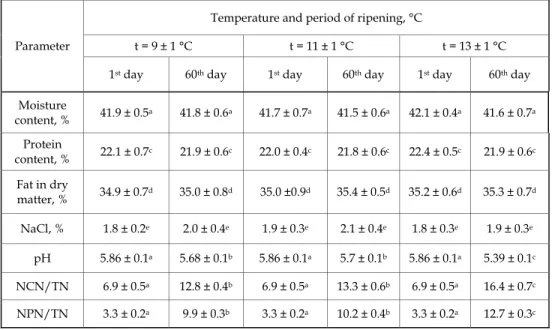
The mean values for the main physicochemical parameters of Kashkaval samples are presented in Table 1. There were no significant (P < 0.05) differences in the moisture, fat in dry matter, protein and salt contents at the 1st and 60th day of ripening of tested samples.
It can be seen that the pH values slightly decreased when the ripening time of Kashkaval cheese increased. That was due to the lactic acid fermentation initiated by the starter microorganisms Lb. delbrueckii ssp.
bulgaricus and Str. thermophilus during the first stages of ripening process.
The proteolytic activity of these microorganisms caused a significant (P < 0.05) increase in noncasein nitrogen (NCN/TN) and nonprotein nitrogen (NPN/TN) as a percentage of total nitrogen. There were no
significant differences (P < 0.05) in the values of these nitrogen fractions between the samples ripened at t = 9±1 °С and t = 11±1 °С. On the other hand, significantly higher (P < 0.05) NCN/TN and NPN/TN values were established in Kashkaval samples ripened at t = 13±1 °С. This data indicated that the increase of ripening temperature above 12 °С accelerates proteolysis in Kashkaval cheese. The differences in proteolysis rate in Kashkaval samples ripened at different temperatures supposed specific patterns in texture development.
Table 1. Mean values for the main physicochemical parameters of Kashkaval samples
Parameter
Temperature and period of ripening, °С
t = 9 ± 1 °С t = 11 ± 1 °С t = 13 ± 1 °С
1st day 60th day 1st day 60th day 1st day 60th day Moisture
content, % 41.9 ± 0.5a 41.8 ± 0.6a 41.7 ± 0.7a 41.5 ± 0.6a 42.1 ± 0.4a 41.6 ± 0.7a Protein
content, % 22.1 ± 0.7c 21.9 ± 0.6c 22.0 ± 0.4c 21.8 ± 0.6c 22.4 ± 0.5c 21.9 ± 0.6c Fat in dry
matter, % 34.9 ± 0.7d 35.0 ± 0.8d 35.0 ±0.9d 35.4 ± 0.5d 35.2 ± 0.6d 35.3 ± 0.7d NaCl, % 1.8 ± 0.2e 2.0 ± 0.4e 1.9 ± 0.3e 2.1 ± 0.4e 1.8 ± 0.3e 1.9 ± 0.3e
рН 5.86 ± 0.1a 5.68 ± 0.1b 5.86 ± 0.1a 5.7 ± 0.1b 5.86 ± 0.1a 5.39 ± 0.1c NCN/TN 6.9 ± 0.5a 12.8 ± 0.4b 6.9 ± 0.5a 13.3 ± 0.6b 6.9 ± 0.5a 16.4 ± 0.7c NPN/TN 3.3 ± 0.2a 9.9 ± 0.3b 3.3 ± 0.2a 10.2 ± 0.4b 3.3 ± 0.2a 12.7 ± 0.3c
a,b,c Means within the same row bearing a common superscript did not differ
significantly (P < 0.05)
Texture analysis
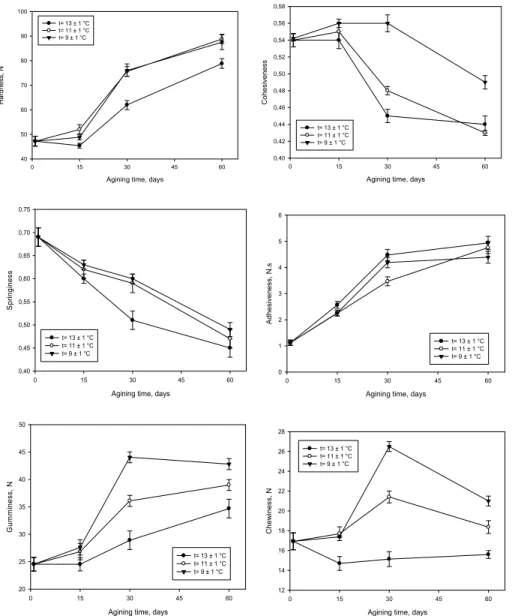
In order to study the impact of ripening process on the textural characteristics of cow milk Kashkaval cheese, the parameters as hardness, cohesiveness, springiness, adhesiveness, gumminess and chewiness were considered (Fig. 1). Cheese hardness is defined as the force necessary to attain a given deformation (Nateghi et al., 2012). Only slight changes in hardness of Kashkaval cheese during the first 15 days of ripening at t = 9±1 °С and t = 11±1 °С were established (Fig. 1). Simultaneously,
hardness of samples ripened at t = 13±1 °С decreased slightly. Irudayaraj et al. (1999) found similar tendency during ripening of cheddar cheese.
Agining time, days
0 15 30 45 60
Hardness, N
40 50 60 70 80 90 100
t= 13 ± 1 °C t= 11 ± 1 °C t= 9 ± 1 °C
Agining time, days
0 15 30 45 60
Cohesiveness
0,40 0,42 0,44 0,46 0,48 0,50 0,52 0,54 0,56 0,58
t= 13 ± 1 °C t= 11 ± 1 °C t= 9 ± 1 °C
Agining time, days
0 15 30 45 60
Springiness
0,40 0,45 0,50 0,55 0,60 0,65 0,70 0,75
t= 13 ± 1 °C t= 11 ± 1 °C t= 9 ± 1 °C
Agining time, days
0 15 30 45 60
Adhesiveness, N.s
0 1 2 3 4 5 6
t= 13 ± 1 °C t= 11 ± 1 °C t= 9 ± 1 °C
Agining time, days
0 15 30 45 60
Gumminess, N
20 25 30 35 40 45 50
t= 13 ± 1 °C t= 11 ± 1 °C t= 9 ± 1 °C
Agining time, days
0 15 30 45 60
Chewiness, N
12 14 16 18 20 22 24 26 28
t= 13 ± 1 °C t= 11 ± 1 °C t= 9 ± 1 °C
Fig. 1. Changes in texture parameters of cow milk Kashkaval cheese during ripening
According to the authors initial rubbery texture of young cheese curd transforms rapidly into a smoother and more homogeneous product due to
proteolysis of the casein network. This casein network is greatly weakened when only a single bond in about 20 % of αs1-casein is hydrolyzed by the coagulant to give the peptide αs1-I (Creamer and Olson, 1982). With the advance of ripening process, an increase in Kashkaval hardness was established (Fig. 1).
According to Lawrence et al. (1983) the increase in hardness after 4–6 weeks of cheese ripening is due to cleavage of many peptide bonds as a result of proteolysis and formation of new ionic groups. These new ionic groups bound the available water in the system thus increasing cheese hardness. There were no significant differences (P < 0.05) in hardness values for Kashkaval samples ripened at t = 9±1 °С and t = 11±1 °С. On the other hand, lower hardness values were established for Kashkaval chees ripened at t = 13±1 °С. These tendencies could be explained with the higher rate of proteolysis in Kashkaval samples ripened at higher temperatures (Table 1), which produces greater weakening of casein network.
The results obtained (Fig. 1) showed a significant impact of ripening process on the Kashkaval cheese cohesiveness. The cohesiveness values of all studied samples decreased during ripening. El Soda (2014) reported similar changes in cohesiveness of low fat Cheddar cheese. The author explained this with the decrease in moisture content and the proteolysis during ripening. According to Lane et al. (1997) cheese cohesiveness is inversely related to cheese proteolysis, with a trend of decreasing with increasing proteolysis. In the present study the ripening temperature had significant effect on the changes in cohesiveness of Kashkaval cheese. It was established that Kashkaval cheese ripened at t = 9±1 °С had higher cohesiveness values than the other cheese samples.
Springiness is defined as the rate and extent to which a deformed object goes back to its undeformed state upon removal of force (Irudayaraj et al., 1999). In the present study the springiness values decreased during ripening from 0.69±0.02 for young Kashkaval cheese to 0.49±0.02, 0.47±0.03 and 0.45±0.03 for samples ripened for 60 days at t = 9±1 °С, t = 11±1 °С and t = 13±1 °С, respectively. These results are in agreement with the findings of El Soda (2014), who reported a decrease in springiness of low fat Cheddar cheese during the ripening period. The protein matrix is elastic when casein is largely intact, but its elasticity is lost during proteolysis (Irudayaraj et al., 1999). According to Kanawjia et al. (1995) the hydrolysis of the para κ-casein molecules during cheese ripening is responsible for the decrease in springiness of cheese curd. The mean values of springiness were not significantly different (P < 0.05) between Kashkaval samples ripened at different temperatures.
Significant changes of Kashkaval cheese adhesiveness during ripening were observed (Fig. 1). The adhesiveness values increased from 1.2±0.3 N.s for young Kashkaval cheese to 4.4±0.4 N.s, 4.8±0.5 N.s and 4.9±0.3 N.s for samples ripened for 60 days at t = 9±1 °С, t = 11±1 °С and t = 13±1 °С, respectively. Ripening temperature had no significant effect (P < 0.05) on the changes in this texture parameter. Probably, the increase of adhesiveness during Kashkaval cheese ripening is due to the releasing of low molecular substances in curd matrix as a result of the proteolysis.
Everard et al. (2006) also reported that adhesiveness of Cheddar cheese significantly increased during ripening.
Gumminess and chewiness are texture parameters describing the combined perceptions for hardness, springiness and cohesiveness of cheese in the mouth of the consumers. Nateghi et al. (2012) defined gumminess as the energy needed to disintegrate a semisolid food until it becomes ready for swallowing. According to the same authors chewiness could be defined as the number of masticates required for a certain amount of sample in order to satisfactorily decrease the consistency for swallowing. The results obtained (Fig. 1) showed that the gumminess and chewiness values of Kashkaval samples ripened at t = 9±1 °С and t = 11±1 °С increased up to the 30th day of ripening. Between the 30th and 60th day of ripening gumminess of these samples did not change significantly while chewiness decreased.
Only a slight increase of gumminess and slight decrease in chewiness values during ripening of Kashkaval samples at t = 13±1 °С were observed.
Similar trends for Cheddar cheese gumminess and chewiness were reported by Irudayaraj et al. (1999). The authors established that the chewiness increased with age and decreased with fat content. Overall trend was similar to that of hardness because of its strong interdependence.
Conclusion
Proteolysis in cheese matrix is the main process conducting the textural changes in Kashkaval cheese. Increasing the ripening temperature from 9±1 °С to 13±1 °С resulted in an accelerated proteolysis and had significant impact on the texture development of Kashkaval cheese. Samples ripened at higher temperatures had lower values for hardness, cohesiveness, gumminess and chewiness. Ripening temperature had no significant effect on the changes in springiness and adhesiveness. By an appropriate combination of the two factors, ripening time and temperature, the changes
in the Kashkaval cheese rheology parameters can be controlled, which is important for the quality of the final product.
References
Amar, A. and Surono, I.S. (2012). Physicochemical and sensory properties of soy based Gouda cheese analog made from different concentration of fat, sodium citrate and various cheese starter cultures. Makara J. Technol., 16(2): 149–156.
Bourne, M. (1978). Texture Profile Analysis. Food Technology, 32: 62–66, 72.
Box, G., Hunter, W. and Hunter, J. (1978). Statistics for experimenters: an introduction to design, data analysis, and model building. Wiley New York.
BSI, British Standard No 696, (1955). Gerber method for the determination of fat in milk and milk products. British Standards Institution, London.
Creamer, L.K. and Olson, N.F. (1982). Rheological evaluation of maturing cheddar cheese. Journal of Food Science, 47: 631-636, 646.
El Soda, M. (2014). Production of low fat Cheddar cheese made using exopolysaccharide-producing cultures and selected ripening cultures. Scientific Research, 4: 986–995.
Everard, C.D., O’Callaghan, D.J., Howard, T.V., O’Donnell, C.P., Sheehan, E.M. and Delahunty, C.M. (2006). Relationship between sensory and rheological measurements of texture in maturing commercial Cheddar cheese over a range of moisture and pH at the point of manufacture. Journal of Texture Studies, 37: 361–
382.
Fisher, P. and Windhad, E.J. (2011). Rheology of food materials. Curr. Opin. Colloid Interface Sci. 16: 36–40.
Gunasekaran, S. and Ak, M.M. (2002). Cheese rheology and texture. CRC Press Boca, Raton, 512 p.
Irudayaraj, J., Chen, M., and McMahon, D.J. (1999). Texture development in Cheddar cheese during ripening. Canadian Agricultural Engineering, 41(4): 253–258.
Kanawjia, S.K., Rajesh, P., Sabikhi, L. and Singh, S. (1995). Flavor, chemical and texture profile changes in accelerated ripened Gouda cheese. LWT-Food Science and Technology, 28: 577–583.
Kertész, I. and Felföldi, J. (2016). Comparison of sound velocity estimation and classification methods for ultrasonic testing of cheese. Progress in Agricultural Engineering Sciences, 12(1): 51–62.
Lane, C.N., Fox, P.F., Johnston, D.E. and McSweeney, P.L.H. (1997). Contribution of coagulant to proteolysis and textural changes in Cheddar cheese during ripening.
International Dairy Journal, 7: 453–464.
Lawrence, R.C., Gillis, J. and Creamer, L.K. (1983). The relationship between cheese texture and flavor. New Zealand Journal of Dairy Science and Technology, 18: 175–190.
Nateghi, L., Roohinejad, S., Totosaus, A., Mirhosseini, H., Shuhaimi, M., Meimandipour, A., Omidizadeh, A. and Abd-Manap, M.Y. (2012). Optimization of textural properties and formulation of reduced fat Cheddar cheeses containing fat replacers. J. Food, Agr. Envir., 10(2): 46–54.
Rasmussen, T.C., McMahon, D.J., Broadbent, J.R. and Oberg, C.J. (2007). Texture profile analysis and melting in relation to proteolysis as influenced by aging temperature and cultures in Cheddar cheese. Journal of Dairy Science, 1(90): 271.
Rosenthal, A.J. (1999). Food texture measurement and perception, edited by Rosenthal, A.J.
Springer, Gaithersburg, 311 p.
Rulikowska, A., Kilcawley, K.N. and Doolan, I.A. (2013). The impact of reduced sodium chloride content on Cheddar cheese quality. International Dairy Journal, 28(2): 45–
55.
Vakaleris D. and Price, W. (1959). A rapid spectrometric method for measuring cheese ripening. J. Dairy Sci., 42: 246.
Yates, M.D. and Drake, M.A. (2007). Texture properties of Gouda cheese. Journal of Sensory Studies, 22(5): 493–506.
Zheng, Y., Liu, Z. and Mo, B. (2016). Texture profile analysis of sliced cheese in relation to chemical composition and storage temperature. Journal of Chemistry, 10.