Multifunctional composite: Reinforcing fibreglass bundle for deformation self-sensing Hegedűs G., Sarkadi T., Czigány T.
This accepted author manuscript is copyrighted and published by Elsevier. It is posted here by agreement between Elsevier and MTA. The definitive version of the text was subsequently published in [Composites Science and Technology, 180, 2019, DOI:
10.1016/j.compscitech.2019.05.018]. Available under license CC-BY-NC-ND.
Powered by TCPDF (www.tcpdf.org)
Multifunctional composite: Reinforcing fibreglass bundle for deformation monitoring
G. Hegedűs
1, T. Sarkadi
2, T. Czigány
1,3,*1 Department of Polymer Engineering, Faculty of Mechanical Engineering, Budapest University of Technology and Economics, H-1111 Budapest Műegyetem rkp. 3. Hungary
2 Department of Atomic Physics, Faculty of Natural Sciences, Budapest University of Technology and Economics, H-1111 Budapest, Budafoki út. 8. Hungary
3 MTA–BME Research Group for Composite Science and Technology, H-1111 Budapest Műegyetem rkp. 3. Hungary
* Corresponding author. Tel.: +36-1-463-2003, E-mail address: czigany@eik.bme.hu
Abstract: Our goal was to develop a multifunctional continuous glass fibre reinforced epoxy
matrix composite, in which deformation is measured with the use of an arbitrarily chosen fibre bundle. To do this, we made the reinforcing fibre bundle suitable for transmitting light and showed that the intensity of light transmitted by the illuminated bundles changes as a result of deformation. This way, the reinforcing rovings of the composite can become a health monitoring sensor indicating external load.
Keywords: reinforcing glass fibre; light transmission; sensor; deformation monitoring;
multifunctional composite
1. Introduction
In the automotive industry, due to the spreading of electric vehicles and the reduction of emissions, manufacturers make great efforts to reduce the mass of vehicle bodies. One way to achieve this is to replace metal parts with polymer matrix composite parts [1, 2, 3]. Currently, glass fibres are used as reinforcement in 95% of fibre-reinforced composites, and their production has increased in every year since 2010. Production is over a million tonnes per year in Europe, one-third of which is already used by the automotive industry [4]. The spreading of composite parts in the vehicle industry requires regular checking of their structural health.
Several methods are used to detect changes in the structural health of composite structures. One method uses optical sensors; a parameter of the light coupled to the optical sensor (e.g. intensity or wavelength) changes as a result of external influences. The change in the parameter can be used to calculate the load affecting the fibre and therefore its environment (e.g. deformation, stress, temperature). Optical fibres have a small diameter and are very flexible so they can be built into high-stress areas of the composite structure easily [5]. They have other advantages, including high resistance to corrosion and heat. They are not sensitive to electromagnetic signals, nor do they produce such signals [6]. It is easy to connect the signal processing system to the end of built-in optical fibres (the end goes outside the composite structure), and therefore the fibres can perform the regular checking or even in-situ monitoring of the composite structure [7], along with the monitoring of curing during manufacturing [5]. Among the different kinds of optical sensors based on different operating principles [8], the FBG (Fiber Bragg Grating) sensor and the related measurement method are worth mentioning. This sensor is especially suitable to detect microdeformations near the grids created on the fibre [9]. Integrating the FBG sensor into mass-produced composite parts is not cost-effective due to the high price of the sensor and the evaluating equipment, therefore this system cannot be used in general-purpose composite structures [10]. In addition, optical fibres have another disadvantage as sensors in
composite structures: their diameter is an order of magnitude larger than that of the elementary fibres constituting the reinforcing fibre bundle. When an optical fibre is built in, a resin-rich area is formed next to it, which breaks the homogeneity of the composite part, impairs its mechanical properties and can be the starting point of failure [11].
The reinforcing glass fibres of composites differ from optical fibres in design and manufacturing technology, but since the refractive indexes of different resin systems vary in a wide range [12], they can be built into matrix materials that have a lower refractive index than the reinforcing glass fibre and can be made to transmit light [13-16], and this makes them suitable for structural health monitoring, as we showed earlier [17]. Using reinforcing fibres for health monitoring makes the composite multifunctional [18,19]. The reinforcing fibre bundle is illuminated and deformation due to loading can be estimated based on the change of intensity of the transmitted light. This way an extra health monitoring sensor is not necessary as a component of the structure performs this function. In our earlier paper, we showed [17] that the intensity of the light exiting the illuminated fibre bundle depends on the geometry holding the fibre bundle together, the temperature and the quality of the coupling of light. We also showed that the intensity of the light travelling through the fibre bundle decreases exponentially along the length of the fibre bundle due to absorption and dispersion. This property of the fibre bundle is independent of its length and the quality of the coupling of the light can be characterized with its attenuation. It only depends on the material of the fibre and the matrix, the temperature and the wavelength of the light. The attenuation of the fibre bundle (αλ) can be measured, similarly to the attenuation of optical telecommunication fibres [20] (1):
αλ =10/L * lg(Pin/Pout) (1)
where Pin is the power of transmitted light at the end of the shortest section of the fibre bundle, Pout is the power of transmitted light at the end of a given measurement length, and L is the distance between the two measurement points.
In an earlier paper of ours [21] we presented images of the fibre ends of a fibre bundle under load. It is easy to identify the individual fibre ends and their dimming as a result of fibre breaking. Our earlier tests proved that the fibres transmit light and that the intensity of the transmitted light changes as a result of fibre breaking.
The goal of this paper is to present how the intensity of light transmitted by an arbitrarily chosen reinforcing fibre bundle of a continuous glass fibre reinforced composite changes as a result of different loads. The fibre bundle is without special preparation (it does not receive special surface treatment); it is built into a general epoxy resin and is illuminated with an appropriate light source. This way, the reinforcing fibres can be used to identify structural deformation, for in-situ health monitoring, without changing the mechanical properties of the composite structure.
2. Materials and methods
2.1. Materials used, manufacturing the specimens
We used STR 014-320-125 E-glass reinforcement (Krossglass, Poland). It has a refractive index of 1.56, a density of 2.54-2.60 g/cm3 and a surface density of 320 g/m2± 6%. It is plain weave fabric [0,90] (weft direction: 400 tex; warp direction: 300 tex). We used the reinforcement without further special surface preparation. In order for the glass fibres to transmit light, they require a resin with a lower refractive index like the glass fibres. In our earlier paper [17] we measured the refractive index of various resin systems. Based on the results, we applied the MR3012 epoxy resin (Ipox chemicals, Germany) and the MH3122 curing agent (Ipox chemicals, Germany). The mixing ratio was 100:40 mass ratio. This glycerine-based three- function general-purpose epoxy resin can be produced from potentially renewable resources and can also be used with injection technologies (RTM, VARTM) and has a refractive index of 1.52.
Specimen type A
We made a 440 mm long specimen to choose the proper lighting. We guided an arbitrarily chosen fibre bundle out of the fabric, then put an uninsulated cord-end terminal on it at the distances chosen for the test. We put the fibre bundle with the cord-end terminals in a 2 mm inner diameter silicon tube, and soaked the fibre bundle in the silicon tube with resin using vacuum injection. We manufactured a 1 m long specimen with a constant diameter. In order to avoid the error caused by light coming directly from the light source or transmitted by the resin, we made the specimens so that incident light and transmitted light was not in the same direction.
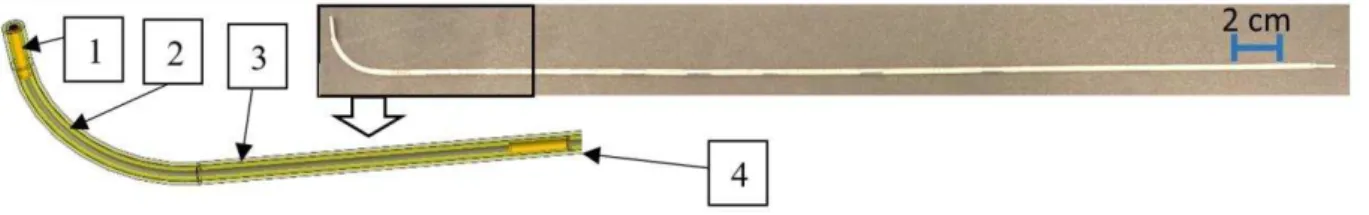
Next to the light coupling inlet, the specimen is bent with a radius of 20 mm, with the fibre bundle in a cord-end terminal at the selected measurement points. The cross section of the specimen between the measurement points was constant (Figure 1).
Figure 1. Specimen type A (1 – uninsulated cord-end terminal; 2 – reinforcing fibre bundle; 3 – resin; 4 – silicon tube with a 2 mm inner diameter)
We polished the start of the reinforcing bundle and the other end corresponding to the tested length with polishing papers of different fineness (30 µm, 6 µm, 3 µm, 1 µm, 0.2 µm), until the surfaces were adequately smooth optically.
Specimen type B
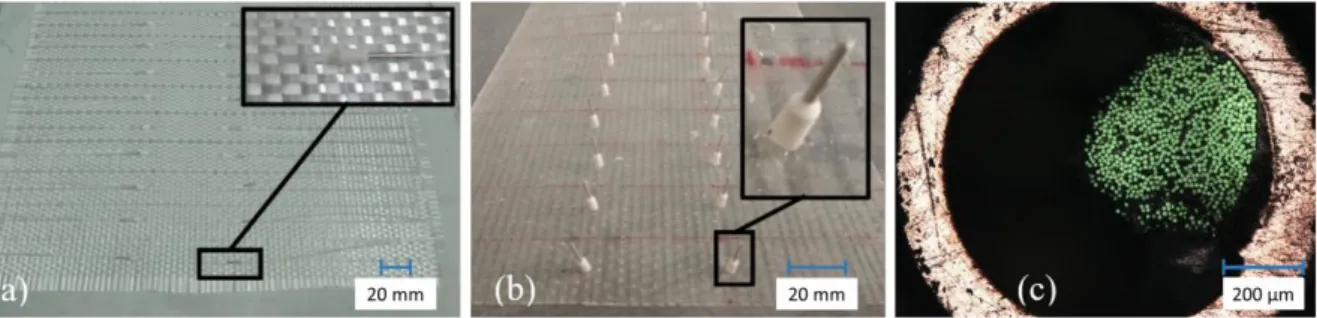
In order to use a part of the reinforcement, not an element inserted into the reinforcement later, we guided the ends of an arbitrarily chosen fibre bundle of one layer of a [0,90] weave reinforcing fabric out of the fabric so that 50 mm of the bundle remained in the fabric and inserted the ends of the bundle in cord-end terminals. We repeated guiding the end out of the
fabric and putting it in a cord-end terminal at every 25 mm. We fixed the cord-end terminals perpendicularly to the tensioned fabric and soaked them and the fabric with epoxy resin by hand lay-up (also within the cord-end terminals), and cured the resin at 70 °C for 4 hours. Then we cut the specimens from the finished 0.65±0.04 mm thick composite sheet as 170 mm long and 25 mm wide rectangles and polished the ends of the fibre bundle in the cord-end terminals to the required smoothness, as with specimen type A (Figure 2).
Figure 2. The ends of a fiber bundle are guided out of the fabric and put into a cord-end terminal (a), resin-soaked fabric with the cord-end terminals perpendicular to it (b), and the digital microscopy image of the polished end of an illuminated fibre bundle in a cord -
end terminal (c)
Depending on the type of test, we reinforced the single-layer composite specimen after polishing with composite reinforcement fashioned from a 3.7 mm thick composite sheet including 6 fabric layers. For tensile tests, we reinforced the place of clamping at the ends of the specimen with two 60 mm x 25 mm tabs at each end. We stuck on the tabs with AcraLock SA 10-05 BLK (USA) adhesive. For compression tests (for compression in the axis of the fibre and for 4-point bending), we bonded the specimen on 250 mm x 25 mm rectangles of the above- mentioned 3.7 mm thick composite sheet with its own matrix material.
2.2. Equipment and measurement methods
For the selection of the ideal illumination wavelength, we used white LED light (Cree, XLamp, XP-C LEDs, USA) and a spectrometer (Ocean Optics, USB 4000, USA). For the other
experiments we used green Nd:YAG laser (532 nm), a calibrated light power meter (Coherent OP-2 VIS 0505C13R, USA), and a digital microscope (Keyence, VHX-6000, with a VH- Z100UR lens system, Japan). The evaluation software of the light power meter (Coherent FieldMax II) collected intensity values at a frequency of 1 Hz, while the software of the digital microscope recorded videos at a resolution of 1600x1200 pixels and a frame rate of 15 frames per second.
For coupling and carrying light further, we used a 400 mm long polymer optical cable with a core diameter larger than the diameter of the cord-end terminal (Tru Components, VD-1500, Germany, outer diameter 1500±90 µm, core diameter 1470±90 µm) with an appropriate coupler. This way both the light source and the spectrometer/light power meter could be in a fixed position and further from the specimen. The ends of the polymer optical cable were also polished. We performed measurements on three specimens at room temperature in each test.
We loaded the specimens in a tensile tester (Zwick, BZ020/TN2S, Germany). We checked and corrected the deformation values calculated from the displacement of the crosshead, with a digital extensometer (Mercury Monet DIC, MCR050, the Czech Republic). The measurement layouts can be found in the sections presenting the measurement results.
3. Results and discussion
In our earlier articles, we showed that a reinforcing fibre bundle can transmit light in an appropriately selected resin [17,21]. Our test results below prove that if an arbitrarily chosen fibre bundle of the glass fabric in a composite is illuminated, it can show the deformation of the composite. We examined the change of light power transmitted by the fibre bundle, for which lighting had to be chosen carefully.
3.1. The attenuation of a reinforcing fibre bundle in the visible spectrum
Before the load tests we had to find an appropriate light source, which is capable of illuminating the light-transmitting reinforcing fibre bundles. For this reason, we had to know the light transmission properties of the fibres. We examined the attenuation of the E-glass reinforcing fibre bundle at different wavelengths in a wide spectrum (1) to determine wavelength at which the attenuation of the bundle is lowest. We illuminated the A type, 440 mm long specimen with white LED light through a polymer optical cable, and connected the other end to a spectrometer through a polymer optical cable. We measured the light power transmitted through this system.
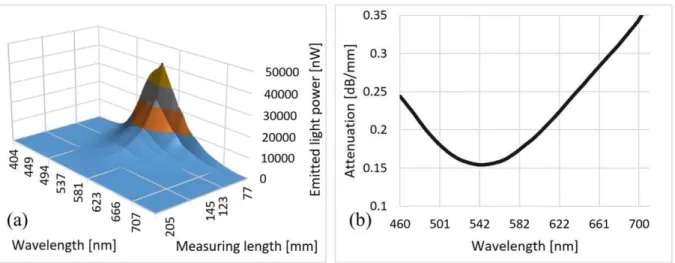
After each measurement, we cut a piece off the specimen, polished the end of the remaining part, and connected it to the light source and the spectrometer again. We measured the transmitted light power as a function of wavelength and specimen length (Figure 3 (a)). The absorption of the polymer optical cable affected the measurement results, therefore we measured it with a spectrometer and used it to correct the measured attenuation of the E-glass reinforcing bundle (Figure 3 (b)).
Figure 3. Transmitted light power as a function of wavelength and fibre bundle length (a) and the attenuation as a function of wavelength calculated according to (1) (b)
The attenuation of the E-glass fibre bundle in the 460 nm – 720 nm range is lowest at 542 nm.
The nearest wavelength light source we had was a 532 nm constant wavelength laser (Nd:YAG).
3.2. The effect of a tensile load parallel to the axis of the reinforcing bundle on the intensity of transmitted light
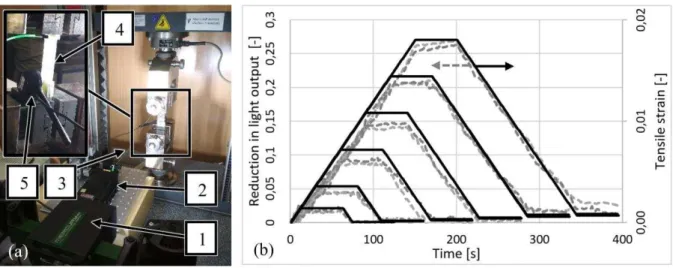
To determine the effect of a tensile load on the intensity of transmitted light, we applied a tensile load to 3 tabbed type B specimens. Crosshead speed was 0.5 mm/min and maximum displacement was larger in every cycle. We measured the relative reduction in the intensity of light (defined by (Pinitial–Pmeasured)/Pinitial) (Figure 4, Figure 5). When maximum displacement was reached, we held it for 50 seconds in each cycle, to observe how the intensity of light transmitted from the tensioned fibre bundle changed. After 50 s, we decreased the load on the specimen at a speed of 0.5 mm/min. Data collection continued for 50 s after loading was ceased.
In the case of all three specimens, the uploading steps were repeated until the specimen was completely broken. Clamping distance was 75 mm but for the calculation of strain, we used the distance between the reinforcing tabs (50 mm). We checked the change in distance with a digital extensometer and used the measurement results to correct the strain calculated from crosshead displacement.
Figure 4. Measurement layout for the measurement of transmitted light power during a tensile test (a) (1-digital extensometer, 2-laser light source, 3-polymer optical cable, 4- specimen, 5- loght power meter) and strain and transmitted light power as a function of
time during the loading and unloading of a specimen (b)
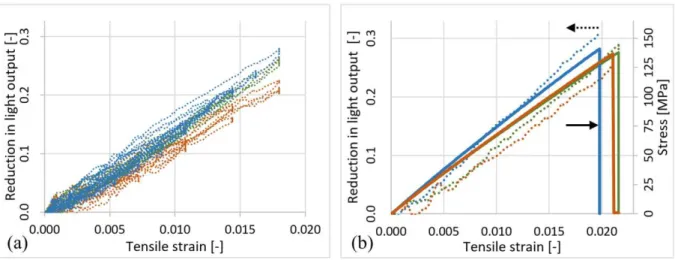
Figure 5. The decrease in transmitted light power as a function of strain in the case of the three specimens examined, at deformation before breaking (a) and at deformation causing breaking (b) (the values of the individual specimens are marked with blue, green and red )
The test showed that the attenuation of the fibre bundle returns to a value close to its unloaded value after loading is ceased. We detected a nearly linear relationship between transmitted light power and tensile deformation. Up to a strain of 1.8%, we observed a decrease of 20-28%, while at break we observed a decrease of 24-30% in transmitted light power. At the point of break, the ends of the broken fibre of the fibre bundle move away from each other and the light cannot enter the other fibre at break and so measured light power decreases to zero (Figure 6).
Figure 6. Light travelling through an unbroken fibre bundle (a), and light emitted by the broken fibre bundle (c)
The amount of light transmitted by the fibres is determined by the absorption of the fibres, and the scattering of the light travelling through the fibres, the light leaving the fibre through its surface. E-glass is not free from contaminants, therefore the light can excite the molecular level components of the E-glass. We supposed that the mechanical strain does not have has any significant effect on the optical absorption of the E-glass material, because no chemical transformation occurred during mechanical loading. The strain changes the refractive index of the materials, and optical anisotropy can also be induced by mechanical stress. These changes enhance light scattering in the wave guide, modifying the light transmission properties of the fibre bundle.
3.3. The effect of a tensile load parallel to the axis of the reinforcing fibre bundle on the intensity of light coupled out at the surface of the fibres
As can be seen in Figure 6 (b), the fibre bundle works as a light guide, but a significant amount of light leaves the fibres at the surface of the specimen. (Without this effect we could not see the trace of the light in the photo.) This light is scattered and coupled out of the light guide causing transmission losses. We have shown above that the tensile load has a significant effect on the transmission of the bundle. Below we show that the increasing transmission losses are caused by the increase of light power coupled out of the fibres.
To measure the change in the power of the light leaving the surface of a fibre bundle of the reinforcing fabric during tensile loading, we applied a tensile load to type B tabbed specimens using the same loading and unloading speed and 50 s delay time, with increasing maximum displacement in each cycle. We fastened the light power meter on the surface of the specimen (as opposed to previous tests) with shading that ensured that an external light source could not affect the measurement results (Figure 7), and measured the relative increase in the outcoupled light power (defined by (Pmeasured-Pinitial)/Pinitial).
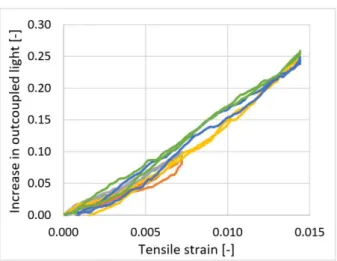
Figure 7. The increase in outcoupled light power during loading and unloading as a function of strain (the values of the individual cycles are marked with different colors)
The measurement results indicate that the power of the light leaving the surface of the fibre bundle is directly proportional to the strain during tensile loading. At a strain of 1.4%, emitted light power grows 23±1.5%. The amount of emitted light is significant and this greatly influences the power of light coupled out at the end of the fibre bundle as a result of a tensile load.
3.4. The effect of a tensile load parallel to the axis of the reinforcing fibre bundle on the power of light transmitted by the fibres
We measured the change in the light at the end of the fibres of the illuminated fibre bundle as a result of tensile loading to prove that the decrease in the power of transmitted light at the end of the fibre bundle is not caused by damage or the breaking of the fibres. We applied a tensile load to type B tabbed specimens using the same loading and unloading speed and 50 s delay time as in previous test series, with increasing maximum displacement in each cycle. We observed the ends of the fibres of the illuminated fibre bundle with a digital microscope and recorded the changing image on video. To achieve good quality recording, we inserted the cord- end terminal at the end of the fibre bundle in the positioning hole of a tailor-made cap attached to the lens of the microscope. We used bright field illumination at the top side of the sample.
The ends of the fibres and the cord-end terminal can be seen well in the images (Figure 8).
When the bright field illumination of the microscope was switched off, only the illuminated fibre ends glowed, so they were visible through the whole measurement series.
Figure 8. Layout for the observation of the light transmitted from fibres of the illuminated fibre bundle (a), and the microscopy images of the end of the bundle without illumination
(b), illuminated with green laser light when not loaded (c) and at a strain of 0.36% (d), 0.72% (e), 1.08% (f), 1.44% (g), and 1.8% (h) (brightness -32%; contrast +100%) (1-
digital microscope, 2-polymer optical cable, 3-the tailor-made cap of the digital microscope, 4-specimen, 5-cord-end terminal, 6-illuminated fibre bundle)
The images show that the specimen was not loaded to the extent that would cause damage or breaking of the fibres as the fibres continue to transmit light. The measurement results suggest that the decrease in the intensity of the light transmitted at the end of the fibre bundle is not caused by damage to or breaking of the individual fibres.
3.5. The effect of compression perpendicular to the axis of the reinforcing fibre bundle on the light power transmitted at the end of the fibre bundle
In the reinforcing fabric used in the measurements, longitudinal and transversal fibre bundles cross each other. As a result of a tensile load, a compression force is generated between the perpendicular fibre bundles. An increase in the compression force between the fibre bundles
causes them to get closer. As a result, it increases the amount of light leaving the fibre at the point where fibre bundles cross. The light emitted locally at the point where perpendicular fibre bundles cross can be seen in Figure 6. The green patches due to emitted light are more intensive at transversal fibre bundles and as a result, these fibre bundles can be seen well, while the sections between them, only soaked with resin, show very little scattered light.
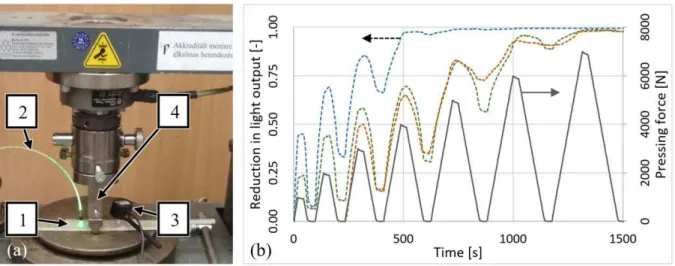
Our goal is to prove that the force between the illuminated fibre bundle and the fibre bundle crossing it has a decisive role in determining the transmitted light power at the end of the illuminated fibre bundle. We bonded a specimen type B on a composite sheet with an adhesive and pressed the transversal fibre bundle above the illuminated fibre bundle at an loading and unloading speed of 50 N/s with a 5 mm diameter cylinder, with an increasing maximum compression force in each cycle. When maximum force was reached, and after downloading, we continued measurement without changing the load for 30 seconds (Figure 9).
Figure 9. Measurement layout for measuring transmitted light power during compression perpendicular to the fibre bundle (a) (1-specimen, 2-optical fibre, 3-light power meter, 4- the compression fixture of the tensile tester) and the reduction in the power of the light transmitted by the three specimens as a function of compression force and time (b) (the values corresponding to the individual specimens are marked with blue, green and red)
As compression force increases, the intensity of light transmitted at the end of the fibre bundle decreases. When loading is removed, the intensity of transmitted light does not return to its original value. This indicates that more light leaves the fibre bundle through the crossing fibre bundles than before loading started because after loading stops the transversal fibre bundles do not move back to their original position. A sufficiently large compression force causes nearly all light to pass into crossing fibre bundles from the illuminated fibre bundle.
After unloading, we examined the illuminated fibre bundle of the specimens at the locations where other fibre bundles crossed them, with a digital microscope at a magnification of 100x.
(Figure 10). We recorded images using the bright field illumination of the digital microscope and without it.
Figure 10. Measurement layout for the examination of light leaving the fibre bundle (a), and the 100x magnified images of the illuminated fibre bundle at the locations where other fibre bundles crossed them after unloading at the unloaded area (b), area loaded
with 3000 N (c) and the area loaded with 7000 N (d) with the use of the bright field illumination of the microscope, and without illumination (the direction of illumination by the microscope is marked with an arrow; in images without illumination +60% brightness
is applied)
When bright field illumination was used, the green laser light could be seen faintly under the resin, while without bright field illumination, the green laser light is clearly visible in the fibre bundle. The green sections show the light leaving the fibre bundle. The images prove that much of the light leaves the fibre bundle at locations where the bundle is in contact with crossing fibre bundles. Due to the residual deformation after unloading, more light leaves the fibre bundle at crossing fibre bundles even after unloading. The nearer the crossing fibre bundle is to the illuminated fibre bundle, the less light is transmitted to the end of the illuminated fibre bundle.
3.6. The effect of compression parallel to the axis of the reinforcing fibre bundle on the intensity of light (4-point bending)
We used four-point bending tests to examine the change in the intensity of transmitted light at the end of the illuminated fibre bundle as a result of axial compression of the fibre bundle (indirectly increasing the distance between the illuminated fibre bundle and the crossing fibre bundles). We chose four-point bending because between the upper two fixtures (on the upper side of the specimen) there is a pure compressive force. Type B specimens are very flexible (there is only one layer of reinforcing fabric), therefore we bonded the specimen on the previously mentioned 3.7 mm thick composite sheet with its own matrix material (thus making overall thickness 4.4 mm). We chose a 100 mm loading span; this way the illuminated fibre bundle with its outlet was between the loading points. Support span was 200 mm, and the radius of the supports was 10 mm. We measured deflection with a digital extensometer.
Uploading and downloading speed was 5 mm/min, and maximum displacement was increased in each cycle. When maximum deformation was reached, the force was held for 25 s and measurement was continued. In the case of all three specimens, the uploading steps were repeated twice. We only examined the degree of compression of the specimen and the relative increase in the intensity of the light transmitted by the illuminated fibre bundle (defined by
(Pmeasured-Pinitial)/Pinitial), since our goal was not to obtain the mechanical properties of the carrier composite sheet (Figure 11).
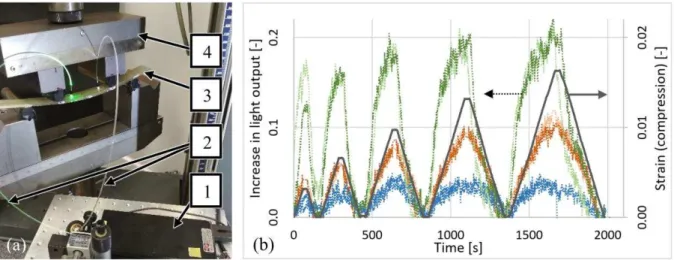
Figure 11. Measurement layout for the measurement of the intensity of light transmitted by the illuminated fibre bundle during a four-point bending test (a) (1-laser light source,
2-optical cable, 3-specimen, 4-the compression fixture of the tensile tester) and the increase in the intensity of light transmitted by the three specimens as a results of
compression parallel to the axis of the fibres (b) (the values corresponding to the individual specimens are marked with blue, green and red)
Although the measurement results differ considerably for the three specimens, it is clearly shown that the axial compression of the fibre bundle increases the intensity transmitted at the end of the illuminated fibre bundle. When loading stops, the intensity of transmitted light returns to a value near the original value.
4. Conclusions
The E-glass fibre bundle used as reinforcement in composite structures can be built into a commercially available general purpose resin with a lower refractive index and this way it can transmit light even without special preparation (without removing its sizing). The fibre bundle
built into a given resin system can be characterized by its attenuation at a given temperature and illumination wavelength. The attenuation of the E-glass fibre bundle is lowest near a wavelength of 542 nm (~0,14 dB/mm). When an arbitrarily chosen fibre bundle of a glass reinforcing plain weave fabric is illuminated, the power of the light transmitted by the fibre bundle changes depending on the load experienced by the fibre bundle. A tensile load parallel to the axis of the fibre bundle decreases the transmitted light power. Until breaking, the decrease in light power is directly proportional to the tensile deformation (in the case of the examined specimens, it is 27±3%). If the fibre bundle does not break, transmitted light power returns to its original value after loading is stopped.
A compression force perpendicular to the axis of the fibre bundle in a reinforcing fabric also causes light power transmitted at the end of the bundle to decrease. The decrease is proportional to the distance between the crossing fibre bundles. After the compression load stops, the transmission of the bundle does not return to its original value, which indicates that the distance between the crossing fibre bundles has decreased permanently. The deformation caused by compression can even decrease the amount of light transmitted by the fibre bundle to zero.
During four-point bending, the power of transmitted light of an illuminated fibre bundle in a reinforcing fabric increases as a result of compression parallel to the axis of the illuminated fibre bundle. When loading stops, the transmitted light power at the end of the illuminated fibre bundle returns to a value near the original value, if the load did not cause failure.
We proved with measurements that a change in transmitted light power of the illuminated fibre bundle as a result of deformation is not caused by damage to the fibres of the fibre bundle or their breaking. The power of the light transmitted by the illuminated fibre bundle largely depends on the amount of light leaving the fibre bundle through the surface of the bundle. The illuminated fibre bundle is crossed by other fibre bundles in the reinforcing fabric. We showed that a visible amount of light leaves the illuminated fibre bundle where it is crossed by other
fibre bundles. The distance of crossing fibre bundles has a significant effect on the amount of light that leaves the illuminated fibre bundle near the crossing fibre bundles. The smaller the distance is, the more light can leave the illuminated fibre bundle near the crossing fibre bundles.
A tensile load or a compression load perpendicular to the axis of the illuminated fibre bundle decreases the distance between crossing fibre bundles, therefore more light can leave the illuminated fibre bundle near the crossing bundles and less light is transmitted at its end.
Deformation, however, caused by compression parallel to the axis of the illuminated fibre bundle (four-point bending) increases the distance between crossing fibre bundles and so less light leaves near the crossing fibre bundles and the power of light at the end of the illuminated fibre bundle increases.
Due to the manufacturing technology of the specimens, the illuminated fibre bundles were differently tensioned in the specimens, and they were also surrounded by a different amount of matrix material, which resulted in differences in the measurement results of the different specimens. Despite this, our test results prove that deformation caused by a tensile or compression load can be identified by measuring the change in light power transmitted at the end of an illuminated fibre bundle of a continuous reinforcing fabric of a composite with a general purpose epoxy matrix even if the fabric receives no special preparation. The identified deformation can also be classified into certain categories. This phenomenon can be used to analyse the structural health of the composite. Using the reinforcing fibre bundle as a deformation measurement sensor means no external health monitor sensor (which affects the integrity of the structure) needs to be built into the structure.
Acknowledgments
This work was supported by the Ministry of Human Capacities [New National Excellence Program, ÚNKP-17-3-I.]; the National Research, Development and Innovation Office (NKFIH) [OTKA K 116070 and K120592; NVKP_16-1-2016-0046; and 2017-2.2.4-TÉT-AT],
further by the Higher Education Excellence Program of the Ministry of Human Capacities in the frame of Nanotechnology research area of Budapest University of Technology and Economics [BME FIKP-NANO].
References
[1] J. Szakács, L. Mészáros, Effect of fibre contents on fatigue behavior of injection molded polyamide 6 matrix composites, Period. Polytech. Mech. 61 (2017) 6–10.
[2] T. Ishikawa, K. Amaoka, Y. Masubuchi, T. Yamamoto, A. Yamanaka, M. Arai, J.
Takahashi, Overview of automotive structural composites technology developments in Japan, Compos. Sci. Technol. 155 (2018) 221-246.
[3] M. Bunea, A. Cîrciumaru, M. Buciumeanu, I.G. Bîrsan, F.S. Silva, Low velocity impact response of fabric reinforced hybrid composites with stratified filled epoxy matrix, Compos.
Sci. Technol. 169 (2019) 242-248.
[4] E. Witten, T. Kraus, M. Kühnel, Composites market report 2016, (2016) 1-46.
[5] Y. Qi, D. Jiang, S. Ju, J. Zhang, (2018). Investigation of strain history in fast and conventional curing epoxy matrix composites by FBGs, Compos. Sci. Technol. 159 (2018) 18- 24
[6] B. Gholamzadeh, H. Nabovati, Fiber optic sensors. Int. J. Electron. C. 2(6) (2008) 1107– 1117.
[7] S. Minakuchi, N. Takeda, Recent advancement in optical fibre sensing for aerospace composite structures, Photonic Sensors. 3 (2013) 345–354.
[8] B. Glisic, D. Inaudi, Fibre optic methods for structural health monitoring, John Wiley
& Sons Ltd, New York, 2007.
[9] D. Kinet, P. Mégret, K.W. Goossen, L. Qiu, D. Heider, C. Caucheteur, Fiber Bragg grating sensors toward structural health monitoring in composite materials: challenges and solutions, Sensors. 14(4) (2014) 7394-7419.
[10] G. Hegedűs, T. Czigány, Analysis of the applicability of optical fibers as sensors for the structural health monitoring of polymer composites: the relationship between attenuation and the deformation of the fibre, Sensor Actuat. A-Phys. 272 (2018) 206-211.
[11] K. Shivakumar, L. Emmanwori, Mechanics of failure of composite laminates with an embedded fibre optic sensor, J. Compos. Mater. 38 (2004) 669–680.
[12] F. Aloui, L. Lecamp, P. Lebaudy, F. Burel, Refractive index evolution of various commercial acrylic resins during photopolymerization, Express Polym. Lett. 12 (2018) 966– 971.
[13] G. Kister, L. Wang, B. Ralph, G.F. Fernando, Self-sensing E-glass fibres, Opt. Mater.
21 (2003) 713–727.
[14] G. Kister, B. Ralph, G.F. Fernando, Damage detection in glass fibre-reinforced plastic composites using self-sensing E-glass fibres, Smart Mater. Struct. 13 (2004) 1166–1175.
[15] S.A. Malik, L. Wang, P.T. Curtis, G.F. Fernando, Self-sensing composites: In-situ detection of fibre fracture, Sensors 16 (2016) 615.
[16] L. Wang, A. Tomlin, S.D. Pandita, B.D. Gupta, S.A. Malik, M. Hudson, P.T. Curtis, G.F. Fernando, In-situ monitoring of cross-linking reactions using E-glass fibres and evanescent wave spectroscopy, Sensor Actuat. B-Chem. 236 (2016) 358–366.
[17] G. Hegedűs, T. Sarkadi, T. Czigány, Light transmission characteristic of reinforcing glass fibres used in polymer composites, Materials. 10(6) (2017) 637 p9.
[18] G. Fredi, A. Dorigato, A. Pegoretti, Multifunctional glass fibre/polyamide composites with thermal energy storage/release capability, Express Polym. Lett. 12(4) (2018) 349–364.
[19] A.T. Marques, A.D.B.L. Ferreira, P.R.O. Nóvoa, Multifunctional material systems: A state-of-the-art review, Compos. Struct. 151 (2016) 3-35
[20] K.T.V. Grattan, B.T. Meggitt, Optical fibre sensor technology, Springer- Science+Business Media, Dordrecht, 1995.
[21] N. Forintos, G. Hegedűs, T. Czigány, Health monitoring of high performance polymer composites with multifunctional fibers, Proceedings of the 21st International Conference on Composites Materials, 2017 Aug 20-25, Xi’an, China, (2017) p. 3153/1-3153/8