Thesis
METHOD FOR EVALUATION OF TEXTURAL ATTRIBUTES OF BREAD CRUMB
Anikó Lambert-Meretei
Supervisors:
Prof. András Fekete, DSc László Baranyai, PhD
Corvinus University of Budapest Faculty of Food Science
Department of Physics and Control
Budapest, 2012
PhD School/Program
Name: PhD School of Food Science Field: Food Science
Head: Prof. Péter Fodor, DSc
Department of Applied Chemistry Faculty of Food Science
Corvinus University of Budapest
Supervisors: Prof. András Fekete, DSc László Baranyai, PhD
Department of Physics and Control Faculty of Food Science
Corvinus University of Budapest
The applicant met the requirement of the PhD regulations of the Corvinus University of Budapest and the thesis is accepted for the defence process.
……..………. .………...………... .……….………...
Head of School Signatures of Supervisors
1. INTRODUCTION
Bread is one of the staple foods for ages. Nowadays because of the nutritional properties its role in healthy nutrition is emphasized as well.
The Codex Alimentarius Hungaricus summarizes the requirements of food quality in consumers’ defense, thus it contains standards for breads as well. In consumers’ point of view the good quality bread crumb is soft and elastic; it can be squeezed easily but after compression recovers its original dimension. According to Hungarian Standards “Elasztigraf”
should be used to describe the elasticity of bread crumb. The Codex Alimentarius Hungaricus fixes the minimum of relative elasticity at a level of 0.8. This value was also determined using
“Elasztigraph” and it means that a bread crumb sample must recover at least 80% of its original height after compression, otherwise it fails the standards.
Due to the wide use of bread improvers bread crumb became softer and much more aerated than that of traditional, old bread types, so their rheological properties has been changed a lot as well. Because of its limited measuring range Elastigraph is not able to determinate the total deformation anymore.
As mentioned before, the texture of bread crumb strongly influences the consumers’ opinion, so the description of its rheological properties is of high importance. Therefore, development of a simple, reliable measuring method for characterization of bread crumb is an actual and essential task.
2. OBJECTIVES
The objectives of my thesis were as follows:
− Development of a new compression test method to evaluate bread crumb characteristics based on Elastigraph, considering size of probe, loading force and time.
− Determination the effect of sample size on the results and development a suitable sample preparation method.
− To determine the effect of test speed and finding correlation among test speed and measured properties.
− Determination of suitability of developed method tested on different bread types.
− Comparison results with the developed test method to other accepted and widely used methods.
3. MATERIALS AND METHODS
3.1 Implementation of Elastigraph-based test method with TA.XT2 texture analyzer For bread crumb quality evaluation Hungarian Standard requires the use of Elasztigraf.
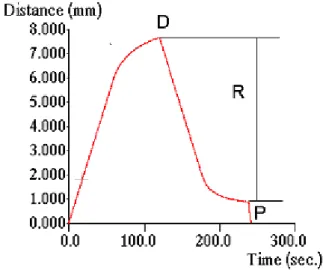
Results are plotted on paper chart by this equipment during the whole measurement. From created elastigram the value of the total (D) elastic (R) and plastic (P) deformation can be determined. These values describe the rheological behavior of bread crumb properly.
Elastigraph was implemented to Stable Micro Systems TA.XT2 texture analyzer. To do that TA.XT2 was used in relaxation test mode and a P/75 probe (75 mm diameter aluminum plate) was fitted. The test force was set for 1875g and load was held for 3 minutes similar to Elastigraph. After that it was removed and the height recovery of bread crumb sample was traced for another 3 minutes. Using relaxation test mode test speed, force and time should be specified, after that texture analyzer carries out the measurement automatically and there is no need for manual control action.
The deformation-time diagram (fig. 1.) was recorded by the own software of the texture analyzer. From the curve the total (D), elastic (R) and plastic (P) deformation can be determined in millimeters. The R/D ratio can be calculated as well, it gives a value similar to the relative elasticity of Elastigraph.
Figure 1.: The deformation-time diagram plotted by TA.XT2 in relaxation test mode In these experiments four different kinds of bread (“barna” with 70% rye-30% wheat flour,
“rozsos” with 35% rye-65% wheat, “félbarna” with 15% rye-85% wheat and “fehér” with 100% wheat flour content) were involved. Because of their different composition different bread crumb characteristics were supposed. All breads were tested on the day of baking,
measurements were carried out on a special specimen (cylindrical sample with a 56.5 mm diameter and 50 mm height) with 5-5 replicates pro equipment and bread type.
3.2. Development of measuring method
International standards such as the accepted method for bread evaluation of American Association of Cereal Chemists (AACC) and that of the American Institute of Baking (AIB) work on bread slices. Thus, I decided to go on with my experiments also on slices instead of special shaped crumb specimens. It is obvious that in this case the method based on Elastigraph must be improved. The questions of interest were the dimensions of suitable probe, the value of loading force and the period of test time.
3.2.1 Determination of optimal size of probe
Practically, an obvious choice is a probe smaller than the size of slice surface. It should be taken into account, that bread crumb especially that of breads with high wheat flour content is heterogeneous, often with relative big holes in it. This can lead to measurement errors at small diameter probes. If the contact area of probe is of similar size as slice surface, the harder regions near the crust can also strongly influence the results.
Breads with 15% rye flour content (“félbarna”) were involved in the experiments. Their crumb is similar to that of wheat breads (“fehér”) but more uniform. A simple, accepted bread testing method based on AIB standard was chosen for the measurements. The diameter of tested probes was 10, 25, 35, 45 and 75 mm. Test were carried out on 15 mm thick bread slices with 15-15 replicates.
3.2.2. Determination of loading force
In case of Elastigraph, the maximum deformation that the equipment can measure is 60 %. So I wanted to fix the force value which does not cause more than the mentioned 60%
deformation in case of wheat bread either. Experiments were carried out on 15 mm thick wheat bread slices. The test method chosen was “Measure force in compression” the fitted probe’s diameter was 35 mm, the maximum allowed value of deformation was 60 % of original sample height. The force to achieve defined deformation was determined.
After that this force value was tested also on “félbarna”, “barna” and “rozsos” breads as well.
The number of replicates was 15-15 in case of “fehér” and “félbarna” and 12-12 in case of
“barna” and “rozsos” samples.
3.2.3 Determination of test time
As the third step of improving the measuring method, the optimal period of test time was determined. Three different kinds of bread were involved in experiments “fehér”, “rozsos”
and “barna” with 12-10-10 replicates pro bread and time interval. Tests were carried out with a 35 mm diameter probe, test force was 5 N. In relaxation test method the effect of 30, 60, 90 and 120 sec measuring time was investigated.
Based on time-deformation diagram, the total, elastic and plastic deformation was determined and the relative elasticity (R/D ratio) was calculated.
3.2.4. Determination of test speed and sample preparation process
Experiments were carried out on breads containing 15% rye and 85% wheat flour (“félbarna”) in 15-15 replicates.
In the first part of measurements a cylindrical specimen in 35 mm diameter was cut out of the middle of 15 mm thick slices. This disk was loaded with 5 N for 60 seconds in relaxation test mode. A 75 mm probe was attached to the texture analyzer, pre and post test speed was 2 mm/s. Two levels of test speed were investigated 0.2 mm/s and 1.7 mm/s. The 0.2 mm/s refers to quasistatic loading and the 1.7 mm/s is the speed value applied in AACC and AIB standards.
After that with the same force, time and speed settings measurements were carried out on whole bread slices as well. In this case the middle of slices was loaded; the applied probe was 35 mm in diameter.
From the deformation-time diagram the total, plastic and elastic deformation were determined and relative elasticity was calculated.
3.3. Determination of applicability of the developed test method
In these experiments six different kinds of bread were involved, representing a wide range of bread crumb texture.
Measurements were performed on 15 mm thick bread slices in 20-30 replicates depending on the dimensions of loaf. According to the developed method, a cylindrical probe 35 mm in diameter was attached to the texture analyzer, the equipment was used in relaxation test mode.
Test speed was 0.2 mm/s, and 5 N force was held for 60 seconds. As usual from the deformation-time diagram the total, plastic and elastic deformation were determined and relative elasticity was calculated as the R/D ratio.
3.4. Correlation with other accepted and widely used bread testing methods
The results of developed test method were compared to that of AIB standard and Texture Profile Analysis. AIB standard describes the hardness of bread crumb with the force needed to achieve 25 % deformation, while TPA uses several parameters to describe the texture.
Tests were performed with texture analyzer fitted with a probe 35 mm in diameter applying different test modes. Three kinds of bread (“fehér”, “rozsos”, “barna”) were tested in these experiments. Loaves were sliced into 15 mm thick slices and at the both ends the first two slices were discarded. Slices were loaded in the middle, the number of replicates were 40-36- 36 depending on the dimension of the loaf.
4. RESULTS AND DISCUSSION
4.1. Implementation of Elastigraph-based test method with TA.XT2 texture analyzer Results of measurements carried out by Elastigraph and by TA.XT2 texture analyzer were compared. If we rotate the elastigram with 90°it is obvious, that its shape is very similar to the shape of deformation-time diagram plotted by texture analyzer. The characteristics points of elastigram can be found easily on deformation –time diagram as well. Within the measuring limit of Elastigraph, the total and plastic deformation for different bread types shows high correlation with the results of TA.XT2. Therefore it is able to replace the Elastigraph.
Measurements based on fundamental principle of Elastigraph can be easily carried out by texture analyzer. The negative effect of narrow measuring limit (1000 elastigraph unit,
~30mm) could be eliminated; the special tables used with Elastigraph should be adapted. This way the texture of present day’s bread crumb can be described by a reliable, precision measurement.
4.2. Development of the measuring method
Following international standards’ requirements and taken into account the elaborated sample preparation process of Elastigraph, I decided to go on with further experiments on bread slices. To do that refining the method based on fundamental principle of Elastigraph was necessary.
4.2.1 Determination of the optimal size of the probe
The ideal probe is big enough to the effect of bigger pores but small enough to avoid the harder near-crust region. The force to achieve 25% deformation was determined using cylindrical probes of different diameter. The narrow error bars for force values in case of 10,
25 and 35 mm probes indicates similar accuracy. Taking into account the error bars of stress values as well, the probe of 35 mm diameter is the best choice, thus its use was suggested for further measurements.
4.2.2. Determination of the loading force
It is obvious that the applied 1875g loading causes in case of 15 mm thick slices drastic deformation, thus decreasing of test force is necessary. The optimal value of load was determined based on the force-deformation diagrams. The chosen force value should not cause more than 60% deformation in case of wheat breads but should be big enough to achieve measurable deformation in case of dark, rye breads. The force of 5N was found acceptable, it causes ~40% deformation in case of wheat and 15% in case of rye breads
4.2.3 Determination of the test time
In quality control processes measurements should be as short as possible to ensure inmediate control action if needed. Measurements with Elasztigraph are rather time-consuming, one test takes 6 minutes (3 minutes for loading 3 for unloading) without sample preparation.
The structure of a 15 mm thick bread slice is much more sensitive for mechanical influences than a 50 mm high cylindrical bread crumb specimen. Thus creep and recovery needs less time to occur in case of slices.
The objective of this part of work was to find the ideal time period for the developed test method.
If we have a look on coefficients of variables of total, plastic and elastic deformation and of relative elasticity, we find that in case of 60 seconds the CV values are below 15 % for all properties and bread types. At a time period of 30 s CV varies between 2,9-46,58%, at 90 s between 0,65-46,76% and at 120 s between 3,68-47,02%.
For further measurements a time period of 60 s was chosen, thus the total measurement takes about 2 minutes instead of 6 minutes of Elastigraph.
4.2.4. Determination of the test speed and sample preparation process
Based on the results carried out at 0.2 and 1.7 mm/s test speed, no significant difference was found between the values of determined properties.
In case of nearly quasistatic measurement CV values are lower than that of 1.7 mm/s. So a test speed of 0.2 mm/s was found to be optimal.
According to sample preparation, there is significant difference between results of measurements carried out on bread crumb disks and bread slices because of different dynamic effects between sample and probe. In case of relative elasticity, total and plastic deformation strong correlation was found between the values measured on disk and slice. Therefore, experiments could be carried out on bread slices instead of cylindrical crumb specimens as well, so the time-consumption of sample preparation decreases.
4.3. Determination of the applicability of developed test method.
Applicability was tested on 6 types of bread. Tests were performed on 15 mm thick slices with a probe of 35 mm in diameter using 5 N loading force. Test speed was 0.2 mm/s, time period of creep and recovery was 60 s. From deformation-time diagrams total and plastic deformation can be determined, elastic deformation and relative elasticity can be calculated.
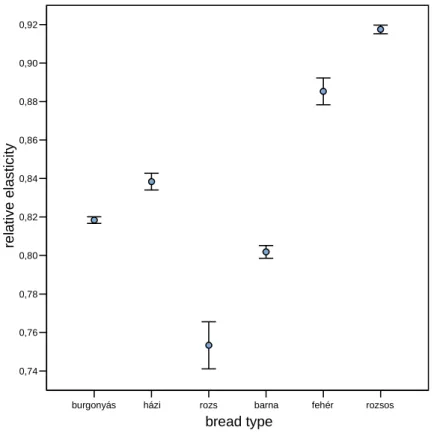
Based on the results the different bread types can be distinguished (figure 2.) thus the applicability of developed method was proven.
burgonyás házi rozs barna fehér rozsos
bread type
0,74 0,76 0,78 0,80 0,82 0,84 0,86 0,88 0,90 0,92
relative elasticity
Figure 2.: Error bars for relative elasticity of six different bread types
4.4. Correlation with other accepted and widely used bread testing methods
A new test method based on the fundamental principle of Elastigraph was developed which is suitable for evaluation present day’s bread texture. But our method is considered to be good only in that case if its results can be compared to results of accepted widely used methods. For this purpose AIB standard and Texture Profile Analysis was chosen.
The AIB standard describes the hardness of bread crumb with the force needed to achieve 25% deformation. The total and plastic deformation similar to relative elasticity show strong correlation with this parameter (table 1.). Therefore, the developed method could be a good alternative for AIB standard. With the mentioned three parameters much more proper description can be given of the texture of bread crumb.
Table 1.: Correlation between results of AIB standards and results of developed method
Property Correlation R
2D negative linear 0,8111 P negative exponential 0,9274
R none 0,021
R/D positive linear 0,9093
Texture Profile Analysis –also called two bites test- works with two consecutive loadings and gives very detailed characterization about texture.
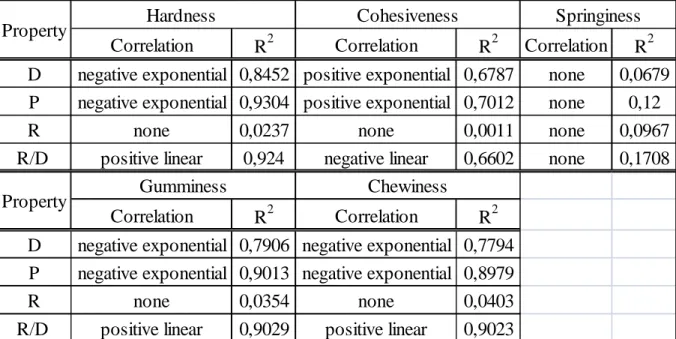
The total deformation shows strong correlation with the hardness, poor correlation with cohesiveness and there is acceptable correlation with gumminess and chewiness (table 2.).
Plastic deformation shows strong correlation to hardness, chewiness and gumminess and good correlation with cohesiveness.
Similarly, strong correlation was found also between relative elasticity and hardness, gumminess and chewiness but correlation with cohesiveness was poor. Springiness does not correlate neither with relative elasticity nor any other parameters.
Table 2.: Correlation between results of TPA and results of developed method (D: total deformation, P: plastic deformation, R: elastic deformation, R/D: relative elasticity)
Correlation R2 Correlation R2 Correlation R2 D negative exponential 0,8452 positive exponential 0,6787 none 0,0679 P negative exponential 0,9304 positive exponential 0,7012 none 0,12
R none 0,0237 none 0,0011 none 0,0967
R/D positive linear 0,924 negative linear 0,6602 none 0,1708
Correlation R2 Correlation R2
D negative exponential 0,7906 negative exponential 0,7794 P negative exponential 0,9013 negative exponential 0,8979
R none 0,0354 none 0,0403
R/D positive linear 0,9029 positive linear 0,9023
Property Hardness Cohesiveness Springiness
Property Gumminess Chewiness
Although the developed method takes more time than TPA the evaluation of plotted curves are more simply and results could be easier interpreted.
To sum up the results, the good correlation with results of other accepted methods is an evidence for reliability and acceptability of the developed method.
5. NEW SCIENTIFIC RESULTS
1. New measuring and evaluation method was developed to describe and evaluate different bread crumb textures. The TA.XT2 texture analyser was used in relaxation test mode and a probe of 35 mm diameter was attached to the equipment. Loading force was set to 5 N, test speed was 0.2 mm/s and time period of creep and recovery was 60 seconds. From the plotted deformation-time diagrams total and plastic deformation can be determined, elastic deformation and relative elasticity can be calculated.
2. The developed method was tested for test speeds of 0.2 mm/s and 1.7 mm/s. To sum up the results there were no significant difference between in the values of total, plastic and elastic deformation and relative elasticity determined at two speed levels.
In case of 0.2 mm/s the CV is between 2- 15% depending on the parameters, while in case of 1.7 mm/s this is 5-60%. Therefore the speed of 0.2 mm/s was suggested for further measurements.
3. Tests were performed on 35 mm diameter 15 mm high cylindrical bread crumb specimens and 15 mm thick bread slices as well. Significant difference was found between the values of determined properties because of different probe size-specimen contact area ratio and because of different dynamic effects between sample and probe.
The correlation between the results measured on different specimens was proven (the values of R2 were 0.8-0.96) so the test performed on slices gave reliable methods as well.
4. With the developed method the Elastigraph’s measuring rate of 1000 elastigraph unit (~30mm) can be multiplied. The dimension of the results is in mm, so the deformation values can be easier interpreted.
5. Strong correlation (R2=0.8-0.92) was found between the relative elasticity, total and plastic deformation of the developed method and the hardness of the AIB standard.
6. Good correlation (R2=0.66-0.92) was found also between the results of the new method and the results of TPA. Thus, the reliability and applicability of the developed method was confirmed.
6. PROPOSALS FOR FURTHER RESEARCH AND FOR PRACTICAL APPLICATIONS
Further research is proposed at below mentioned fields:
− Based on results of carried out on breads with different crumb texture in high replicates, the exhibit range of measured parameters can be determined. Thus a table similar to that used with Elastigraph could be created to help with quality evaluation of bread.
− Similarly as mentioned above, the typical range of properties for technological failure could be determined as well.
− Comparison of results of sensory analysis to deformation values and relative elasticity of developed method could be interesting as well. The aim is finding relationship between subjective and objective attributes.
− Texture of bread crumb is strongly influenced by porosity. I suggest detailed analysis of relationship between rheological properties and porosity. Determining porosity by image analysis could be a potential solution.
− The developed method together with image analysis may enable the complex description of bread crumb texture. Based on this an evaluation process could be worked out which would have interest both for quality assurance and product development purposes.
7. PRESENTATIONS AND PUBLICATIONS PUBLISHED IN THE SUBJECT OF DISSERTATION
Reviewed articles published in international literature
− Lambert-Meretei., E. Szendrei, M. Nogula-Nagy, A. Fekete. (2010):Methods to Evaluate the Effects of Bread Improver additive on bread Crumb Texture Propreties, Acta Alimentaria v.39 (2) pp. 169-180
International conference publications (full paper)
− Meretei, A. Fekete, R. Schaefer, R. Scherer (2002): Rheological Properties of Bread, paper no.: 026142, ASAE Annual International Meeting / CIGR XVth World Congress, Chicago, Illinois, USA, 28-31 July 2002, ((elibrary.asabe.org))
− Meretei, A. Fekete, G. Gallasz (2003): Hardness and Elasticity of Bread Crumb, paper no.: 036048, ASAE Annual International Meeting, Las Vegas, Nevada, USA, 27- 30 July 2003 (elibrary.asabe.org)
− A.Meretei., E. Szendrei, A. Fekete. (2004): Prediction of bread crumb texture quality.
Proc. of 9th International Congress of Engineering and Food, Montpellier, Papers on CD.
− Fekete, A. Meretei, M. Nagy (2004): Rheological Evaluation of Bread Crumb Quality, paper no.: 046037, ASAE/CSAE Annual International Meeting, Ottawa, Ontario, Canada, 1-4 August 2004 (elibrary.asabe.org)
− M. Nagy, A. Fekete, A. Meretei. (2005.) Measurement and evaluation method for the characterization of bread crumb quality. Proceeding of Research and Teaching of Physics in the Context of University Education, Nitra pp. 217-220
− M. Nagy, R. Scherer, A. Fekete, A. Meretei, R. Schaefer (2006): Analysis of Firmness of Bakery Products, AgEng 2006 Conference, Enigneering the Future, Bonn, Germany, Papers on CD
− M. Nagy, A. Meretei, A. Fekete (2007): Bread Type Characterization by Rheological and Mechanical Properties, paper no.: 0760182007 ASABE Annual International Meeting, Technical Papers Volume 11 BOOK, 2007, 10p , (elibrary.asabe.org)
− Z. Kovacs, A. Lambert-Meretei, A. Fekete, (2009): Influence of post-baking cooling on texture properties and taste of fresh bread. Synergy and Technical Development (Synergy2009) Gödöllő, Hungary, 30. August – 02. September 2009, Papers on CD International conference publications (abstract)
− A. Fekete, A. Meretei, M. Nagy (2004): Rheological and Quality Characteristics of Bread Crumb, AgEng 2004 Conference, Enigneering the Future, Leuven, Belgium, 12-16 September 2004, pp.1020-1021
Conference publications in Hungarian (full paper)
− Meretei A.: (2001) Sütőipari termékek fizikai tulajdonságainak változása. MTA Agrártudományok Osztálya, Agrár-Műszaki Bizottság Kutatási és Fejlesztési Tanácskozás Nr.25 Gödöllő, pp.229-233
− Meretei A., Fekete A. és Scherer, R.: (2002) Kenyér bélszerkezetének értékelése kompressziós vizsgálatokkal, MTA Agrártudományok Osztálya, Agrár-Műszaki Bizottság Kutatási és Fejlesztési Tanácskozás Nr.26 Gödöllő 2. kötet pp. 130-134
− Meretei A. Gallasz, G.: (2003) Kenyérbélzet keménysége és rugalmassága. MTA Agrártudományok Osztálya, Agrár-Műszaki Bizottság Kutatási és Fejlesztési Tanácskozás Nr.27 Gödöllő, pp. 92-96
− Meretei A., Szendrei É., Nagy M., Fekete A. (2004.) Adalékanyagok hatása a kenyérbélzet fizikai tulajdonságaira. MTA-AMB Kutatási és Fejlesztési Tanácskozás kiadványa, Gödöllő. Nr. 28. pp.163-167.
− Nagy M., Meretei A. Fekete A. (2007): Módszer kenyértípusok jellemzésére. MTA Agrártudományok Osztálya, Agrár-Műszaki Bizottság Kutatási és Fejlesztési Tanácskozás Nr.31. Gödöllő, pp. 89-93
− Nagy M., Gillay Z., Firtha F., Baranyai L., Meretei A., Lukinac J., Fekete A. (2008):
Kenyérbél porozitásának meghatározása látórendszerrel MTA-AMB Kutatási és Fejlesztési Tanácskozás kiadványa, Gödöllő pp. 109-113
Conference publications in Hungarian (abstract)
− Meretei A.: (2001) Sütőipari termékek fizikai tulajdonságainak vizsgálata. XXV.
OTDK, 2001 Sopron Élelmiszertudományi „A” szekció p. 103
− Meretei Anikó- Gustav Gallasz (2003): Módszer kenyérbélzet vizsgálatára. Lippay János – Ormos Imre – Vas Károly Tudományos Ülésszak pp. 230-231
− E/47 Nagy M., Fekete A., Meretei A. (2005): Kenyérbélzet reológiai jellemzői. Lippay János – Ormos Imre – Vas Károly Tudományos Ülésszak, Vas Károly szekciók- Élelmiszertudomány pp.270-271.
− Nagy M., Meretei A., Fekete A. (2007): Módszer sütőipari termékek porozitásának meghatározására, Lippay János – Ormos Imre – Vas Károly Tudományos Ülésszak, Műveletek és Méréstechnikai Szekció, pp. 234-235
− Lambertné Meretei A., Kovács Z., Fekete A. (2009): A készárukezelés hatása a friss kenyér állományára és ízére. MBFT XXIII. Kongresszusa, Pécs, 2009. augusztus 23- 26.
− Lambertné Meretei Anikó, Csima György, Fekete András (2009): Módszer kenyérbélzet reológiai jellemzésére. Lippay János – Ormos Imre – Vas Károly Tudományos Ülésszak, Budapest, 2009. október 28-30, Műszaki, Műveletek és Méréstechnika szekció, p206.
ACKNOWLEDGEMENT
I would like to take this opportunity to thank to my supervisors to Prof. András Fekete and Dr. László Baranyai, and to my head of department Prof. József Felföldi for their skillful
guidance, professional help, valuable advices and patience.
I am deeply grateful to Prof. Lajos Szalai for his practical help and inspiration.
Special thanks to dr. Viktória Zsom-Muha, Zoltán Kovács, György Csima and Dániel Szöllősi, for all their support and for the friendly atmosphere they created.
I would like to say thank you to all my colleagues and my educators at the Physics and Control Department, for their constructive critics and for sharing their ideas with me.
They have all made it possible for me to complete this work.
Finally, I would like to thank my family for patiently taking me trough this task.
I couldn’t have done it without them.