Mechanical Behavior of Multiple-forged Al 7075 Aluminum Alloy
Tareg S. Ben Naser, György Krallics
Dept. of Materials Science and Engineering, Budapest University of Technology and Economics, Bertalan Lajos út 7, H-1111 Budapest, Hungary
taregnaser@ eik.bme.hu, krallics@eik.bme.hu
Abstract: The mechanical behavior of any material can be described using several tests, such as, compression tensile, hardness test, etc. In this work, cold and hot compression tests and hardness measurements were utilized. The subject material of this study was the Al 7075 alloy in the initial state (IS) and the multiple forged (MF) state. The cold compression test at room temperature was used to measure the deformation anisotropy on the MF specimen, while the hot compression test results were used as a source data in order to establish the constitutive equation in the wide ranges of working temperature (from 250 to 450°C) and strain rate (from 0.002 to 2 s-1). The homogeneity and structure of the material were evaluated using the Vickers hardness measurements and optical microscopy images.
Keywords: 7075 aluminium alloy; multiple forging; constitutive equations; hot compression test, cold compression test
1 Introduction
The Al 7075 alloy is a very interesting material because of its mechanical properties, namely, low density, high strength, moderate ductility and toughness.
Due to these properties, the alloy is mainly used for highly stressed structural parts. This material has a wide range of applications such as aircraft fittings, gears and shafts, fuse parts, meter shafts and gears, missile parts, regulating valve parts, worm gears, keys and various other parts of commercial aircrafts and aerospace vehicles [1].
Multiple forging (MF) is one of the severe plastic deformation (SPD) techniques [2-4], which is used to refine the grain size down to nanostructure range. The principle of this technique is to perform multiple repeats of open-die forging operations, while changing the axis of the load by 90° at each pass. The strain magnitude in one pass of multiple forging is around 0.6; three passes of MF can push the accumulated strain to a high level. For instance, the strain magnitude
during the first pass of equal channel angular press (ECAP) is around 1, and this is where the grain refinement occurs. The MF technique provides less homogeneity compared to other SPD techniques, however, it produces larger specimen dimension. The grain refinement has high effect on several material properties such as strength, fatigue and superplasticity [5].
In order to measure the mechanical behavior of the MF Al7075, some basic tests were performed, including the cold compression test, the hot compression test and the hardness test.
The hot compression test is usually performed to produce a data that can be used as a source to determine the constitutive equation constants [5-9]. The constitutive model for hot deformation proposed by Sellars and McTegart [10] is one of the most widely used for summarizing and extrapolating experimental data:
̇ ( ) ( ) (1)
̇ ( ) ( ) (2)
From the equations, ̇ is the strain rate s-1, σ is the true stress (MPa), Q is the activation energy of deformation, R is the gas constant and T is the absolute temperature of deformation (K). Q, A, β, n, and α are material parameters.
Nowadays, finite element methods (FEM) are most widely used in engineering applications such as the simulation of metal forming in order to define the optimum values of the deformation parameters. The constitutive equation, which represents the flow behavior of the materials, is used as an input variable to the FEM application to simulate the material’s response under certain loading conditions [5]. The accuracy of FEM simulation has relatively high dependency on the accuracy of prediction of the constitutive equation. In these equations, Eq. 1 and Eq. 2, the flow stress depends on the working temperature and the strain rate, and also on the material which constants considered as a function of equivalent strain [5, 9, 11-13]. In this study, the two constitutive models (Eq. 1 and Eq. 2) were compared in terms of the prediction of the hot flow behavior of the considered alloy. The present work results were compared with the results of our previous work [14], where we investigated only IS material using Eq. 2.
Materials usually gain anisotropy behavior after severe plastic deformation, which might differ from one another according to the axis of deformation [15]. In our case the material was deformed in three axes, therefore it was interesting to see the effect of the MF on the deformation anisotropy on all the axes of deformation.
2 Materials and Experiments
2.1 Test Material
The material was produced at SWA (Southwest Aluminum (group)) Co. Ltd. The chemical composition is listed in Table 1.
Table 1
Material Si Fe Cu Mn Mg CR Zn Ti Al
WT% 0.12 0.37 1.76 0.06 2.66 0.23 5.66 0.02 balance The IS material was received as a rod, 40 mm in diameter and 3m in length. By IS we mean the material in the initial state of our work, which was received as a cylindrical rod; this shape was produced by extrusion at SWA Co. Ltd. The received rod was annealed at 450° C for 30 minutes, and then it was cooled to room temperature in a furnace in order to allow the precipitation process to complete. This results in a low cooling rate, which ensures a stable base material for further tests.
Figure 1
MF operation steps (specimen dimensions are D= 40 mm, H= 74 mm)
2.2 Multiple Forging
Fig. 1 shows the MF operation steps, which consist of performing a multi-repeat of open die forging operations, whereby the axis load is changed by 90o in each pass. Some parameters have to be determined before performing the MF process.
One of the most important parameters is the forming temperature, since it has significant effect on forming ultrafine grain structure. The ultrafine grain structure
development requires lower working temperatures than those commonly used in conventional manufacturing of semi-finished products [9]. In order to determine the forming temperature, several trial and error tests were conducted; the results have shown that the lowest temperature which can be applied for all process steps without any undesirable behavior was 250 °C. The diameter-to-height ratio is another parameter that has to be taken into consideration. According to the experimental result it was found that 0.54 (D/H) is a suitable ratio. Thus, the specimens for the MF experiments were cut to a diameter of 40mm and a height of 74 mm, as can be seen in Fig. 1. The process was performed using a hydraulic press machine with a maximum force of 200 tons, at constant cross head speed (5 mm/min).
2.3 Cold Compression Test
Some specimens were subjected to the cold compression test at room temperature and constant cross head speed; the compression tests were performed only for MF materials. The specimens were subjected to this test to investigate the anisotropy behavior by measuring the flow stress curve at room temperature, and by measuring two perpendicular diameters on the specimen’s cross section. The IS material wasn't interesting for this test because it didn't show any notable deformation anisotropy.
2.4 Hot Compression Test
The compression test specimens were machined to have cylindrical shape with 7 mm diameter and 8.4 mm height. Isothermal compression tests at constant strain rates and constant temperatures were conducted. The maximum compression equivalent strain of 0.55 was achieved in the test. Before beginning the test, the specimens were held in the die for some minutes to allow the material to reach steady state. The temperature was measured using thermocouples. Carbon powder was used as a lubricant to decrease the effect of friction and barreling. The deformation temperature and strain rate were automatically controlled by the machine control unit. The experimental temperatures were between 250 and 450°C with an interval of 50°C. At each deformation temperature four constant strain rates were applied (0.002, 0.02, 0.2 and 2 s-1). All compression tests were carried out using an Instron 5982 electromechanical universal material testing equipment with a maximum load of 100 kN with high a temperature furnace.
2.5 Hardness Measurements
Vickers hardness measurements (HV5) were used to evaluate the structure homogeneity and the influence of the MF on the surface hardness of the material.
The main load during the test was 5 kg.
2.6 Metallographic Work
Some samples were prepared to monitor the structure, starting with IS material and MF steps. The samples were cut from the original specimen by handsaw, were subsequently grinded in several steps, and the mechanical preparation was finished by polishing with aluminum powder. Immediately before the start of the optical microscope investigation, electro-polishing was done for all samples with different polishing parameters; the aching liquid was 700 ml ethyl alcohol, 120 ml distilled water, 78 ml perchloric acid 70% and 100 ml butylglycol; the used voltage was 30 V for 10 sec.
3 Results and Discussion
The discussion of the results will cover four points as following:
1. Compression test 2. Constitutive equation 3. Hardness measurements
4. Optical microscopic investigation
3.1 Compression Test
The force-height data was used to define the true stress-true strain curves using some basic equations as given by Eq. 3, Eq. 4, and Eq. 5:
( ) (3)
(4)
(Volume constancy) (5)
where is the equivalent strain, ho is the initial height (mm), h is the current height (mm), σ is the flow stress (MPa), F is the force (N), A is the current area cross section (mm2) and Ao is the initial area of the cross section (mm2).
3.1.1 Cold Compression Test
The step-by-step compression tests were carried out in the three axes, namely, X, Y and Z of MF material, as illustrated in Fig. 2. In all axes, the anisotropy phenomenon appears where the cross section is changed from cylindrical to elliptical shape. Using the following equations: Eq. 6, Eq. 7, the compressive and tensile strains were calculated:
( ) (6)
( ) (7)
( ) (8)
(9)
Figure 2
A: the flow curves in the three axes. B, C and D are the logarithmic ratio between initial diameter and ellipse axes on X, Y and Z axes respectively as scatter points and the line for isotropy material At the free surfaces of the compressed cylindrical test specimens, the strains consist of two types of strain: tension strain at the circumference and axial compression strain. Because the final cross-sectional area of the deformed specimens is elliptical, there are two values for tensile strain in the direction of the diameter: a and b. That means ε1 is a compression strain and εa εb is a tensile strain. The strain components were calculated using Eq. 7 and Eq. 8, and the results also satisfied the equation 9.
According to the experimental results, the Y axis has the highest deformation anisotropy compared to the other axes because it is the direction of forward extrusion for the IS material rod. Fig. 2 shows the deformation anisotropy on all axes of deformation. All flow curves along the various axes are close to each other.
3.1.2 Hot Compression Test
In Fig. 4, the flow curves of the IS material are drawn as scatter points, which were obtained from the hot compression tests at various working temperatures (250, 300, 350, 400 and 450 °C) and different strain rates (0.002, 0.02, 0.2 and 2 s-1). At strain rates of 0.002-0.02 s-1 and working temperatures of 350, 400 and 450 °C, the flow curve has almost no influence from equivalent strain, especially when the strain rate was 0.02 s-1. Strain softening behavior was observed in the IS material at working temperatures of 300, 350, 400 and 450 °C and strain rates of 0.2 and 2 s-1. In contrast, the IS material at working temperature of 250 °C and strain rates of 0.002, 0.02 and 0.2 s-1 has shown a clear strain hardening behavior.
In Fig. 6, the flow curve of the MF material is shown as scatter points, which were obtained from a hot compression test under the following working temperatures:
250, 300, 350, 400 and 450°C and the following strain rates: 0.002, 0.02, 0.2 and 2 s-1. The flow curves of the MF behave in the same manner as the flow curves of the IS material under the same experimental conditions; however, there were slight differences in the behavior where the strain softening is more visible in the MF specimens at the highest strain rate.
The effects of the anisotropic deformation in hot compression test were negligible compared to the cold forming result.
The results obtained from the hot compression tests under different strain rates and working temperatures were used to determine the material parameters of the constitutive equations.
3.2 Constitutive Equation
The stress-strain data obtained from the hot compression tests under different strain rates and working temperatures were used to determine the material parameters of the constitutive equations for the IS and MF material. In the present work, two results are presented:
1. Constitutive equation using sin hyperbolic function for IS material 2. Constitutive equation using exponential function for MF material
The results for the IS material using the exponential equation can be found in [14].
The sin hyperbolic function was used for the MF material; however, the result of approximation wasn’t good. Although the verification of the parameters was good, the flow curve using this constitutive equation has a zigzag shape.
The sin hyperbolic constitutive equation that was derived by Sellars and McTegart [10] was used to describe the plastic deformation behavior of the IS material; see Eq. 1. Thus, the flow stress can be expressed as follows:
( (( ( ( ̇) ( )) )
))
(10) The exponential constitutive equation that was derived by Sellars and McTegart, Eq.2 [10], was used for the MF material; the flow stress was expressed as shown in Eq.11:
̇ (11)
where ̇ is the strain rate (s-1), σ is the true stress (MPa), Q is the activation energy of deformation, R is the gas constant and T is the absolute deformation temperature (K). Q, A, β, n, and α are the material parameters. All material parameters have been obtained by solving the equations as an over-determined problem, where we have a higher number of equations than the number of the unknown parameters. The obtained parameters were plotted with equivalent strain between 0.05 and 0.55 with an interval 0.05. A fourth-order polynomial function was applied to describe the relationship between the parameters and equivalent strain, to fit to the series of obtained data. 3.2.1 Initial State Material ( ) (12)
(13)
(14)
(15) The R square value of the fitting of polynomial equations for lnA, Q, n, and α were 0.999, 0.997, 0.999 and 0.989 respectively. These values indicate good fitting. The observation from Fig. 3 is that lnA, Q and n increase with the equivalent strain; also, they are independent of changes in the working temperature and the strain rate at fixed strain. In contrast, α values decrease with the equivalent strain. The parameter lnA was between 13.46 and 25.49, Q was between 120554 and 170336 J/mol, n was varying from 3.067 to 6.096 and α was between 0.039 and 0.01994. Equations 10, 12, 13, 14 and 15 are the constitutive equations for the IS material.
Figure 3
The values of IS material parameters lnA, Q, n, and α obtained for different strain levels and the fitted curves using fourth-order polynomial
Figure 4
Measured IS material flow curves (scatter) and calculated flow curves (solid lines) 3.2.2 MF Material
( ) (16) (17)
(18) The R square values of the fitting of the polynomial equations for lnA, β and Q were 0.999, 0.983 and 0.997 respectively. The A, β and Q parameters are varying with equivalent strain and are independent of the working temperature and the strain rate at a fixed strain. The obtained parameter values are: lnA from 12.4 to 20.61, β from 0.1099 to 0.1437, and Q between 119.9 and 173.1 kJ/mol. All of these parameters tend to increase with equivalent strain (Fig. 5). Eq. 11, 16, 17 and 18 are the constitutive equations for the MF material.
Figure 5
Values of the MF material parameters, lnA, Q, and β, which were obtained for different strain levels and the fitted curves
In order to verify the constitutive equations for the IS and MF materials, stress- strain curves were calculated using the constitutive equations at the same working temperatures and strain rates that were used in the experiments. The measured true stress as scatter points and the calculated true stress as solid lines are plotted in Fig. 4 and 6, respectively.
The average absolute relative error (AARE) and correlation coefficient (R2) were calculated for all the data using Eq. 19 and Eq. 20:
∑ | | (19)
∑ ( ̅ )( ̅)
√∑ ( ̅ ) ( ̅) (20)
where n the number of data, σm measured stress and ̅ mean value of σm, σc is a calculated stress and ̅ is the mean value of σc . The verification parameter values of the present work are listed in Table 2.
Figure 6
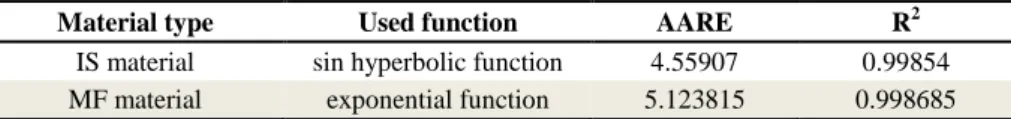
The measured and calculated flow curves of the MF material Table 2
Verification parameter values
Material type Used function AARE R2
IS material sin hyperbolic function 4.55907 0.99854 MF material exponential function 5.123815 0.998685 The results in Table 2 show the reliability of the equations in predicting the behavior of the experimental material.
Table 3 shows the comparison between the verification parameters for the two applied constitutive functions. The value of AARE and R2 parameters shows the better prediction capabilities of the sin hyperbolic function compared to the exponential function.
Table 3
Comparison of the verification parameters for the two used functions
Material type Used function AARE R2
IS material sin hyperbolic function 4.55907 0.99854 IS material exponential function 6.194949 0.998621 MF material exponential function 5.123815 0.998685 The flow curves at hot compression turn out very similar to those of the IS and MF samples. In the attempt to understand the process and find an explanation for such interesting results, we shared our hot compression measurements with the dynamic recrystallization study group, and they stated the following:
The reason for this result was attributed to the stored energy, which is higher in the MF material compared to the IS, therefore the dynamic recrystallization occurs at a lower stress level in the case of MF [16].
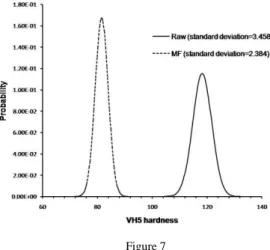
3.3 Hardness Measurements
Fig. 7 plots the histogram of the HV5 hardness measured on the IS and MF material specimens. The number of measurements on each specimen was 30, distributed randomly on the surface of specimens. The distribution of the hardness for both the IS and MF materials conforms to a normal distribution with different mean and standard deviations. The mean hardness value of the IS material was HV 118.25, whereas that of the MF material was HV 81.6; we attribute these unexpected hardness results for the MF material to the effects of warm deformation during the MF process. The standard deviation of the hardness measurements for the MF material was less than that for the IS material, which can be clearly seen from the width of the normal distribution of the histogram.
These results show an improvement in the structural homogeneity.
Figure 7
The normal distribution of hardness measurements
3.4 Optical Microscopic Investigation
Some specimens were prepared for micrographic investigations. The preparation involves mechanical grinding and polishing followed by electro polishing. The optical microscope photos show a microstructure change during the MF processes, where the second-phase particle size at the third pass of MF was decreased, compared to the IS material, as is illustrated in Fig. 8.
Figure 8
(a) IS material; (b) MF first pass; (c) MF second pass; (d) MF third pass Summary
A set of constitutive equations was obtained for the IS material, where the flow stress depends on temperature and strain rate according to a sin hyperbolic function. The material parameters, A, Q, n and α are considered as functions of equivalent strain.
A set of constitutive equations was obtained for the MF material, where the flow stress depends on the temperature and strain rate according to an exponential function. The material parameters, lnA, β and Q are considered functions of equivalent strain.
The constitutive equations were found to predict flow stress precisely over a wide range of working temperatures and strain rates, where the overall AARE and the correlation coefficient R2 , were good for both the IS and MF materials.
Comparing the present IS material result of sin hyperbolic constitutive equation with our previous results [14], it can be stated that the sin hyperbolic function is more reliable than the exponential function to predict the experimental behavior of the material.
The deformation anisotropy has significant effect during cold deformation, while it has negligible effect during hot deformation.
Acknowledgement
This research was carried out as part of the TAMOP-4.2.1.B-10/2/KONV-2010- 0001 project with the support of the European Union, co-financed by the European Social Fund.
References
[1] George E. Totten, D. ScottMacKenzie. Handbook of aluminum Vol. 1 Physical Metallurgy and Processes (2003) 185
[2] Oleg Sitdikov, Taku Sakai, Alexandre Goloborodko, Hiromi Miura and Rustam Kaibyshev, Effect of Pass Strain on Grain Refinement in 7475 Al Alloy during Hot Multidirectional Forging. Materials Transactions, 2004, Vol. 45 (2232-2238)
[3] Zhang Hui, Lin Gao-yong, Peng Da-shu, Yang Li-bin, Lin Q-quan.
Manufacturing of Aluminum Alloy Ultra-Thick Plates by Multidirectional Forging and Subsequent Rolling. Trans. Nonferrous Met. Soc. China. 2002, Vol. 12 (218-221)
[4] T. Sakai, H. Miura, X. Yang. Ultrafine Grain Formation in Face-centered Cubic Metals during Severe Plastic Deformation. Materials Science and Engineering A, 499 (2009) 2-6
[5] D. Samantaray, S. Mandal, A. K. Bhaduri. Constitutive Analysis to Predict High-Temperature Flow Stress in Modified 9Cr–1Mo (P91) Steel, Materials and Design, 2010, Vols. 31 (981-984)
[6] Juan Liu, Zhenshan Cui, Congxing Li, Modelling of Flow Stress Characterizing Dynamic Recrystallization for Magnesium Alloy AZ31B, Computational Materials Science, 2008, Vols. 41 375-382
[7] P. Ponge, M. Bredehöft, G. Gottstein, Dynamic Recrystallization in High Purity Aluminium, ScriptaMaterialia. Vol. 37 (1997) 1769-1775
[8] Quan Guo-zheng, Liu Ke-wei, Zhou Jie, Chen Bin, Dynamic Softening Behaviors of 7075 Aluminum Alloy, Trans. Nonferrous Met. Soc. China, 2009, Vols. 19 (s537-s541)
[9] Z. Zeng, S. Jonsson, Y. Zhang, Constitutive Equations for Pure Titanium at Elevated Temperatures, Materials Science and Engineering A. 505 (2009) 116-119
[10] C. M. Sellars, W. J. McTegart. On the Mechanism of Hot Deformation.
Acta Metallurgica, Volume 14, Issue 9, September 1966, pp. 1136-1138 [11] Y. C. Lin, Ming-Song Chen, JueZhong. Effect of Temperature and Strain
Rate on the Compressive Deformation Behavior of 42CrMo Steel. Journal of Materials Processing Technology Vol. 205 (2008) 308-315
[12] Woei-Shyan Lee, Ming-Tong Lin. The Effects of Strain Rate and Temperature on the Compressive Deformation Behavior of Ti-6A1-4V Alloy. Journal of Materials Processing Technology Vol. 71 (1997) 235-246 [13] Jun Cai, Fuguo Li, Taiying Liu, Bo Chen, Min He. Constitutive Equations
for Elevated Temperature Flow Stress of Ti–6Al–4V Alloy considering the Effect of Strain. Materials and Design Vol. 32 (2011) 1144-1151
[14] Tareg S. Ben Naser, György Krállics, The Constitutive Behavior of Al 7075 Aluminium Alloy under Hot Compression Test, Materials Science Forum, Vol. 752 (2013) 69-74
[15] Ahmed S. M. Agena, A Study of Flow Characteristics of Nanostructured Al-6082 Alloy Produced by ECAP under Upsetting Test, Journal of Materials Processing Technology, 209 (2009) 856-863
[16] Támas Mikó, Peter Barkóczy, Determination of the Onset of the Dynamic Recrystallization of a 7075 Al Alloy, Material Science Fourm, 752 (2013) 105-114