RESEARCH ARTICLE
Bacterial and abiogenic carbonates formed in caves–no vital effect on clumped isotope
compositions
Attila Deme´nyID1*, La´szlo´ Rinyu2, Pe´ter Ne´meth3,4, Gyo¨ rgy Czuppon1, No´ ra Enyedi5, Judit Makk5, Szabolcs Lee´l-O˝ ssy6, Do´ ra Kesja´r2, Ivett Kova´cs1
1 Institute for Geological and Geochemical Research, Research Centre for Astronomy and Earth
Sciences, Budapest, Hungary, 2 Isotope Climatology and Environmental Research Centre (ICER), Institute for Nuclear Research, Debrecen, Hungary, 3 Institute of Materials and Environmental Chemistry, Research Centre for Natural Sciences, Budapest, Hungary, 4 Department of Earth and Environmental Sciences, University of Pannonia, Veszpre´ m, Hungary, 5 Department of Microbiology, Eo¨tvo¨s Lora´nd University, Budapest, Hungary, 6 Department of Physical and Applied Geology, Eo¨tvo¨s Lora´nd University, Budapest, Hungary
*demeny@geochem.hu
Abstract
Speleothems (dominated by cave-hosted carbonate deposits) are valuable archives of paleoclimate conditions. As such, they are potential targets of clumped isotope analyses that may yield quantified data about past temperature variations. Clumped isotope analyses of stalagmites, however, seldom provide useful temperature values due to various isotope fractionation processes. This study focuses on the determination of the microbially induced vital effect, i.e., the isotope fractionation processes related to bacterial carbonate produc- tion. A cave site with biologically mediated amorphous calcium carbonate precitation was selected as a natural laboratory. Calcite deposits were farmed under a UV lamp to prevent bacterial activity, as well as under control conditions. Microbiological analyses and morpho- logical investigations using scanning electron microscopy showed that the UV lamp treat- ment effectively reduced the number of bacterial cells, and that bacterial carbonate
production strongly influenced the carbonate’s morphology. Stable oxygen isotope analyses of calcite and drip waters, as well as clumped isotope measurements revealed that,
although most of the studied carbonates formed close to oxygen isotope equilibrium, clumped isotopeΔ47values varied widely from equilibrium to strongly fractionated data.
Site-specific kinetic fractionations played a dominant role in the distribution ofΔ47values, whereas bacterial carbonate production did not result in a detectable clumped isotope effect.
Introduction
Speleothems are important subjects of paleoclimate research because of the possibility of pre- cise absolute age determination [1] and the wealth of environmental proxies that can be a1111111111
a1111111111 a1111111111 a1111111111 a1111111111
OPEN ACCESS
Citation: Deme´ny A, Rinyu L, Ne´meth P, Czuppon G, Enyedi N, Makk J, et al. (2021) Bacterial and abiogenic carbonates formed in caves–no vital effect on clumped isotope compositions. PLoS ONE 16(1): e0245621.https://doi.org/10.1371/
journal.pone.0245621
Editor: Andrew R. Zimmerman, University of Florida, UNITED STATES
Received: July 24, 2020 Accepted: January 4, 2021 Published: January 25, 2021
Copyright:©2021 Deme´ny et al. This is an open access article distributed under the terms of the Creative Commons Attribution License, which permits unrestricted use, distribution, and reproduction in any medium, provided the original author and source are credited.
Data Availability Statement: All relevant data are within the manuscript andSupporting information files.
Funding: The study was financially supported by the National Research, Development and Innovation Office, Hungary (FK123871 and PD 121387), the Hungarian Academy of Sciences (KEP-8/2018 to AD, and the Ja´nos Bolyai Research Scholarship to PN), and the Eo¨tvo¨s Lora´nd Research Network (KEP-1/2020 to AD). The work of No´ra Enyedi was supported by the U´ NKP-20-3-
gathered from their analyses at relatively high, sometimes even at sub-annual temporal resolu- tion [2]. Because many of the speleothems are almost pure calcium carbonates, they can be excellent targets for clumped isotope analysis, a technique that is based on preferential bond- ing of heavy carbon and oxygen isotopes in carbonate, relative to the stochastic distribution of light and heavy isotopes. Clumped isotope analysis can help to determine carbonate formation temperature [3,4]. Isotope clumping is expressed by theΔ47value, which is the relative devia- tion of the abundance of the mass 47 CO2(largely13C18O16O) molecule from the stochastic distribution.
Several empirical and experimental equations were published in the last decade, providing slightly differentΔ47-temperature relationships for biogenic carbonates [5], travertines [6], and experimental carbonates (e.g., [7–9]). Following the approach by Coplen [10], who sug- gested that the extremely slowly depositing calcite of the Devils Hole (Nevada, USA) may rep- resent true calcite-water equilibrium in a natural environment, a recent study by Dae¨ron et al.
[11] offered equations for “equilibrium” temperature dependence of clumped isotope compo- sition and calcite-water oxygen isotope fractionation, based on data gathered for the Devils Hole calcite and a similarly slowly precipitating carbonate deposit formed in the Corchia Cave (Italy). “Equilibrium” is denoted in quotation marks, as true thermodynamic equilibrium in natural carbonate formations becomes ambiguous if empirical observations and theoretical calculations are evaluated together (see theoretical calculations [12] and results for expected natural equilibrium conditions for extremely slowly depositing calcites [11]). In this paper, the term “equilibrium” will be used for the carbonates that yield carbonate-water oxygen isotope fractionation values andΔ47data approaching the isotope-temperature relationships defined by the data of extremely slowly precipitating calcites [11]. In contrast to the Devils Hole and Corchia Cave deposits [11], stalagmites, the most frequently studied speleothems, generally yieldΔ47data that significantly deviate from the “equilibrium” values, due to kinetic processes [13,14]. Flowstones, however, are similar to the travertine formations that yield close-to-“equi- librium”Δ47data [6,9]. As a result, a pilot study was begun on speleothems in the Baradla Cave (NE Hungary), where stalagmites and flowstones have been researched [15–17]. At a prelimi- nary stage of this pilot study, the flowstones yielded close-to-“equilibrium” clumped isotope compositions, while the stalagmites’Δ47data were strongly shifted to lower values. Addition- ally, it was discovered that bacterial carbonate precipitation produced amorphous calcium car- bonate in the Baradla Cave [15,18], which was preserved by a covering of an extracellular polymeric substance (lipids, proteins, carbohydrates, and nucleic acids, [18]). This observation raised the question of whether microbial carbonate production exerted a vital effect on clumped isotope compositions, or whether the low stalagmiteΔ47values were attributed solely to abiogenic isotope fractionations. The possibility of a vital effect was further supported by Thaler et al. [19], who detected lowΔ47values in microbial carbonates. They attributed the shift inΔ47values (up to –0.27‰) to ureolytic DIC (dissolved inorganic carbon) production in the bacterial cells. This mechanism can be expected in the bacteria thriving in the Baradla Cave, where heterotrophic bacterial strains that precipitate carbonate through ureolysis were identified [18]. The amount of microbial carbonate is estimated to be 10–50% from textural observations and Fourier Transform Infrared Spectroscopy (FTIR) [15,19]. Combining the amount of microbial carbonate and the potential isotope fractionation would suggest an expectedΔ47shift of about 0.03–0.1‰, which is above the current analytical precision. To test whether bacterial carbonate production affects the clumped isotope composition of the precip- itating carbonate, the Baradla Cave was used as a natural laboratory, where carbonate samples were deposited and collected at one site illuminated by a UV lamp and at a control site that was not treated. The research sites were selected based on previous monitoring activity [15,20]. The carbonate was deposited on glass plates and underwent microbiological analysis,
II-ELTE-260 New National Excellence Program of the Ministry for Innovation and Technology from the source of the National Research, Development and Innovation Fund. The clumped isotope facility of the Institute for Nuclear Research was funded by the European Union and the State of Hungary, as well as co-financed by the European Regional Development Fund in the project of GINOP-2.3.2- 15-2016-00009 ‘ICER’. The funders had no role in study design, data collection and analysis, decision to publish, or preparation of the manuscript.
Competing interests: The authors have declared that no competing interests exist.
scanning electron microscopy (SEM), Fourier Transform Infrared Spectroscopy (FTIR), micro-X-Ray diffraction (micro-XRD), laser spectroscopy for stable oxygen isotope composi- tions of drip waters, and stable isotope mass spectrometry for stable carbon, oxygen, and clumped isotope compositions of carbonates.
Samples and analytical methods
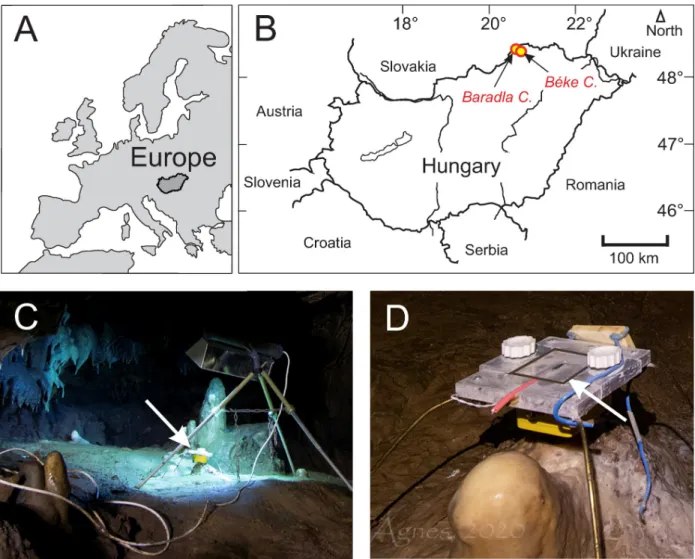
Monitoring activities and speleothem sampling were permitted officially by the Environment Protection Department, Miskolc District Office, Borsod-Abau´j-Zemple´n County Government Office (permission No. BO-08/KT/4463-4/2017Miskolc). The activities were supervised by the Aggtelek National Park. The samples for the clumped isotope analyses consisted of the top- most surfaces of stalagmites from the Nehe´zu´t (NU) site and the surrounding area (Vaskapu, VK, about 100 m away) within the Baradla Cave, as well as two samples from the youngest part of a flowstone formation in the Be´ke Cave (seeFig 1for locations). The stalagmites are described in detail by an earlier study [16].They represent compact stalagmites (NU-2 and VK-1) forming at a rate of about 0.3 mm year–1and porous, more rapidly depositing (about
Fig 1. A) and B) Locations of the Baradla and Be´ke Caves. C) Sampling site illuminated with a UV-lamp. Arrow marks the position of glass plate holder. D) Glass plate holder under dripping water. Glass plate is contoured with a black line and marked by an arrow. Photos by A´ gnes Berente´s.
https://doi.org/10.1371/journal.pone.0245621.g001
0.7 to 0.9 mm year–1) stalagmites (NU-1 and VK-2) [16]. The relatively high deposition rates, compared to the ~0.01 mm year–1rate observed for stalagmites collected in the same cave [21], may be related to the stable drip water supply and to the nearly continuous dripping, which were important considerations when selecting the monitoring and stalagmite collection site [15,16]. The flowstone occurrence (drill core BNT-2) is approximately 5 km away from the Baradla Cave and has been extensively monitored [20] and geochemically analyzed [17]. Addi- tionally, the carbonate produced by cultivated bacteria (Rhodococcus degradansstrain BaTD- 248 [18]) was treated with 5% NaClO solution to remove the agar medium used for cultivation.
The treatment was conducted at room temperature in nitrogen atmosphere (to avoid artificial carbonate precipitation from air CO2) for one day, after which the sample was washed 10 times in distilled water and dried overnight at 40˚C.
Glass plates were abraded on the collection side using F1000 grade silicon carbide (SiC) powder and were placed under dripping water at two sites (Fig 1) approximately 50 m away from each other at the Nehe´zu´t of the Baradla Cave [16]. The cave was monitored for two years [16,20] close to the carbonate farming sites, measuring local physico-chemical parame- ters (temperature, conductivity, pH, CO2content) and drip water H and O isotope composi- tions, indicating that the site is stable and characterized by slight seasonal fluctuations, and no significant human influences on physico-chemical conditions. The temperature and CO2con- centration in the air of the cave show weak seasonalities (fluctuating between 10 and 10.5˚C, and 2000 and 4000 ppm, respectively). In the current study, flying lead thermistor probes (Gemini Data Loggers Ltd.) were placed directly under the glass plates, and the temperature was continuously recorded by Tinytag Plus 2—TGP-4020 loggers manufactured by Gemini Data Loggers Ltd. The glass plates were situated on December 19, 2019 and were harvested and replaced on January 13, February 20, March 19, and May 29 in 2020. The glass plates were transported in a cooler box and stored in a refrigerator until analyses to avoid crystallization of amorphous calcium carbonate, if present. One site was illuminated using a double-ended UVC (germicidal) lamp emmitting light at 253.7 nm wavelengths, while the control site was left untreated. The lamp was repeatedly moved and placed in the former control site during sample collection to avoid site-specific bias.
To detect the germicidal effect of the UV lamp, two cultivation techniques were used to esti- mate and compare the number of viable microbes from the UV-treated and untreated habitats at all three sampling times. For indirect germ count estimation, a sterile cotton swab moist- ened with a sterile 0.9% (w/v) NaCl solution (pH 7.0) was vigorously scrubbed on the surface of the selected sample holder (approximately a 2 x 2.5 cm area) and immediately placed in a sterile tube containing 6 mL of sterile NaCl solution for transport to the laboratory. Contact TSA (DSMZ medium 535) plates were used for direct detection of viable microbes. The agar surface of the contact plate was pressed to the sample holders. Contact plates and samples col- lected in physiological saline were transported in a refrigerated container to the laboratory.
For the latter sample, 10-fold dilution series were made using 4.5 ml of distilled water, and 0.2 ml of each dilution was plated onto R2A (DSMZ Medium 830) on the day of sampling. Sam- ples from the original samples were also applied to the surface of the agar media in the form of droplets (200μl-200μl), without dilution. All plates were incubated at 20˚C for 24 h, 48 h, and 1 week, before counting the number of colonies of culturable (untreated samples) and surviv- ing (UV-treated samples) microbes. The results are expressed as colony forming units/cm2 (CFU).
Pieces of glass plates were broken, and their surfaces were coated with Au for scanning elec- tron microscopy. The samples were analyzed using a Zeiss EVO 40 scanning electron micro- scope operated at 10 and 5 kV.
Scraped carbonate powder samples were analyzed by FTIR and micro-XRD at the Institute for Geological and Geochemical Research (IGGR) Budapest. Attenuated total reflection (ATR) FTIR analyses were performed using a Bruker Vertex 70 Fourier Transform Infrared spectro- scope controlled by OPUS 8.1 software. For each sample, 16 scans were recorded in the 4000–
400 cm–1spectral range, with a resolution of 4 cm–1. Micro-XRD analysis was performed on a RIGAKU D/MAX RAPID II diffractometer, which is a unique combination of a MicroMax- 003 third generation microfocus, sealed-tube X-ray generator, and a curved imaging plate (IP) detector. The diffractometer was operated with CuKαradiation generated at 50 kV and 0.6 mA. The powdered samples for the micro-diffraction measurements were encapsulated in a borosilicate-glass capillary, with a diameter of 0.3 mm and a wall thickness of 0.01 mm, by a vertical manual charging process. Then, the capillary was analyzed by the micro-diffractometer in transmission mode, with a beam spot diameter of 100μm. For each measurement, 0.5–1 mg sample was placed in the funnel end of the capillary, and the sample was tapped into the nar- row portion. The measurement took approximately 3 to 10 mins. The IP was read by a laser scanning readout system in approximately 1 min. 2DP RIGAKU software was used to record the diffraction image from the laser readout, allowing the operator to determine the area to integrate for a 2θversus intensity plot. This plot was read into the RIGAKU PDXL 1.8 software for data interpretation.
Drip water samples were collected during the visits to the caves on January 13, February 20, March 19, and May 29 in 2020. Their stable oxygen isotope compositions were determined at the Institute for Geological and Geochemical Research using a liquid water isotope analyzer (type LWIA-24d) manufactured by Los Gatos Research Ltd. The instrument utilizes off-axis integrated cavity ring down spectroscopy to measure the absolute abundances of2H1H16O,
1H1H18O, and1H1H16O molecules via laser absorption [22]. The isotope compositions are expressed asδ18O values in ‰ relative to V-SMOW. Standardization was conducted using lab- oratory standard water samples that were calibrated to international standards [20]. Theδ18O precision is better than±0.15‰ (1SD).
Clumped isotope analysis of carbonate samples was run on a Thermo Scientific™253 Plus 10kV Isotope Ratio Mass Spectrometer (IRMS) in the Isotope Climatology and Environmental Research Center (ICER), Debrecen (Hungary). The phosphoric acid digestion of the samples was performed at 70˚C with a Thermo Scientific™Kiel IV automatic carbonate device, which is coupled to the IRMS by an inert silica coated capillary. The carbonate clumped isotope analysis system has a similar design to that described in previous publications [23–27]. Each carbonate sample measurement consisted of 10–12 replicate analyses of 100–120μg aliquots that were divided into three measurement carousels (with 46 positions) and were measured alongside carbonate standard samples with assigned values. ETH1, ETH2, and ETH3 (S1 Table inS1 Appendix) were used as standard samples during theΔ47calculation, and ETH-4 and IAEA-C2 (S1 Table inS1 Appendix) were used to monitor instrument performance. The appliedδ13C,δ18O, andΔ47values of these carbonate samples were published in Bernasconi et al. [28]. The ETH standards were used to transfer the sampleΔ47results into the absolute reference frame.
The Easotope application was used for data evaluation [29] with the CO2clumped ETH PBL replicate analyses method and the IUPAC parameters, also called the Brand parame- ters [30–34] (S2 Table inS1 Appendix). A correction factor of 0.066 (Δ�25–70) [8] was applied to correct for different acid fractionation factors at 25 and 70˚C and to represent Δ47results on the CDES25˚C scale. Further technical details of clumped isotope analyses and measurement data are provided in the Supplementary Materials (S1 Appendix,S1and S2Tables).
Results and discussions
Cultivation and cultivation-independent analyses demonstrate that the surface of dripstones is inhabited by a diverse bacterial community [18,35], but their role in the precipitation of cave carbonates remains uncertain. Although a small percentage of bacteria can be cultivated from environmental samples [36], germ count estimation methods are usually applied to detect microbial contamination on surfaces.
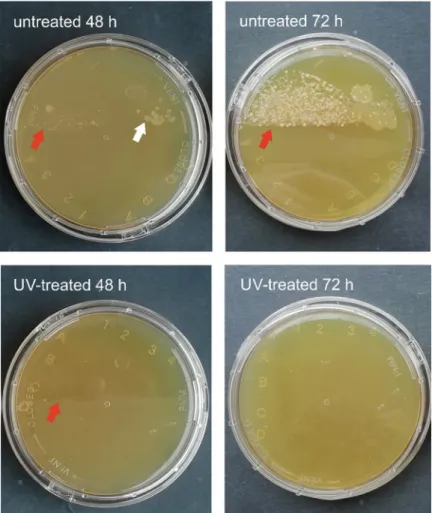
A substantial difference was noted in the number of developing colonies incubated for 48 and 72 hours. A sporadic number of colonies was cultivated on R2A and TSA contact plates from the samples scrubbed from the UV-treated habitats, and high colony counts were observed on the surfaces of the untreated sample holders (Table 1, Figs2and3). The colony counts differed depending on the length of time between samplings. The germicidal lamp pre- vented the bacterial cells in the drip water from surviving and proliferating. After one week of incubation, the number of colonies increased on the media inoculated with samples from UV- treated habitats, as well. This suggests that the vegetative forms of stress-related inactive bacte- ria (e.g., endospores) regenerated and multiplied on the more optimal, nutrient-rich medium.
Bacteria isolated from subsurface environments also contain DNA repair mechanisms, which eliminate the damage caused by UV light [37,38]. During the sampling process, bacterial cells may land on the sample holders, thus suffering a low dose of UV irradiation. These cells may regenerate on the cultivation medium and form visible colonies.
FTIR and micro-XRD analyses show that the 1–2 months old carbonate samples collected from the glass plates of the control and UV-illuminated samples are dominated by calcite.
These analyses did not detect ACC, contradicting the observation that this amorphous phase occurs in relatively fresh (1–7 days) cave carbonate precipitates [15] and on microbial colonies [18].
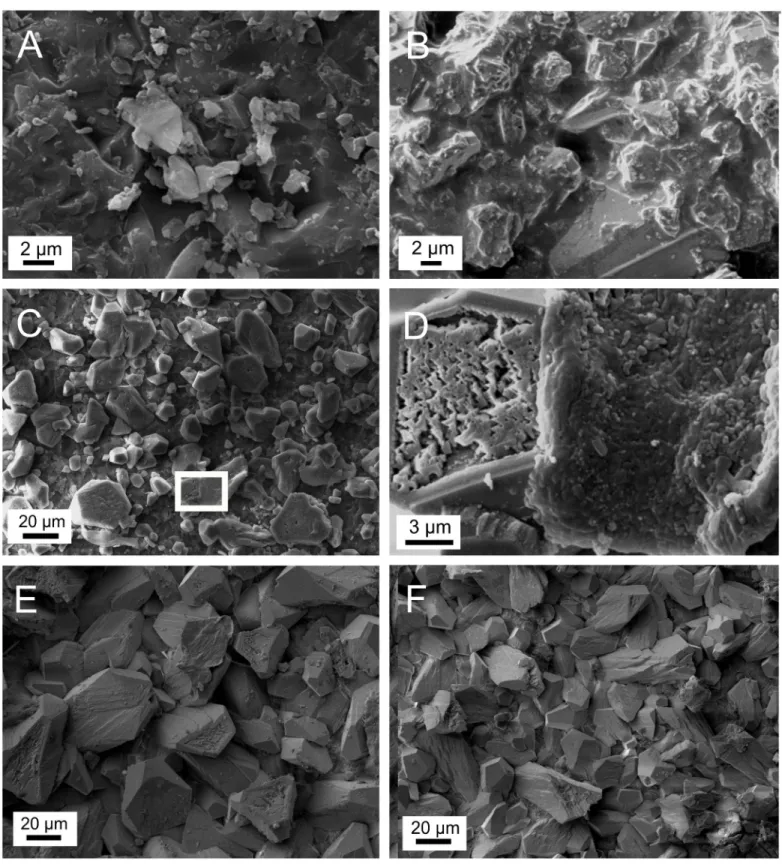
Microstructures and crystal forms of the control calcite samples farmed in January and Feb- ruary, 2020 indicate the effect of bacterial activity (Fig 4), particularly that the grain size is small (~ 1–3 micron,Fig 4A), the grains are covered by a biofilm (Fig 4B), and euhedral crys- tals are rare. In contrast, calcite particles of the UV-illuminated samples are well-crystallized,
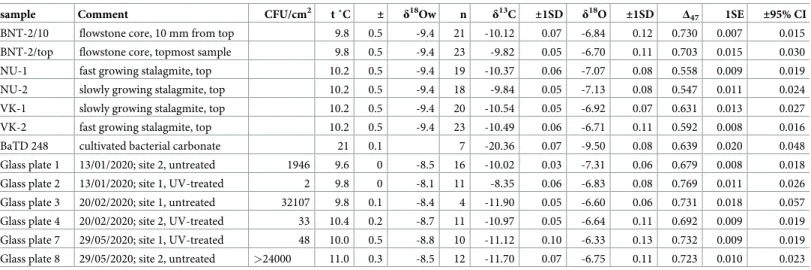
Table 1. Stable carbon and oxygen isotope compositions (in ‰ relative to V-PDB) and clumped isotope data (CDES25˚C) of the research samples in this paper.
sample Comment CFU/cm2 t ˚C ± δ18Ow n δ13C ±1SD δ18O ±1SD Δ47 1SE ±95% CI
BNT-2/10 flowstone core, 10 mm from top 9.8 0.5 -9.4 21 -10.12 0.07 -6.84 0.12 0.730 0.007 0.015
BNT-2/top flowstone core, topmost sample 9.8 0.5 -9.4 23 -9.82 0.05 -6.70 0.11 0.703 0.015 0.030
NU-1 fast growing stalagmite, top 10.2 0.5 -9.4 19 -10.37 0.06 -7.07 0.08 0.558 0.009 0.019
NU-2 slowly growing stalagmite, top 10.2 0.5 -9.4 18 -9.84 0.05 -7.13 0.08 0.547 0.011 0.024
VK-1 slowly growing stalagmite, top 10.2 0.5 -9.4 20 -10.54 0.05 -6.92 0.07 0.631 0.013 0.027
VK-2 fast growing stalagmite, top 10.2 0.5 -9.4 23 -10.49 0.06 -6.71 0.11 0.592 0.008 0.016
BaTD 248 cultivated bacterial carbonate 21 0.1 7 -20.36 0.07 -9.50 0.08 0.639 0.020 0.048
Glass plate 1 13/01/2020; site 2, untreated 1946 9.6 0 -8.5 16 -10.02 0.03 -7.31 0.06 0.679 0.008 0.018
Glass plate 2 13/01/2020; site 1, UV-treated 2 9.8 0 -8.1 11 -8.35 0.06 -6.83 0.08 0.769 0.011 0.026
Glass plate 3 20/02/2020; site 1, untreated 32107 9.8 0.1 -8.4 4 -11.90 0.05 -6.60 0.06 0.731 0.018 0.057
Glass plate 4 20/02/2020; site 2, UV-treated 33 10.4 0.2 -8.7 11 -10.97 0.05 -6.64 0.11 0.692 0.009 0.019
Glass plate 7 29/05/2020; site 1, UV-treated 48 10.0 0.5 -8.8 10 -11.12 0.10 -6.33 0.13 0.732 0.009 0.019
Glass plate 8 29/05/2020; site 2, untreated >24000 11.0 0.3 -8.5 12 -11.70 0.07 -6.75 0.11 0.723 0.010 0.023 Temperatures (with uncertainties as total range) and water compositions (δ18Ow in ‰, relative to V-SMOW) were either obtained by monitoring during this study or were taken from earlier studies [15,20]. “n” is the number of replicateΔ47sample measurements. Uncertainties of meanΔ47(CDES25)are given as both: “±1SE” = one standard error of the mean (i.e., 1 SD/p
n) and “±95% CI” = uncertainties at 95% confidence interval of population mean using a Student’s t-distribution.
https://doi.org/10.1371/journal.pone.0245621.t001
and the grains are larger (5–20 microns), relative to the control sample (Fig 4C). The pieces of biofilm carbonate on the surface of the illuminated samples (inside the white rectange inFig 4Cand shown at higher magnification at the right side ofFig 4D) can presumably be explained by dripwater transportation. Calcite dissolution is evidenced by pitted holes and rugged sur- faces (e.g.,Fig 4D, left side), whereas reprecipitation is indicated by the presence of small (micron-sized) calcite crystals inside the holes and on the rugged surfaces.
It is interesting that the morphology and structure of the control and the UV-illuminated samples farmed in May are similar (Fig 4E and 4F). The same size range (10–40 microns) and well-developed calcite crystals are observed in both samples, which are characteristic of abio- genic carbonates. The relatively large amount of dripwater likely gave rise to dominant inor- ganic calcite precipitation in May, thus, the relative amount of bacterial carbonate decreased compared to the carbonate collected in January and February.
Equilibrium vs. kinetic fractionation during calcite precipitation is frequently evaluated by measuring the calcite-water oxygen isotope fractionation and formation temperature. The iso- tope fractionation is expressed by the 1000�lnαvalue, whereα= (1000+δ18Ocalcite)/(1000 +δ18Owater). Drip water temperatures show small variations during the studied period at both sites (Site-1: Tmin= 9.6˚C, Tmax= 11.4˚C, Taverage= 10.5˚C; Site-2: Tmin= 9.6˚C, Tmax= 10.0˚C, Taverage= 9.8˚C), characterized by similar average values to those observed during
Fig 2. TSA contact plates inoculated with samples taken on May 29 after incubation at 20˚C for 48 and 72 hours.
Red arrows point to the edge of the part of the plate pressed to the sample holder. White arrows point to the bacterial colonies, which follow this edge from the untreated habitat.
https://doi.org/10.1371/journal.pone.0245621.g002
previous long-term monitoring of this site (Taverage= 10.2˚C for the period of 1994–2013;
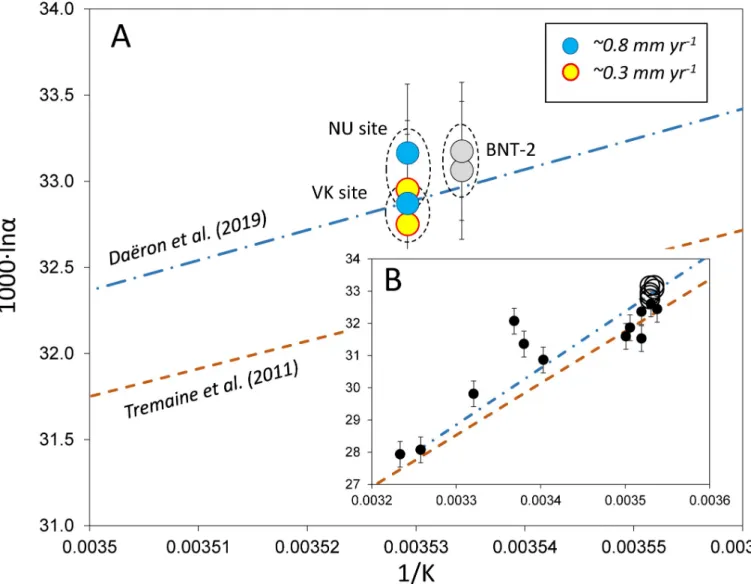
[20]). Thus, formation temperatures and water compositions were obtained during monitor- ing activities, and theδ18Ocalcitevalues were measured in this study (seeTable 1). The 1000�lnα values are plotted inFig 5as a function of 1/T, where T is temperature in K. „Equilibrium”
fractionation is represented by the curve of Dae¨ron et al. [11], while the Tremaine et al. [39]
curve, based on empirical observations for speleothems, is included for comparison (Fig 5A).
The BNT-2 flowstone and the NU-1 and NU-2 stalagmite data are shifted to higher 1000�lnα values compared to the Dae¨ron et al. [11] curve, whereas the VK stalagmites plot slightly below the „equilibrium” curve. It is interesting to note that the slowly depositing carbonates display lower fractionations than the faster precipitating ones. This suggests that an increased precipi- tation rate is associated with kinetic fractionation. The degree of kinetic effect is demonstrated inFig 5B, where the travertine data of Kele et al. [6] are shown. Although the travertine data yielded a coherentΔ47-temperature relationship [6], their 1000�lnαvalues scatter widely com- pared to the stalagmites studied here.
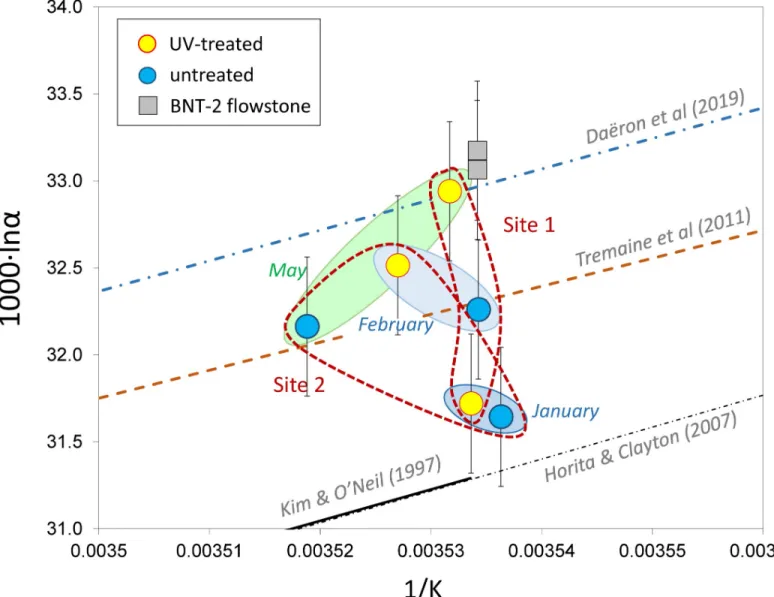
The farmed calcites scatter around the Tremaine et al. [39] curve. Systematic differences do not exist between the sites, and there is no relationship with the UV lamp treatment (Fig 6).
Conversely, there appears to be a change in sampling period, as the data for the January sam- pling (with very low amount of deposited carbonate) differ to the February and May data, although it should be noted that the differences (~±0.6‰) are only slightly higher than the analytical uncertainty (~0.3‰).
The calcite-water oxygen isotope fractionation values indicate that most of the speleothems and farmed calcites precipitated in close to isotopic „equilibrium”, with minor kinetic effects.
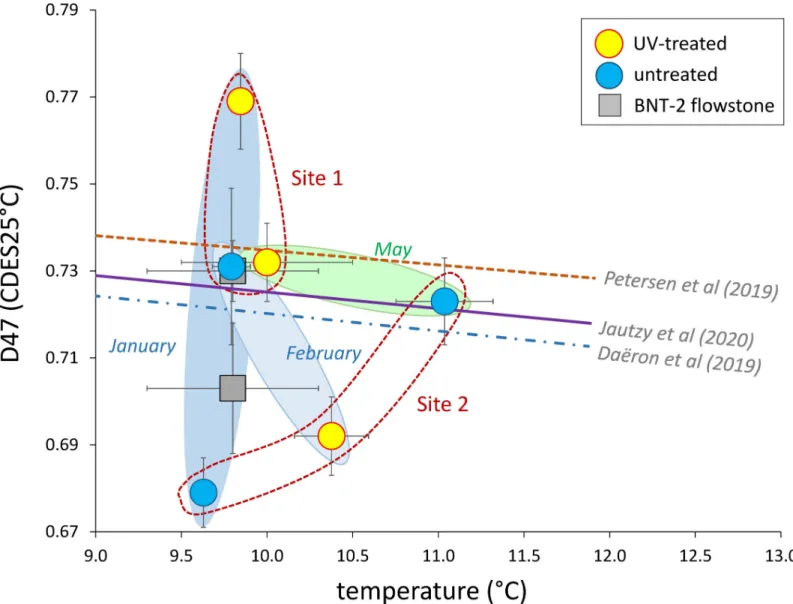
However, the clumped isotope values of the NU and VK stalagmites are markedly lower than those of the BNT-2 flowstone data (Table 1), similarly to the published stalagmite data [13]. As the clumped isotope technique evolved significantly in the last decade, early data may not be compared with the present dataset, which was obtained following the correction scheme of Petersen et al. [8]. However, the isotope shifts due to methodology are minor compared to the differences between „equilibrium”Δ47values [11] and stalagmite compositions [13]. The recent detection of ACC and its effect on the carbonate-water oxygen isotope fractionation [15], as well as evidence of the role of bacterial carbonate production in ACC formation [18]
raise the question if microbially mediated ACC formation also affects clumped isotope compositions. The carbonate precipitated by theRhodococcus degradansbacterial strain (BaTD-248) cultivated at 21˚C yielded a lowΔ47value (0.639±0.018 SE) compared to the value (0.678) that would be given by the „equilibrium” curve [11], which may also support the existence of the bacterium-related vital effect. However, the farmed calcites precipitated under a UV lamp and in control conditons plot close to the „equilibrium” curve, with no systematic relationship to UV treatment (Fig 7). There appears to be a connection to the sampling period and the site, as the two sampling sites have slightly different compositional fields, and data for periods producing a small amount of farmed calcites (January and February) scatter more widely than the samples collected in May, when carbonate formation was more extensive (based on scrapable amounts of carbonate on the glass surfaces). It is important to note that calcite morphologies between UV-illuminated and control sites of the May collection do not differ significantly.
Fig 3. Agar plates inoculated with samples taken May 29 (A) and February 20 (B, C) after incubation at 20˚C, for 48, 72 hours and one week. C panel shows plates inoculated with original samples in the form of droplets. White arrows point to the bacterial colonies.
https://doi.org/10.1371/journal.pone.0245621.g003
Fig 4. Scanning electron microscopic pictures of carbonates precipitated on glass plates. A) Glass plate collected on January 13, 2020, control site. B) Glass plate collected on January 13, 2020, control site, calcite crystals partially covered by biofilm carbonate. C) Glass plate collected on January 13, 2020, UV-illuminated site.
The white rectangle marks the area of Fig 4D. D) Glass plate collected on January 13, 2020, UV-illuminated site. Left side: resorbed calcite crystal. Right side: biofilm carbonate with bacterial forms. E) Glass plate collected on May 29, 2020, control site. F) Glass plate collected on May 29, 2020, UV-illuminated site.
https://doi.org/10.1371/journal.pone.0245621.g004
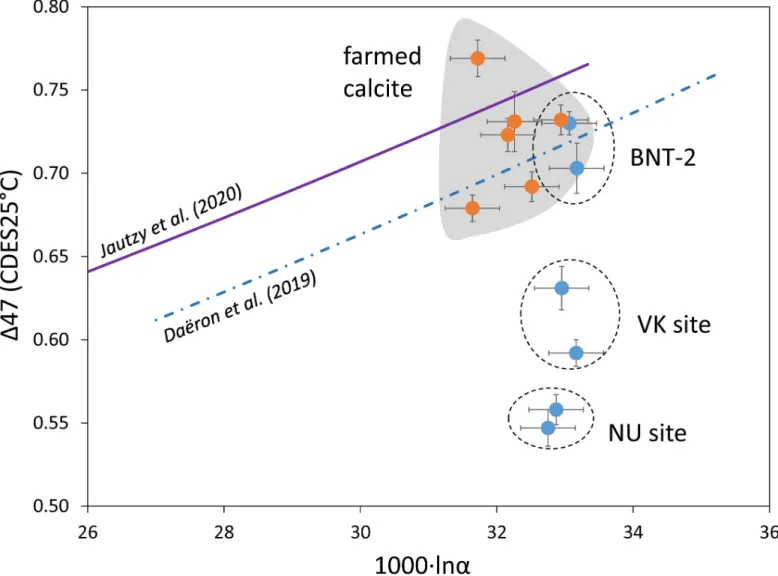
The site effect is also pronounced in the case of speleothems. The farmed calcites (with one exception) and the BNT-2 flowstone data plot around the Dae¨ron et al. [11] curve, whereas the stalagmites differ significantly (Fig 8). It should be noted that deposition rate plays a subordi- nate role to sampling site, as is exemplified by the NU stalagmites (NU-1: ~0.9 mm year–1; NU-2: ~0.3 mm year–1; [16]). The most important factors affecting clumped isotope composi- tions are likely kinetic fractionation along the drip waters’ seepage routes (degassing, evapora- tion, prior calcite precipitation), varying temporally and spatially between dripping points.
The close-to-„equilibrium” calcite-water oxygen isotope fractionation and the kinetically affected clumped isotope values can be related to different fractionation mechanisms. Disequi- libriumΔ47values of speleothems are explained by kinetic fractionation driven by CO2degas- sing [e.g., 14,42] that may occur at the speleothem surface or along the seepage route. As the studied site is closed with no or very weak ventilation [20], extensive degassing and evapora- tion are not expected. Thus, the oxygen isotope exchange between DIC species and H2O
Fig 5. A) Calcite-water stable oxygen isotope fractionations of speleothems of the Baradla and Be´ke Caves. NU site: Nehe´zu´t, Baradla Cave, stalagmites NU-1, NU- 2; VK site: Vaskapu site, Baradla Cave, stalagmites VK-1, VK-2 [16]; BNT-2: drill core of the Nagy-tufa flowstone [17]. Deposition rates are from Deme´ny et al. [16].
B) Open circles: speleothems studied in this paper, dots: travertines [6]). Curves are from Dae¨ron et al. [11] and Tremaine et al. [39], as inFig 5A. Temperature uncertainties are smaller than the sample signs.
https://doi.org/10.1371/journal.pone.0245621.g005
results inδ18O values that are characteristic of non-kinetic speleothems [39]. In contrast, CO2
degassing may occur along the seepage route, and the clumped isotope disequilibrium might be inherited from DIC species, as suggested by a recent study [42]. This is indicated by the site-specificΔ47shift described above.
Conclusions
Speleothems and farmed calcites were analyzed for stable oxygen isotope and clumped isotope compositions to determine if bacterial carbonate production had a detectable affect onΔ47val- ues. Using a monitored site in the Baradla cave (NE Hungary) as a natural laboratory, calcites were deposited on glass plates under a UV lamp and in control conditions. Microbiological analyses showed that the UV treatment resulted in a significant decrease of viable count of bac- teria on the glass plate. SEM analyses revealed significant morphological and microstructural differences between the control and UV-illuminated samples harvested in winter. FTIR and
Fig 6. Calcite-water stable oxygen isotope fractionations of farmed calcites of the Baradla Cave. Empirical [11,39], experimental [40], and theoretical [41] curves are shown. Temperature uncertainties are smaller than the sample signs.
https://doi.org/10.1371/journal.pone.0245621.g006
micro-XRD analyses determined that the deposited carbonate was calcite without an amor- phous carbonate component. Compared to the UV-illuminated glass plates that showed well developed calcite crystals, the control samples collected in January and February showed tex- tural features characteristic of bacterial carbonate. The calcite deposited in May was dominated by inorganic crystal forms, with no significant difference observed between the UV-illumi- nated and control sites.
Although most of the studied carbonates displayedδ18O values close to expected isotopic
„equilibrium” value, stalagmites yielded disequibriumΔ47values, while the farmed calcites and flowstone samples were characterized by close-to-„equilibrium”Δ47data. Bacterial activity did not exert a detectable influence on clumped isotope compositions. TheΔ47values of spe- leothems were primarily determined by formation environment (precipitation from dripping water as stalagmite or from flowing water layer as flowstone) and site-specific kinetic processes related to degassing, evaporation, and prior calcite precipitation along the seepage routes.
Fig 7. Clumped isotope compositions as a function of precipitation temperature for farmed calcites. Empirical and experimental „equilibrium” curves [8,9,11] are shown.
https://doi.org/10.1371/journal.pone.0245621.g007
Supporting information
S1 Table. Raw clumped isotope data of samples.
(XLSX)
S2 Table. Long-term raw data of standards used for clumped isotope analyses (ETH1, ETH2, ETH3, ETH4, IAEA-C2).
(XLSX)
S1 Appendix. Technical details of clumped isotope analyses including S1 and S2 Tables in S1 Appendix.
(PDF)
Acknowledgments
Employees of the Aggtelek National Park provided essential help during monitoring and sam- pling activities, which is gratefully ackowledged. Ariana Gugora is thanked for proofreading
Fig 8. Clumped isotope compositions as a function of calcite-water stable oxygen isotope fractionation values for farmed calcites and speleothems.
https://doi.org/10.1371/journal.pone.0245621.g008
the manuscript. Constructive reviews from Prof. Christoph Spo¨tl and Dr. David Bajnai helped to improve the paper.
Author Contributions Conceptualization: Attila Deme´ny.
Data curation: La´szlo´ Rinyu, Pe´ter Ne´meth.
Formal analysis: La´szlo´ Rinyu, No´ra Enyedi.
Investigation: Attila Deme´ny, Pe´ter Ne´meth, Gyo¨rgy Czuppon, No´ra Enyedi, Judit Makk, Sza- bolcs Lee´l-O˝ ssy, Do´ra Kesja´r, Ivett Kova´cs.
Methodology: Pe´ter Ne´meth.
Project administration: Attila Deme´ny.
Supervision: Attila Deme´ny.
Writing – original draft: Attila Deme´ny.
References
1. Dorale JA, Edwards RL, Alexander EC, Shen C-C, Richards DA and Cheng H. Uranium-series dating of speleothems: current techniques, limits and applications. In: Sasowsky ID and Mylroie J, editors. Stud- ies of Cave Sediments. Physical and Chemical Records of Palaeoclimate. Kluwer Academic, New York; 2004. pp. 177–197.https://doi.org/10.1126/science.1091220PMID:15105497
2. Fairchild IJ and Baker A. Speleothem Science: From Process to Past Environments. Wiley-Blackwell, 2012.
3. Ghosh P, Adkins J, Affek H, Balta B, Guo W, Schauble EA, et al.13C–18O bonds in carbonate minerals:
a new kind of paleothermometer. Geochim. Cosmochim. Acta. 2006; 70: 1439–1456.
4. Eiler JM. ‘‘Clumped-isotope” geochemistry–the study of naturally-occurring, multiply-substituted isoto- pologues. Earth Planet. Sci. Lett. 2007; 262: 309–327.
5. Peral M, Dae¨ ron M, Blamart D, Bassinot F, Dewilde F, Smialkowski N, et al. Updated calibration of the clumped isotope thermometer in planktonic and benthic foraminifera. Geochimica et Cosmochimi- caActa. 2018; 239: 1–16.
6. Kele S, Breitenbach SFM, Capezzuoli E, Meckler AN, Ziegler M, Millan IM, et al. Temperature depen- dence of oxygen- and clumped isotope fractionation in carbonates: a study of travertines and tufas in the 6–95˚C temperature range. Geochim. Cosmochim. Acta. 2015; 168: 172–192.
7. Kluge T, John CM, Jourdan A-L, Davis S and Crawshaw J. Laboratory calibration of the calcium carbon- ate clumped isotope thermometer in the 25–250˚C temperature range. Geochim. Cosmochim. Acta.
2015; 157: 213–227.
8. Petersen SV, Defliese WF, Saenger C, Dae¨ron M, Huntington KW, John CM, et al. Effects of improved
17O correction on interlaboratory agreement in clumped isotope calibrations, estimates of mineral-spe- cific offsets, and temperature dependence of acid digestion fractionation. Geochemistry, Geophysics, Geosystems. 2019; 20: 3495–3519.
9. Jautzy JJ, Savard MM, Dhillon RS, Bernasconi SM and Smirnoff A. Clumped isotope temperature cali- bration for calcite: Bridging theory and experimentation. Geochem. Persp. Let. 2020; 14: 36–41.
10. Coplen TB. Calibration of the calcite-water oxygen-isotope geothermometer at Devils Hole, Nevada, a natural laboratory. Geochim. Cosmochim. Acta. 2007; 71: 3948–3957.
11. Dae¨ron M, Drysdale RN, Peral M, Huyghe D, Blamart D, Coplen TB, et al. Most Earth surface calcites precipitate out of isotopic equilibrium. Nat. Commun. 2019; 10: 429.https://doi.org/10.1038/s41467- 019-08336-5PMID:30683869
12. Chacko T and Deines P. Theoretical calculation of oxygen isotopic fractionation factors in carbonate systems. Geochim. Cosmochim. Acta. 2008; 72: 3642–3660.
13. Dae¨ron M, Guo W, Eiler J, Genty D, Blamart D, Boch R, et al.13C-18O clumping in speleothems: Obser- vations from natural caves and precipitation experiments. Geochim. Cosmochim. Acta 2011; 75: 3303–
3317.
14. Affek HP, Matthews A, Ayalon A, Bar-Matthews M, Burstyn Y, Zaarur S, et al. Accounting for kinetic iso- tope effects in Soreq Cave (Israel) speleothems. Geochim. Cosmochim. Acta. 2014; 143: 303–318.
15. Deme´ ny A, Ne´meth P, Czuppon GY, Lee´l-O˝ ssy SZ, Szabo´ M, Judik K, et al. Formation of amorphous calcium carbonate in caves and its implications for speleothem research. Scientific Reports. 2016;
6:39602,https://doi.org/10.1038/srep39602PMID:28004767
16. Deme´ ny A, Ne´meth A, Kern Z, Czuppon GY, Molna´r M, Lee´l-O˝ ssy SZ, et al. Recently forming stalag- mites from the Baradla Cave and their suitability assessment for climate-proxy relationships. Central European Geology. 2017; 60: 1–34.
17. Deme´ ny A, Kern Z, Ne´meth A, Frisia S, Hatvani IG, Czuppon GY, et al. North Atlantic influences on cli- mate conditions in East-Central Europe in the late Holocene reflected by flowstone compositions. Qua- ternary International. 2019; 512: 99–112.
18. Enyedi NT, Makk J, Ko´tai L, Bere´ nyi B, Kle´bert S, Sebestye´n Z, et al. Cave bacteria-induced amorphous calcium carbonate formation. Scientific Reports. 2020; 10: 8696.https://doi.org/10.1038/s41598-020- 65667-wPMID:32457467
19. Thaler C, Katz A, Bonifacie M, Me´nez B and Ader M. Oxygen isotope composition of waters recorded in carbonates in strong clumped and oxygen isotopic disequilibrium. Biogeosciences. 2020; 17: 1731–
1744.
20. Czuppon G, Deme´ ny A, Lee´l-O˝ ssy Sz, O´vari M, Molna´r M, Stieber J, et al. Cave monitoring in the Be´ke and Baradla caves (Northeastern Hungary): implications for the conditions for the formation cave car- bonates. International Journal of Speleology. 2018; 47: 13–28.
21. Deme´ ny A, Kern Z, Czuppon GY, Ne´meth A, Lee´l-O˝ ssy SZ, Siklo´sy Z, et al. Stable isotope composi- tions of speleothems from the last interglacial–Spatial patterns of climate fluctuations in Europe. Quater- nary Science Reviews. 2017; 161, 68–80.
22. Lis G, Wassenaar LI and Hendry MJ. High-precision laser spectroscopy D/H and18O/16O measure- ments of microliter natural water samples. Analytical Chemistry. 2008; 80: 287–293.https://doi.org/10.
1021/ac701716qPMID:18031060
23. Hu B, Radke J, Schlu¨ter HJ, Heine FT, Zhou L and Bernasconi SM. A modified procedure for gas- source isotope ratio mass spectrometry: The long-integration dual-inlet (LIDI) methodology and implica- tions for clumped isotope measurements. Rapid Communications in Mass Spectrometry. 2014; 28:
1413–1425.https://doi.org/10.1002/rcm.6909PMID:24861590
24. Schmid TW and Bernasconi SM. An automated method for “clumped-isotope” measurements on small carbonate samples. Rapid Communications in Mass Spectrometry. 2010; 24: 1955–1963.https://doi.
org/10.1002/rcm.4598PMID:20552704
25. Meckler AN, Ziegler M, Milla´n MI, Breitenbach SFM and Bernasconi SM. Long-term performance of the Kiel carbonate device with a new correction scheme for clumped isotope measurements. Rapid Com- munications in Mass Spectrometry. 2014; 28: 1705–1715.https://doi.org/10.1002/rcm.6949PMID:
24975251
26. Mu¨ller IA, Fernandez A, Radke J, van Dijk J, Bowen D., Schwieters Jet al. Carbonate clumped isotope analyses with the long-integration dual-inlet (LIDI) workflow: Scratching at the lower sample weight boundaries. Rapid Communications in Mass Spectrometry. 2017; 31: 1057–1066.https://doi.org/10.
1002/rcm.7878PMID:28402589
27. Piasecki A, Bernasconi SM, Grauel AL, Hannisdal B, Ho SZL, Leutert TJ, et al. Application of Clumped Isotope Thermometry to Benthic Foraminifera. Geochemistry, Geophysics, Geosystems. 2019; 20:
2082–2090.
28. Bernasconi SM, Mu¨ller IA, Bergmann KD, Breitenbach SFM, Fernandez A, Hodell DA, et al. Reducing uncertainties in carbonate clumped isotope analysis through consistent carbonate-based standardiza- tion. Geochemistry, Geophysics, Geosystems. 2018; 19: 2895–2914.https://doi.org/10.1029/
2017GC007385PMID:30443200
29. John CM and Bowen D. Community software for challenging isotope analysis: First applications of
‘Easotope’ to clumped isotopes. Geochemistry, Geophysics, Geosystems. 2016; 30: 2285–2300.
https://doi.org/10.1002/rcm.7720PMID:27524507
30. Baertschi P. Absolute18O content of standard mean ocean water. Earth and Planetary Science Letters.
1976; 31: 341–344.
31. Gonfiantini R, Stichler W, and Rozanski K. Standards and intercomparison materials distributed by the International Atomic Energy Agency for stable isotope measurements. In Reference and Intercompari- son Materials for Stable Isotopes of Light Elements. Vienna: International Atomic Energy Agency. 1995;
IAEA-TECDOC-825, pp. 13–29.
32. Meijer HAJ and Li WJ. The use of electrolysis for accurateδ17O andδ18O isotope measurements in water. Isotopes in Environmental and Health Studies. 1998; 34: 349–369.
33. Assonov SS, Carl S and Brenninkmeijer AM. A redetermination of absolute values for17RVPDB-CO2and
17RVSMOW. Rapid Com. in Mass. Spec. 2003; 17: 1017–1029.
34. Brand WA, Assonov SS and Coplen TB. Correction for the17O interference inδ(13C) measurements when analyzing CO2with stable isotope mass spectrometry (IUPAC Technical Report). Pure Appl.
Chem. 2010; 82: 1719–1733.
35. Enyedi NT, Borsodi AK, Ne´meth P, Felfo¨ldi T, Szabo´ A, Bere´nyi B, et al. Geomicrobiological study in a carbonate cave of the Aggtelek Karst, Hungary. Acta Microbiologica et Immunologica Hungarica. 2019;
66: Supl.129.
36. Amann RI, Ludwig W and Schleifer KH. Phylogenetic identification and in situ detection of individual microbial cells without cultivation. Microbiol. Rev. 1995; 59: 143–169. PMID:7535888
37. Arrage AA, Phelps TJ, Benoit RE and White DC. Survival of subsurface microorganisms exposed to UV radiation and hydrogen peroxide. Appl. Environ. Microbiol. 1993; 59: 3545–3550.https://doi.org/10.
1128/AEM.59.11.3545-3550.1993PMID:8285661
38. Goosen N and Moolenaar GF. Repair of UV damage in bacteria. DNA Repair. 2008; 7: 353–379.
https://doi.org/10.1016/j.dnarep.2007.09.002PMID:17951115
39. Tremaine DM, Froelich PN and Wang Y. Speleothem calcite farmed in situ: Modern calibration ofδ18O andδ13C paleoclimate proxies in a continuously-monitored natural cave system. Geochim. Cosmo- chim. Acta. 2011; 75: 4929–4950.
40. Kim S-T and O’Neil JR. Equilibrium and nonequilibrium oxygen isotope effects in synthetic carbonates.
Geochim. Cosmochim. Acta. 1997; 61: 3461–3475.
41. Horita J and Clayton RN. Comment on the studies of oxygen isotope fractionation between calcium car- bonates and water at low temperatures by Zhou and Zheng (2003, 2005). Geochim. Cosmochim. Acta.
2007; 71: 3131–3135.
42. Bajnai D, Guo W, Spo¨tl C, Coplen TB, Methner K., Lo¨ffler N, et al. Dual clumped isotope thermometry resolves kinetic biases in carbonate formation temperatures. Nature Communications 2020; 11: 4005.
https://doi.org/10.1038/s41467-020-17501-0PMID:32778658