This accepted author manuscript is copyrighted and published by Elsevier. It is posted here by agreement between Elsevier and MTA.
The definitive version of the text was subsequently published in Sensors and Actuators A: Physical, 272, 2018, DOI:
10.1016/j.sna.2018.01.039 Available under license CC-BY-NC-ND.
Analysis of the applicability of optical fibers as sensors for the structural health monitoring of polymer composites: the relationship between attenuation and the deformation of the fiber
Gergely Hegedűs1 and Tibor Czigány1,2*
1 Department of Polymer Engineering, Faculty of Mechanical Engineering, Budapest University of Technology and Economics, H-1111 Budapest, Műegyetem rkp. 3. Hungary
2 MTA–BME Research Group for Composite Science and Technology, H-1111 Budapest, Műegyetem rkp. 3.
Hungary
* Correspondence: czigany@eik.bme.hu; Tel.: +36-1-463-2003 Abstract:
The goal of our research is to prove that the single-mode optical glass fiber used in telecommunications and the optical loss test set used for the characterization of telecommunication networks is suitable for the structural health monitoring of polymer composites. We built optical fibers into specimens and analyzed the relationship between attenuation of the fiber and the deformation of the specimen. Based on our results, we worked out the basics of a cost-effective measurement method. In the case of general-purpose polymer composite products, where the knowledge of structural health is important but not critical but the more complex embedded sensor systems would be too expensive, the method can show the strain state of the structure unambiguously (within categories). The method can be used in practice and evaluated easily and can show whether a thorough structural examination is necessary.
Keywords:
polymer matrix composite; optical fiber; structural health monitoring; deformation; attenuation measurement; optical loss test set
1. Introduction
Nowadays optical fibers are widely used in telecommunications. Light cannot exit the optical fiber, it can transfer information even across continents. Due to the large amounts of optical fibers produced, they are easily available. The quality or state of couplings of optical networks in telecommunications are most often tested with the optical loss test set, since attenuation is the most commonly measured characteristic when optical systems are installed, operated and maintained. The optical loss test set consists of a fixed wavelength (most commonly 1310 or 1550 nm) light source, and an attenuation meter connected to the other end of the network. Attenuation (a) is the ratio in decibels of the input power (Pin) and the output power (Pout) [1] (1):
a = 10 lg(Pin/Pout) (1) Attenuation shows a reduction in the light transfer ability of the optical network, in other words, its
“quality”. The attenuation of the fibers is in the range of a few tenth of a dB/km, depending on the wavelength (e.g.: fused silica glass –SiO2– at 1310 nm ~0,30 dB/km, at 1550 nm ~0,16 dB/km [2]). Where fibers are joined by welding, attenuation is 0,01-0,02 dB (~2-5% reduction in power) depending on the quality of welding, while in the case of mechanical couplers, attenuation is ~0,50 dB (~10% reduction in power).
The diameter of generally used glass optical fibers is 125 µm, with a core of about 10 micrometer in diameter, which has a higher refractive index (it is optically denser) than the cladding around it. The glass fiber is protected mechanically by a layer of coating of ~60 µm thickness and another outer protective layer. The advantage of optical glass fibers is that radio frequency (RF) waves do not disturb their operation, therefore the fiber do not need radio frequency shielding, and glass fibers do not emit RF waves either, therefore they do not cause RFI (Radio Frequency Interference) [3-5]. They are highly resistant to corrosion and heat [6]. Their other advantages are their low diameter, low mass and high flexibility. These advantageous properties make glass fibers suitable to use as sensors. Optical fibers can be used as sensors in two ways: if the fiber only transfers the information between the sensing unit and the processing unit, it is called an extrinsic sensor, while if the fiber is both the sensor and the medium transferring the signal, it is called an intrinsic sensor. A characteristic of the light travelling in the optical fiber of optical sensors (e.g. intensity, spectrum) changes as a result of external influences (e.g. deformation) [7]. A common feature of different types of optical sensors [8, 9] is that the signal processing device is a separate unit and can be detached from the optical fiber.
Optical fibers can be built into polymer matrix composites easily due to its advantageous properties, and it doesn’t affect significantly the overall mechanical performance of the composites [10, 11]. The development of polymer matrix composites has been uninterrupted to the present day [12], fiber- reinforced composites are used nearly everywhere (e.g.: sports equipment, medical implants, rotor blades of windmills, the body of airplanes, ships, cars, trucks and buses). As opposed to the far more homogeneous structure of metals, composites have a matrix and reinforcing fibers, which behave differently under loads [13, 14]. For this reason information about the health of composite structures is very important, especially in the case of parts related to personal safety. The spread of composites brings new methods of checking structural health, and requires the development of simple, non-destructive, in- situ structural health monitoring methods. There are numerous methods for the analysis of the structural health of polymer matrix composite structures [15], of which optical sensor methods are attracting more and more attention from researchers. The price of optical structural health analysis systems makes the use of the technology uneconomical in the case of non-special, general use products. The cost of these systems is far greater, than simple devices, such as the optical loss test set and optical fiber used to test optical networks.
Several researchers have examined the applicability of optical fibers for the structural health monitoring of polymer matrix composite structures. Crane et al. [16] laminated optical glass fibers into glass fiber reinforced epoxy matrix composite specimens. Crossing each other, the fibers formed a square grid. Each fiber was illuminated with visible light separately, and the location of damage was identified with the help of the light exiting the fibers. The panel did not emit light if the magnitude of the damage was high enough to break the embedded optical fiber. This principle was used by Glossop et al. [17], and LeBlanc and
Measures [18] in their research. The disadvantage of the system is that it only provides information about the damage if it was big enough to cause at least one optical fiber to break. In this case the method can locate the damage but does not provide information about its magnitude. Several researchers have examined how attenuation changes as a result of deformation. They showed that the micro-level and macro-level bending of optical fibers causes a change in attenuation, in the light power transferred by the optical fiber [19-21]. Takeda [22] analyzed how the change in attenuation can be applied to analyze the health of composite parts by analyzing the deformation of glass fiber reinforced bismaleimide matrix composites with the help of polymer optical fibers embedded into the composites. He used a LED light source of a wavelength of 660 nm and measured the transmitted light power with a photo detector. The power changed proportionally to the deformation under load. He found that ~1% deformation caused a change of 0.5-2% in the transmitted light power depending on the layer structure of the reinforcement (this means an attenuation change of ~0.02-0.09 dB). He found the method suitable to observe not only deformation but crack propagation as well.
Based on the literature, it can be stated that the transmission properties of the fiber largely depend on the material of the fiber (glass or polymer). Generally available polymer optical fibers absorb infrared radiation to a great degree, therefore the optical loss test set generally used in telecommunications cannot be used in the case of polymer fibers because it uses infrared light (1310 and 1550 nm).
We examined the applicability of optical glass fibers widely used in telecommunications for the structural health monitoring of general polymer composite materials. Our goal is to assess the deformation of the structure based on a changed characteristic of the light transmitted by the optical fiber embedded into the polymer composite, therefore we examined the change in the attenuation of the fiber while it was loaded. Our goal is to apply the optical loss test set generally used in telecommunications, to show large- scale deformation in critical points of the composite part before a critical state which causes failure, and develop a simple and cost-effective test method. We also wish to develop structural health monitoring system with which the health of structural elements can be classified into given categories over their whole life cycle (during operation, during maintenance, in the case of damage, in the case of breakdown).
2. Materials and methods
The experiments served to prove that the deformation of optical glass fibers causes a change in the attenuation of the optical fiber both when it is alone and when it is embedded into a composite specimen.
From this change we can estimate the state of the environment of the fiber. The analysis of the changed attenuation of the fiber can be the basis of a new structural health monitoring procedure, therefore we conducted several measurement series to determine the best way to build the optical fiber into the composite and which factors influence the measured attenuation values.
2.1. Materials used, manufacturing the specimens
The type of optical fiber used in the experiments is G.652.D. It is a single-mode glass fiber with a diameter of 125 microns (Corning, USA). Its core has a diameter of 9 microns, it is sensitive to deformation and the fiber end is perpendicular. We examined the optical fiber alone, and embedded into a glass fiber reinforced composite specimen. When the optical fiber was examined alone, the coating, which protects it mechanically, was not removed because the fiber broke very easily as a result of the slightest force. When the fiber was embedded into a composite, the coating was removed because the surrounding matrix
protected the fiber mechanically and we tried to preserve the continuity of the composite structure by making the embedded fiber as thin as possible. When making the specimens by hand lamination, we placed the optical fiber between two layers of [0/90] woven glass fiber fabrics (plain weave, 300±5% g/m2, RT 300 N, Kelteks, Croatia) equidistant from the longitudinal edges, and used unsaturated polyester resin as matrix (AROPOL M105 TB, Ashland S.p.A., Italy). We also added an initiator (PROMOX P200TX, PROMOX SRL, Italy) to the resin. The amount of the initiator was 1.5% of the mass of the resin. The thickness of the specimens were 1,6±0,2 mm.
2.2. Equipment and measurement methods
We used a cleaver (Fujikura, CT-30, USA) and a fiber welder (Fujikura, FSM 12 S, USA) to connect fibers. At one end an infrared light source of 1550 nm provided light (AFL Telecommunications, OLS7 FTTH UCI, USA), and on the other hand an attenuation meter with a resolution of 0.01 dB (AFL Telecommunications, OPM5- 4D, USA) measures the change of intensity of the emitted light. We deformed the optical fiber and the composite specimens in a tensile tester (Zwick, BZ050/TH3A, Germany). In the tensile tests crosshead speed was 0.4 mm/min, while in the compression tests, maximum force was 5000 N, loading speed was 10 N/s, and the compressed area was 10x25 mm.
3. Results and discussion
For each test, 6 specimens were made. The tests can be found in Table 1. The location where the fiber exits the specimen of the embedded optical fiber greatly influenced the tests; these are described in the subchapters.
Table 1.
Specimen Subchapter Type of test The optical fiber exits the
specimen Optical fiber
with a
protective coating
3.1.1. Compression test perpendicular to the axis of
the fiber -
3.1.2. Tensile test parallel to the axis of the fiber -
Optical fiber embedded into the composite
3.2.1. Compression test perpendicular to the axis of the fiber
Beyond the clamps of the tensile tester
3.2.2. Tensile test parallel to the axis of the fiber Beyond the clamps of the tensile tester
3.2.3. Tensile test parallel to the axis of the fiber Before the clamps of the tensile tester
3.1. Change in the attenuation of a standalone optical fiber
Without the protective coating, optical fibers are very sensitive to mechanical loads, they break as a result of the smallest impact, therefore when standalone optical fibers (not embedded) were examined, the protective coating (with which the diameter of the fiber was 250 microns) was not removed.
3.1.1. Change in the attenuation of an optical fiber as a result of compression
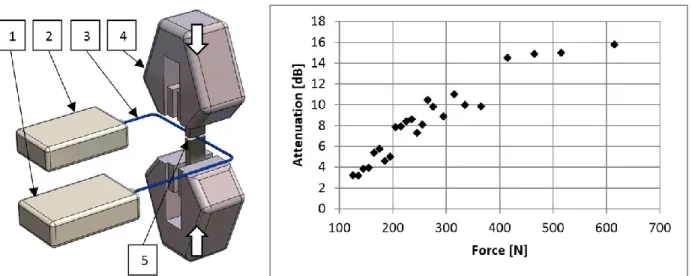
In our first experiment, we examined how the attenuation of optical fibers changes as a result of compression perpendicular to the axis of the fiber. Since the fiber is sensitive, fibers were compressed with a flexible compression plate until breakage, in order to avoid immediate breakage. The various compressive force values and the corresponding attenuation values can be found in Fig. 1.
Fig. 1. Compression test layout (1-light source, 2-attenuation meter, 3-optical fiber, 4-clamps of the tensile tester, 5-flexible compression plate) and a typical curve
The measured values show that the attenuation of the fiber increases as the compressive force increases.
A 10 N increase in compressive force leads to an attenuation change of several tenths of decibels (this change can be measured well because it is similar to the attenuation of a mechanical optical coupler). The measurement shows that the procedure can indicate changed compressive force and the deformation of the fiber but it cannot show the location of the deformation. If deformation causes the fiber to break, light cannot travel further in the fiber and will not exit at the testing side (it exits the fiber earlier at the point of breakage), therefore the method can show extreme deformations and failures that cause the fiber to break.
3.1.2. Change in the attenuation of an optical fiber as a result of tensile loading
We measured the change in the attenuation of optical fibers during tensile loading; the specimen was tabbed to avoid slipping out. 50 mm of free length was left between the tabs. The measurement layout can be seen in Fig. 2. When the specimens were clamped, the pressure of the clamps of the tensile tester clearly caused an increase in the measured attenuation values.
Fig. 2. Tensile test layout (1-light source, 2-attenuation meter, 3-optical fiber, 4-clamps of the tensile tester, 5-tabs) and a typical curve measured with the coated fiber slipping out
The coated optical fiber slipped out from between the two composite plates used to clamp it, due to the inferior adhesion of the matrix and the coating, therefore we get different pulling force – attenuation values as a function of relative displacement. On the pulling force – displacement diagram it can be seen that the fiber slips at times but the attenuation of the fiber still increases as the tensile force increases.
This phenomenon shows that attenuation is related to the deformation of and the tensile stress in the fiber.
3.2. Change in the attenuation of an optical fiber embedded into a composite specimen
The previous experiments showed that compressive and tensile force affect the attenuation of the fiber.
To examine the applicability of the method for the analysis of the health composite structures, we built the bared fiber into composite specimens and examined the change in the attenuation of the fiber as a result of loading.
3.2.1. Change in the attenuation of an optical fiber embedded into a composite specimen as a result of compression
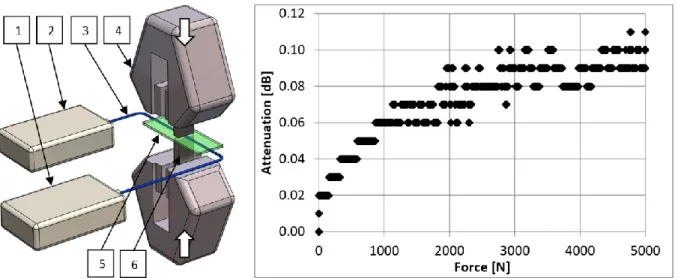
In order to investigate the change in the health of composite parts, we made a 140 mm long specimen, with an optical fiber between two layers of [0/90] woven glass fiber mats, and examined the change in the attenuation of the fiber, while continuously increasing compressive force (Fig. 3).
Fig. 3. Compression test layout (1-light source, 2-attenuation meter, 3-optical fiber, 4-clamps of the tensile tester, 5-composite specimen, 6-compression area) and typical curve
The compressive force – attenuation diagrams show that the attenuation of a fiber embedded into a composite specimen increases as the compressive force increases, but not as much as in the case of a standalone optical fiber. The reason is that the glass fiber mat surrounding the fiber distributes the load and the optical fiber does not take the entire load.
3.2.2. Change in the attenuation of an optical fiber embedded into a composite specimen as a result of a tensile force
The previous tests (3.1.2.) showed that the strain of a standalone optical fiber caused by a tensile force changed the attenuation of the fiber. The goal of our next set of experiments was to show that the attenuation of an optical fiber embedded into a composite specimen also changes as a result of deformation caused by a tensile force. We made a 140 mm long specimen, with an optical fiber between two layers of [0/90] woven glass fiber mats, and examined the change in the attenuation of the fiber as a result of tensile loading (Fig. 4).
Fig. 4. Tensile test layout (1-light source, 2-attenuation meter, 3-optical fiber, 4-clamps of the tensile tester, 5-composite specimen) and a typical curve
During the tensile test of the composite specimen, we continuously measured the attenuation of the embedded fiber and the amount of loading. The initial distance between the clamps of the tensile tester was 70 mm. After clamping, the initial attenuation of the fiber increased by 6.55 dB. The results show (Fig.
4) that with the deformation of the composite specimen, and thus the embedded optical fiber, the attenuation of the optical fiber increases. Up to a strain of ~0,6% the attenuation of the fiber increased by
~1 dB (a ~20% reduction in the power of the emitted light), then attenuation increased faster, at a strain of ~0,8%, attenuation increased by ~2,3 dB compared to the initial value (a ~41% reduction in the power of the emitted light). This change in attenuation can be identified and provides help in identifying a load that is too high, before catastrophic failure of the specimen. The disadvantage of the measurement layout is that the fiber enters and exits the specimen beyond the clamps of the tensile tester, therefore the optical fiber suffered a high load during clamping, which lead to an increase in the initial attenuation values. The increase in attenuation was an order of magnitude higher than in the case of the compressive test of the previous composite specimen. The explanation is the fastening of the optical fiber in the composite. The optical fiber ran on the surface of the specimen in some areas where the specimen was clamped and there the compressive force of the clamps loaded the fiber directly. This may have influenced the measurement results, therefore we decided on a new specimen, which eliminates this measurement error.
3.2.3. Change in the attenuation of an optical fiber embedded into a composite specimen as a result of a tensile force
In order to avoid the clamps of the tensile tester loading the optical fiber directly and changing initial attenuation values, we used the following specimen layout: we made a specimen with two layers of [0/90]
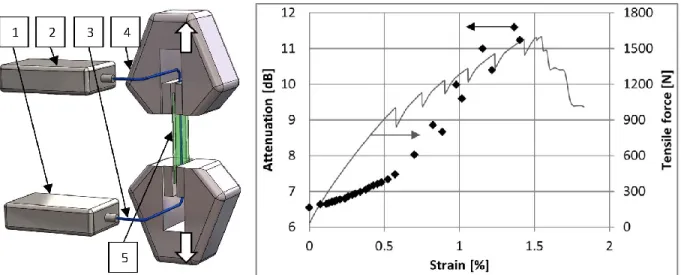
woven glass fiber mats with an optical fiber between them in such a way that the optical fiber exits the specimen before the clamps of the tensile tester, so the fastening of the specimen does not influence the measured values. The full length of the specimen is 250 mm, clamping length is 185 mm, the embedded length of the optical fiber is 140 mm. Attenuation after clamping was 0 dB. We measured the change in attenuation while a tensile force was applied (Fig. 5).
Fig. 5. Tensile test layout (1-light source, 2-attenuation meter, 3-optical fiber, 4-clamps of the tensile tester, 5-composite specimen) and a typical curve
The change in the attenuation of the optical fiber shows the applicability of the method very well. The fastening of the specimen did not affect the value of initial attenuation in any of the measurements, so we only actually measured the attenuation change caused by the tensile load. The attenuation change remained under 0.1 dB (a ~2.3% change in the intensity of the emitted light) up to a strain of 0.6%, but between ~0.6% and ~0.8% deformation, attenuation increases drastically. This sharp increase can be clearly identified and can be attributed to a deformation state. This deformation state is well below the value belonging to the catastrophic failure of the composite specimen (1.2%-1.5%). In the case of general- purpose composite structures, the method may be suitable to show deformation before catastrophic failure. During operation, if the change in the attenuation of the embedded optical fiber exceeds 1 dB (a
~20% reduction in the power of emitted light), it indicates that deformation is greater than 0.6%, therefore maintenance or another check is necessary. The jump in attenuation did not show up in the previous test because of the increased attenuation of the fiber caused by clamping. For this reason, it is very important that optical fibers are embedded into composite structural elements carefully and without loading.
4. Conclusions
Our results indicate that the deformation of a single-mode optical fiber embedded into a polymer matrix composite affects the attenuation of the fiber, and as the load on the fiber increases, attenuation increases, too. If the attenuation of the fiber is analyzed, information can be obtained about the deformation of the environment of the fiber with a widely available optical loss test set. The optical fiber can be embedded into the part to be monitored easily, the measuring equipment can be attached to it easily (without building it in), therefore the method is suitable for even in-situ monitoring of the part. The attenuation change of the fiber largely depends on the way it is embedded, and it is not very sensitive to compression. In spite of this, the method can show existing deformation before critical deformation, and
provides a clear indication of a strain of 0.6-0.8%. In the case of general-purpose polymer matrix composites, where knowing the structural health of the product is not critical but important, and low cost is essential, therefore complex, embedded sensors cannot be used, our method is a suitable alternative.
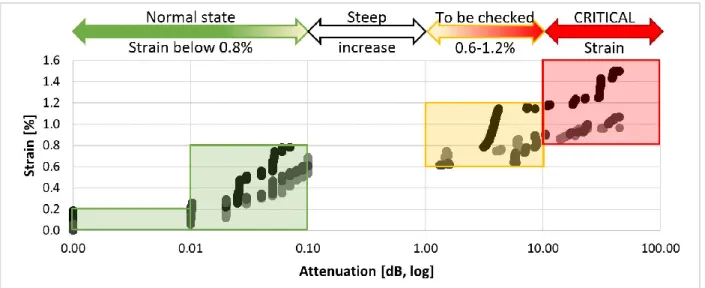
It is cheap and shows deformation before critical failure. The method can be put into practice easily, thanks to the advantageous properties of optical fibers, and the easy availability of attenuation metering equipment. The simplicity of application is shown in Fig. 6. The method can provide the information whether or not a more thorough structural check is necessary.
Fig. 6. Structural health according to the measured values
The figure shows that below a 0.01 dB attenuation, the strain of the structure does not exceed 0.2%, between an attenuation of 0.01-0.1 dB the strain of the structure is less than 0.8%, and above this, a strain increase causes a huge jump (more than an order of magnitude) in attenuation. An attenuation of more than 1 dB indicates that the strain of the structure has exceeded 0.6%, and it is necessary to perform an additional structural health check at the location of the fiber. If attenuation exceeds 10 dB, the structure has reached a state of critical deformation and is only 0,3-0,4% strain away from critical failure – immediate action is required.
Acknowledgments
This research was supported by the New National Excellence Program ÚNKP-17-3-I. of the Ministry of Human Resources. The article was supported by the OTKA (K 116070 and K120592) and NVKP (NVKP_16- 1-2016-0046) projects of the National Research, Development and Innovation Office (NKFIH). The authors wish to thank Zsolt Szabó and Péter Dobos (ATL Kft), Enikő Csallány, Zoltán Rabi, Péter Tugyi, Balázs Bartalos, Tamás Rácz and Bence Péter for their help in performing the measurements.
References
[1] K.T.V. Grattan, B.T. Meggitt, Optical fiber sensor technology, Springer-Science+Business Media, Dordrecht, 1995.
[2] B.E.A. Saleh, M.C. Teich, Fundamentals of photonics, John Wiley & Sons Inc., New York, 1991.
[3] B. Gholamzadeh, H. Nabovati, Fiber optic sensors, International Journal of Electrical, Computer, Energetic, Electronic and Communication Engineering, 2/6 (2008) 1107–1117.
[4] R. Di Sante, Fibre Optic sensors for structural health monitoring of aircraft composite structures.
Recent advances and applications, Sensors, 15 (2015) 18666–18713.
[5] B. Glisic, Distributed fiber optic sensing technologies and applications – an overview, ACI Special Publication, SP-292 (2013) 1–18.
[6] V. Antonucci, M. Esposito, M.R. Ricciardi, M. Raffone, M. Zarrelli, M. Giordano, Permeability characterization of stitched carbon fiber preforms by fiber optic sensors, Express Polymer Letters, 5 (2011) 1075–1084.
[7] S. Konstantopoulos, E. Fauster, R. Schledjewski, Monitoring the production of FRP composites: A review of in-line sensing methods, Express Polymer Letters, 8 (2014) 823–840.
[8] B. Glisic, D. Inaudi, Fibre optic methods for structural health monitoring, John Wiley & Sons Ltd., New York, 2007.
[9] H. Guo, G. Xiao, N. Mrad, J. Yao, Fiber optic sensors for structural health monitoring of air platforms, Sensors, 11 (2011) 3687–3705.
[10] R. Di Sante, Fibre optic sensors for structural health monitoring of aircraft composite structures:
Recent advances and applications, Sensors, 15 (2015) 18666-18713.
[11] K. Shivakumar, L. Emmanwori, Mechanics of failure of composite laminates with an embedded fiber optic sensor, Journal of Composite Materials, 38 (2004) 669–680.
[12] J. Szakács, L. Mészáros, Effect of fiber contents on fatigue behavior of injection molded polyamide 6 matrix composites, Period. Polytech. Mech. Eng., 61 (2017) 6–10.
[13] M.U. Saeed, B.B. Li, Z.F. Chen, S. Cui, Self-healing of low-velocity impact and mode-I delamination damage in polymer composites via microchannels, Express Polymer Letters, 10(4) (2016) 337-348.
[14] M.F. Muñoz-Vélez, A. Valadez-González, P.J. Herrera-Franco, Effect of fiber surface treatment on the incorporation of carbon nanotubes and on the micromechanical properties of a single-carbon fiber- epoxy matrix composite, Express Polymer Letters, 11(9) (2017) 704-718.
[15] G. Hegedűs, T. Sarkadi, T. Czigány, Light transmission characteristic of reinforcing glass fibres used in polymer composites, Materials, 10(6) (2017) 637 p9.
[16] R.M. Crane, J. Gagorik, Fiber optics for a damage assessment system for fiber reinforced plastic composite structures, Quantitative NDE, 28 (1984) 1419-1430.
[17] N.D.W. Glossop, S. Dubois, W. Tsaw, M. Leblanc, J. Lymer, R.M. Measures, R.C. Tennyson, Optical fibre damage detection for an aircraft composite leading edge, Composites, 21 (1990) 71-80.
[18] M. LeBlanc, R.M. Measures, Impact damage assessment in composite materials with embedded fibre-optic sensors, Composites Engineering, 2 (1992) 573-596.
[19] A. Chinpon, K. Thamaphat, M. Hansuparnusorn, P. Limsuwan, A force measurement method using the optical fibre beam, Procedia Engineering, 32 (2012) 989-993.
[20] F. Luo, J. Liu, N. Maa, T.F. Morse, A fiber optic microbend sensor for distributed sensing application in the structural strain monitoring, Sensors and actuators A: Physical, 75 (1999) 41-44.
[21] H. Hu, S. Sun, R. Lv, Y. Zhao, Design and experiment of an optical fiber micro bend sensor for respiration monitoring, Sensors and Actuators A: Physical, 251 (2016) 126-133.
[22] N. Takeda, Characterization of microscopic damage in composite laminates and real-time monitoring by embedded optical fiber sensors, International Journal of Fatigue, 242 (2002) 281-289.