Quarterly Report on Inflation
- update -
Published by the Magyar Nemzeti Bank
Publisher in charge: Judit Iglódi-Csató, Head of Communications 1850 Budapest, 8–9 Szabadság tér
www.mnb.hu
ISSN 1419-2926 ISSN 1585-020X (online)
Act LVIII of 2001 on the Magyar Nemzeti Bank, which entered into effect on 13 July 2001, defines the primary objective of Hungary’s central bank as the achievement and maintenance of price stability. Low inflation allows the economy to function more effectively, contributes to better economic growth over time and helps to moderate cyclical fluctuations in output and employment.
In the inflation targeting system, from August 2005 the Bank seeks to attain price stability by ensuring an inflation rate near the 3 per cent medium term objective. The Monetary Council, the supreme decision-making body of the Magyar Nemzeti Bank, performs a comprehensive review of the expected development of inflation every three months, in order to establish the monetary conditions consistent with achieving the inflation target. The Council’s decision is the result of careful consideration of a wide range of factors, including an assessment of prospective economic developments, the inflation outlook, money and capital market trends and risks to stability.
In order to provide the public with clear insight into the operation of monetary policy and to enhance transparency, the Bank publishes the information available at the time of making its monetary policy decisions. The Report presents the inflation forecasts prepared by the Economic Analysis and Research and Financial, as well as the macroeconomic developments underlying these forecast. The Report is published biannually, with partial updates to the forecasts also prepared twice a year. The forecasts of the Economic Analysis and Research and Financial Analysis are based on certain assumptions. Hence, in producing its forecasts, the Directorate assumes an unchanged monetary and fiscal policy. In respect of economic variables exogenous to monetary policy, the forecasting rules used in previous issues of the Report are applied.
The analyses in this Report were prepared by staff in the MNB’s Economic Analysis and Research and Financial Analysis Department under the general direction of Ágnes Csermely, Director. The project was managed by Mihály András Kovács,Deputy Head of Economic Analysis, with the help of Zoltán Gyenes, and Barnabás Virág. The Report was approved for publication by Ferenc Karvalits, Deputy Governor.
Primary contributors to this Report also include: Péter Bauer, Szilárd Benk, Győző Eppich, Péter Gál, Zoltán Gyenes, Áron Horváth, Éva Kaponya, András Komáromi, Mihály András Kovács, Zsolt Lovas, Zsuzsa Munkácsi, Benedek Nobilis, György Pulai, Róbert Szemere, Tímea Várnai, Barnabás Virág. Other contributors to the analyses and forecasts in this Report include various staff members of the Economics Analysis and Research and the Financial Analysis and the Financial Stability Department.
The Report incorporates valuable input from the Monetary Council’s comments and suggestions following its meetings on 11 February and 25 February 2008. The projections and policy considerations, however, reflect the views of staff in the Economics Analysis and Research and the Financial Analysis Department and do not necessarily reflect those of the Monetary Council or the
Contents
Overview 4
1 Latest developments at the macroeconomic level 8
1. 1 Questiontable signs of a turnaround in economic growth 8 1. 2 Uncertainty about the slowdown in European economic activity 10 1. 3 A further fall in whole-economy investment 11
1. 4 Declining consumption demand 13
1. 5 Labour market: wage adjustment and initial signs of employment adjustment 14 1. 6 Acceleration instead of deceleration in year-end inflation data 21
2 Financial markets 24
3 Inflation and real economic prospects 31
3. 1 Deteriorating real economy prospects 32
3. 2 Further improvement in our forecast for external balance 34
3. 3 Higher inflation projection due mainly to the increase in energy costs 35 3. 4 Inflationary and growth risks 36
4 Evaluation of our inflation forecast for 2007 39
Overview
In the February update, the central projection is for inflation to be above target throughout the entire forecast period
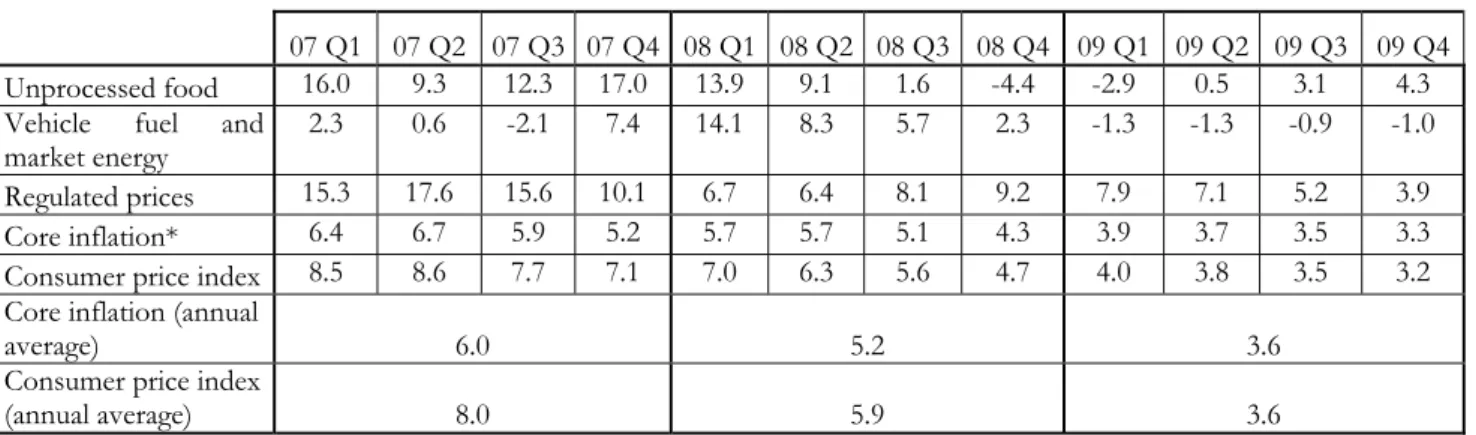
The February central projection, which is based on the assumption that the January monetary conditions, i.e. an exchange rate of EUR/HUF 256 and a base rate of 7.5%, remain constant, is for inflation to be around 6% in 2008 and slightly below 4% in 2009.
Economic growth is expected to be 2% this year, before gradually edging up to approximately 3% in 2009.
Overall, the risks around the central projection to inflation are broadly balanced, while those to growth are on the downside. A potentially stronger-than-expected slowdown in the global business cycle, causing international commodity prices to fall, poses a downside risk to both inflation and growth. In addition, inflation may be lower than the central projection if the disinflationary effects of the slowdown in domestic economic activity are greater than expected. However, if expectations become stuck above the inflation target, this could pose an upside risk to inflation.
There appears to be increasingly more marked adjustment in the labour market in order to restore corporate profitability
Earlier Reports stressed the importance of wage adjustment in the context of meeting the inflation targets. According to more recent data, firms are increasingly adjusting through their wage and price decisions, in order to avert further deterioration in profit margins.
The increase in skilled workers’ minimum wage in early 2008 will hinder this moderation in the rate of wage growth, but the need to adjust will be underlined by weaker-than-expected business conditions. Consequently, despite of a fall in the number of employees, real wages are expected to grow slightly in 2008.
Growth prospects are worse looking forward…
Expectations of businesses and households suggest that economic agents anticipate an increasingly sluggish recovery in domestic economic activity. The deteriorating outlook for growth in developed economies is casting a shadow over the prospects of the Hungarian export sector; and, on the other hand, improvement in domestic activity remains uncertain, due to the absence of a turnaround in retail sales and investment.
The subdued pace of real wage growth, coupled with a fall in employment, is likely to drag on household consumption growth.
The outlook for investment has deteriorated recently, due to weakening external and domestic business conditions, as well as rises in credit spreads. In addition, the slower-than-expected growth of Hungary’s external markets is a negative factor with regard to the outlook for the country’s export sector. Overall, the economy is likely to pick-up at a very slow pace.
over the entire forecast period. But, looking forward, the further improvement in external imbalance, in combination with subdued investment spending and economic growth, may pose a risk to longer-term sustainability.
...and rising energy prices are likely force firms to raise prices more than expected over the entire forecast period
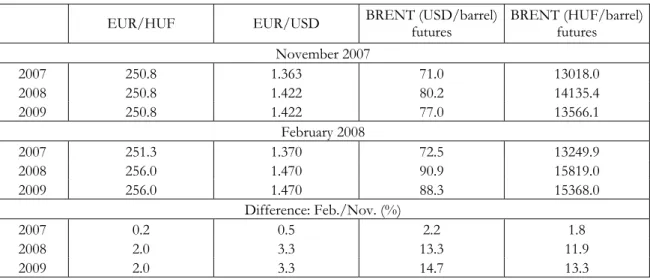
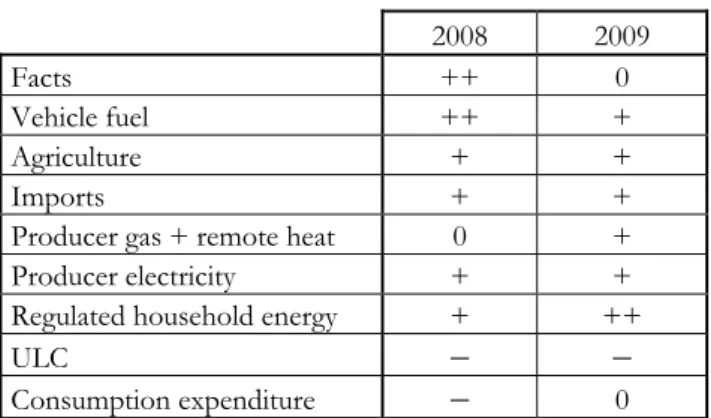
Despite a general loosening in labour market conditions and lower aggregate demand, inflation prospects have also deteriorated since November. One explanation for this is that, after a series of adverse cost shocks since the summer of 2006 (increases in tax and contribution rates as well as hikes in administered prices, linked to the fiscal adjustment measures, and then, from the summer of 2007, the sharp rise in unprocessed food prices), firms are currently facing more upward pressure on costs. The sharp rises in energy costs have both international and domestic origins. Imported inflation has risen due to the historically high price of crude oil, while the stronger- than-expected upward pressure from electricity prices due to changes in regulations is a shock of domestic origin. Prices are likely to rise more strongly than previously thought, due to (i) the high rate of increase in energy costs; and (ii) the accumulation of adverse cost shocks over the past two years.
Inflation fan chart
-1 0 1 2 3 4 5 6 7 8 9 10
05:Q1 05:Q2 05:Q3 05:Q4 06:Q1 06:Q2 06:Q3 06:Q4 07:Q1 07:Q2 07:Q3 07:Q4 08:Q1 08:Q2 08:Q3 08:Q4 09:Q1 09:Q2 09:Q3 09:Q4
Per cent
-1 0 1 2 3 4 5 6 7 8 9
10 Per cent
GDP projection
0 1 2 3 4 5 6
05:Q1 05:Q2 05:Q3 05:Q4 06:Q1 06:Q2 06:Q3 06:Q4 07:Q1 07:Q2 07:Q3 07:Q4 08:Q1 08:Q2 08:Q3 08:Q4 09:Q1 09:Q2 09:Q3 09:Q4
Per cent
0 1 2 3 4 5 6 Per cent
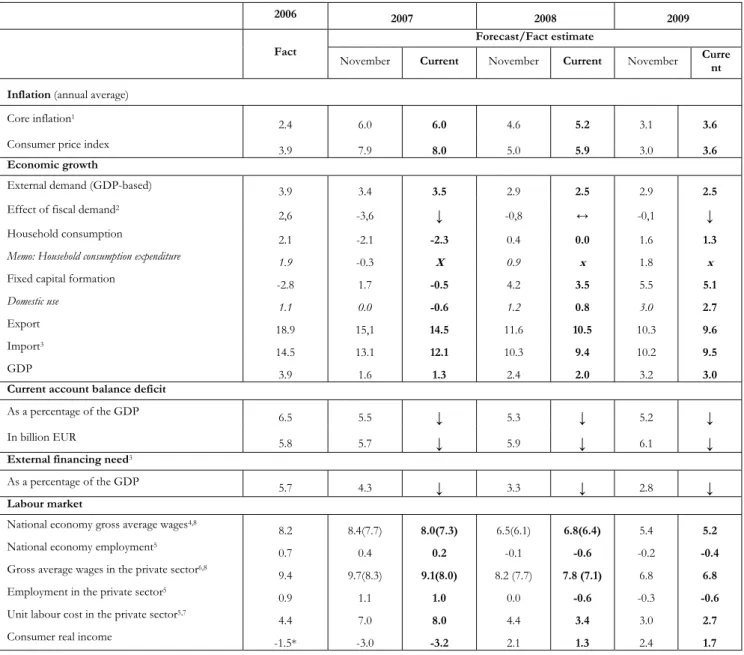
Summary table of the central projection
(The forecasts are conditional: the main scenario represents the most probable scenario which applies only if all the assumptions presented in chapter 3 materialise; unless otherwise specified, percentage changes on
previous year.)
2005 2006 2007 2008 2009 Actual Projection Inflation (annual average)
Core inflation1 2.2 2.4 6.0 5.2 3.6
Consumer price index 3.6 3.9 8.0 5.9 3.6
External demand (GDP-based) 2.1 3.9 3.5 2.5 2.5
Fiscal impact on demand2 -0.9 2.6 ↓ ↔ ↓
Household consumption 3.6 2.1 -2.3 0.0 1.3
Gross fixed capital formation 5.3 -2.8 -0.5 3.5 5.1
Domestic absorption 1.3 1.1 -0.6 0.8 2.7
Exports 11.5 18.9 14.5 10.5 9.6
Imports3 6.8 14.5 12.1 9.4 9.5
GDP 4.1 (4.3)* 3.9 (4.0)* 1.3 2.0 3.0
Current account deficit
As a percentage of GDP 6.8 6.5 ↓ ↓ ↓
EUR billions 6.0 5.8 ↓ ↓ ↓
External financing requirement
As a percentage of GDP 6.0 5.7 ↓ ↓ ↓
Labour market
Whole-economy gross average
earnings4, 8 8.8 8.2 8.0(7.3) 6.8(6.4) 5,2
Whole-economy employment5 0.0 0.7 0,2 -0,6 -0,4
Private sector gross average earnings6 6.9 9.4 9,1(8,0) 7,8 (7,1) 6,8 Private sector employment 5,8 0.3 0.9 1,0 -0,6 -0,6 Unit labour costs in the private
sector5,7 2.8 4.4 8,0 3,4 2,7
Household real income 3.6 -1.5** -3,2 1,3 1,7
1 For technical reasons, this indicator may temporarily differ from the index published by the CSO; over the longer term, however, it follows a similar trend.
2 Calculated from the augmented (SNA) balance; a negative value means a narrowing of aggregate demand. 3 As a result of uncertainty in the measurement of foreign trade statistics, from 2004 the actual import figure and current account deficit/external financing requirement may be higher than suggested by official figures or our projections based on such figures. 4 Calculated on a cash basis. 5 According to the CSO LFS data. 6 Data including the effect of whitening, consistent with headline CSO data. 7 Private sector unit labour cost calculated with wage indicator excluding the effect of whitening and the changed seasonality of bonuses. 8 For 2008 wages, the numbers in brackets refer to wages excluding the effect of whitening and the changed seasonality of bonuses, which are directly comparable with those in the November Report.
* Data adjusted for working-day variations are shown in brackets.,** MNB estimate.
↑ We are of the opinion that this particular forecast is expected to be higher than what is contained in the November 2007 Report.
↓ We are of the opinion that this particular forecast is expected to be lower than what is contained in the November 2007 Report.
↔ We are of the opinion that this particular forecast is expected to be about the same as what is contained in the November 2007 Report.
1 Latest developments at the macroeconomic level
1. 1 Questiontable signs of a turnaround in economic growth
GDP data for Q3 2007 have reinforced our earlier expectations that the deceleration in economic growth may have bottomed out in the second quarter. However, while we previously expected a marked domestic recovery in the second half of last year as the primary effects of the fiscal measures wore off, the data on economic activity and expectation surveys since November indicate that the negative effects of adjustment may persist longer than expected. The estimate for Q4 GDP growth also support this view.
Preliminary data indicate 0.7% year-on-year growth in the final quarter (data adjusted for working day and calendar effects), after 1% in previous period, and the quarterly growth rates stagnated below 1%.
Chart 1-1 Change in business confidence indicators Three-month rolling averages
-40 -30 -20 -10 0 10 20 30
1996/Jan/ 1996/Jul/ 1997/Jan/ 1997/Jul/ 1998/Jan/ 1998/Jul/ 1999/Jan/ 1999/Jul/ 2000/Jan/ 2000/Jul/ 2001/Jan/ 2001/Jul/ 2002/Jan/ 2002/Jul/ 2003/Jan/ 2003/Jul/ 2004/Jan/ 2004/Jul/ 2005/Jan/ 2005/Jul/ 2006/Jan/ 2006/Jul/ 2007/Jan/ 2007/Jul/ 2008/Jan/ Balance
-40 -30 -20 -10 0 10 20 30
Balance
Services Trade Construction Manufacturing
Source: EUROSTAT
Chart 1-2 Economic growth in Hungary*
Quarterly data, quarterly growth based on seasonally adjusted data
0 1 2 3 4 5 6 7
96 Q1 96 Q3 97 Q1 97 Q3 98 Q1 98 Q3 99 Q1 99 Q3 00 Q1 00 Q3 01 Q1 01 Q3 02 Q1 02 Q3 03 Q1 03 Q3 04 Q1 04 Q3 05 Q1 05 Q3 06 Q1 06 Q3 07 Q1 07 Q3
Per cent
0 1 2 3 4 5 6 Per cent 7
Annual growth Annualized quarterly growth
* Latest data is a preliminary estimation of CSO
Economic growth has been driven primarily by the export-oriented manufacturing sector.
As import growth has remained moderate due to falling domestic demand, external trade made a historically strong contribution to growth through net exports. In respect of domestic factors, household consumption dropped further in the second half of the year, as a result of continuously worsening household income prospects (recent pick-up in inflation, declining employment). In addition, changes in construction production indicate that no significant turning point can be expected in investment despite the considerable amount of EU funds received. At the same time, slack government demand and a decline in agricultural production generated a negative growth contribution.
1. 2Uncertainty about the slowdown in European economic activity The past quarter saw an increasing deterioration in the prospects for global activity. The financial turbulence originating from the sub-prime mortgage market in the USA may cause a considerable setback for the US economy which, in turn, may have a negative effect on the European economic outlook. Nevertheless, the latest statistical data on European economic growth do not indicate a significant deceleration. While euro area and German industrial activity slowed in Q4 2007, the growth rate remained at historically high levels.
Chart 1-3 German industrial production and new export orders Annual change calculated from trend
-1 0 -5 0 5 1 0 1 5 2 0 2 5
1997/Mar/ 1997/Jun/ 1997/Sep/ 1997/Dec/ 1998/Mar/ 1998/Jun/ 1998/Sep/ 1998/Dec/ 1999/Mar/ 1999/Jun/ 1999/Sep/ 1999/Dec/ 2000/Mar/ 2000/Jun/ 2000/Sep/ 2000/Dec/ 2001/Mar/ 2001/Jun/ 2001/Sep/ 2001/Dec/ 2002/Mar/ 2002/Jun/ 2002/Sep/ 2002/Dec/ 2003/Mar/ 2003/Jun/ 2003/Sep/ 2003/Dec/ 2004/Mar/ 2004/Jun/ 2004/Sep/ 2004/Dec/ 2005/Mar/ 2005/Jun/ 2005/Sep/ 2005/Dec/ 2006/Mar/ 2006/Jun/ 2006/Sep/ 2006/Dec/ 2007/Mar/ 2007/Jun/ 2007/Sep/ 2007/Dec/
Pe r cent
-4 .0 -2 .0 0 .0 2 .0 4 .0 6 .0 8 .0 1 0 .0 P e r ce nt
Indu stria l prod uction
E xport orders of m anu fa ctu ring w ork ing on orde rs (e xc luding tra nsportation) M a nufac turing w ork ing on orders (exclu ding transporta tion)
Source: EUROSTAT
At the same time, the growth of industrial production in Hungary has been slowing since the middle of last year. The reason for this drop in growth is a gradual slowdown in export sales, which could not be counterbalanced even by the rise in domestic sales which started from the second half of the year. This increase in domestic sales was not caused by a recovery but by a one-off factor: higher sales in the energy industry (electricity, gas, steam and water supply).
Decelerating production ahead of the euro area industrial slowdown seems to be a general tendency in the region. This apparent contradiction can be explained by the fact that, as we indicated in our previous Reports, the region’s industrial exports consist mainly of intermediary goods and therefore are linked to an early phase of the European vertical chain of production. Hence, it may be possible that deceleration in the region precedes a decline of industrial production in Western Europe to a certain extent. However, in the case of Hungary, subdued investment growth may be limiting foreign sales from the capacity side as well.
Chart 1-4 Industrial production in the region and the euro area Annual change calculated from trend
-5.0 0.0 5.0 10.0 15.0 20.0
Mar-01 Jun-01 Sep-01 Dec-01 Mar-02 Jun-02 Sep-02 Dec-02 Mar-03 Jun-03 Sep-03 Dec-03 Mar-04 Jun-04 Sep-04 Dec-04 Mar-05 Jun-05 Sep-05 Dec-05 Mar-06 Jun-06 Sep-06 Dec-06 Mar-07 Jun-07 Sep-07 Dec-07
Per cent
-5.0 0.0 5.0 10.0 15.0 Per cent 20.0
Czech Republic Poland Hungary Euro zone Németország Slovakia
Source: EUROSTAT.
After an upturn in the middle of the year, growth in exports of goods and services slowed down. Due to weak domestic demand, however, a more significant drop was recorded in imports. As a result, net exports continued to be the only positive factor behind economic growth. As Hungarian exports are increasingly linked to Central and Eastern European countries where economic growth is faster-paced, and because there is no indication yet of a significant deceleration of economic activity in Europe, we do not expect a major downturn in export dynamics over the short run.
1. 3A further fall in whole-economy investment
Although 2007 saw a slight turnaround following a substantial decline in the previous year, the latest investment data appear to be less favourable than expected.1 Furthermore, orders and construction industry production data indicate that no quick upturn can be expected in investment. The reason for the considerable decline in construction industry production is a drop in government investment and infrastructure construction, mainly due to the fiscal austerity package, and, to a lesser extent, to unfavourable tendencies in the real estate market.
The distribution of investment by sectors continues to be extremely heterogeneous:
investment grew in export-oriented manufacturing, while investment activity declined in other sectors. Moreover, contrary to the pick-up in the business cycle, the increase in manufacturing, primarly machinery investment is mainly attributable to a large investment in one sector, the rubber industry, which means that the investment growth is not widespread throughout the sector. Apart from this sub-sector, our estimates suggest that
1 Instead of gross fixed capital formation data according to GDP statistics, our analyses rely on detailed sectoral investment data. In our view only the latter can provides information about the extremely heterogeneous sectoral investment tendencies.
manufacturing investment growth will be weaker than in earlier periods of upturn in Europe. Thus, growth in manufacturing – especially in the export-oriented sectors – can only be accomplished if capacity utilisation reaches a historic peak.
Chart 1-5 Investment and capacity utilisation in manufacturing Annual change
-20 -10 0 10 20 30 40 50 60 70 80
96:Q1 96:Q3 97:Q1 97:Q3 98:Q1 98:Q3 99:Q1 99:Q3 00:Q1 00:Q3 01:Q1 01:Q3 02:Q1 02:Q3 03:Q1 03:Q3 04:Q1 04:Q3 05:Q1 05:Q3 06:Q1 06:Q3 07:Q1 07:Q3 yearly change (%)
60 65 70 75 80 85 90
level (%)
Import based external demand Manufacturing Manufacturing (corrected)* Capacity utilisation
* Investment data adjusted for a one-off effect in the rubber industry.
Companies providing products and services mostly for the domestic market clearly exhibited weak investment activity, the primary reason for which was a decline in domestic demand due to the fiscal adjustment and expectations which continue to be unfavourable.
Housing investment, which represents one-quarter of all economic investment, continued on the downward path which started at the beginning of 2005 without any significant adjustment. The upturn experienced in the first half of 2007 is expected to be temporary.
Developments in real household income, household expectations, which have not any shown significant improvement, and a slowdown in credit-growth also seem to support this expectation.
The downturn in investment – as a result of budgetary consolidation – was strongest in the government sector. Funds from EU funds have not yet produced an upturn, but this year’s statistics may indicate how they are used and accounted for.
Chart 1-6 Investment in various sectors of the national economy*
Four-quarter rolling average
-15 -10 -5 0 5 10 15 20 25 30
00:Q1 00:Q3 01:Q1 01:Q3 02:Q1 02:Q3 03:Q1 03:Q3 04:Q1 04:Q3 05:Q1 05:Q3 06:Q1 06:Q3 07:Q1 07:Q3 year on year index (%)
-15 -10 -5 0 5 10 15 20 25 30
year on year index (%)
Non-tradeable** Public and quasi fiscal*** Real estate
* Annual average volume indices are weighted averages of four consecutive year-on-year volume indices, where weights are base period current price values.
**Excluding energy, transport and other social, community and personal services.
*** Including energy, transport and other social, community and personal services.
1. 4Declining consumption demand
In line with the assumptions of the latest Report, household consumption expenditures declined less strongly than real income in the second half of 2007. This means that households attempted to counterbalance the effects of the drop in real income partly by taking out loans and by relying on previous savings.
Surprisingly, however, the data indicate that no significant change occurred in the consumer confidence indicator or the annual dynamics of retail sales. Therefore there may be no considerable turning point in household demand, or it may occur later than expected.
On the income side, a change in real wages that appears to be more unfavourable than previously thought (re-accelerating inflation, a decrease in employment) as well as the unfavourable long-term income outlook render our expectations concerning the strength of the turning point rather uncertain.
Chart 1-7 Development of retail sales and the GKI consumer confidence indicator Annual change
-10.0 -7.5 -5.0 -2.5 0.0 2.5 5.0 7.5 10.0 12.5 15.0 17.5 20.0
Jan 2001 Apr Jul Oct Jan 2002 Apr Jul Oct Jan 2003 Apr Jul Oct Jan 2004 Apr Jul Oct Jan 2005 Apr Jul Oct Jan 2006 Apr Jul Oct Jan 2007 Apr Jul Oct Jan 2008
Percent (annual changes)
-55 -50 -45 -40 -35 -30 -25 -20 -15 -10 -5 0 5
Balance
Retail sales Real net wages GKI household confidence indicator (right scale)
1. 5Labour market: wage adjustment and initial signs of employment adjustment
The November Report assumed that over the short-term companies – especially in the service sector – will attempt to restore profitability by limiting their bonus payments. As for long-term adjustment, we assumed that profit would be regained mostly by reducing wage payments and, to a lesser extent, by reducing employment. Moreover, we assumed that while companies would be able to arrest the decline in profits, they would not be able to gain a profit on labour comparable to levels before the implementation of the fiscal austerity package.
Chart 1-8 Wage development in private sector*
Annual change
4 5 6 7 8 9 10 11 12 13 14
2004/ Mar 2004/ Jun 2004/ Sep 2004/ Dec 2005/ Mar 2005/ Jun 2005/ Sep 2005/ Dec 2006/ Mar 2006/ Jun 2006/ Sep 2006/ Dec 2007/ Mar 2007/ Jun 2007/ Sep 2007/ Dec
Per cent
4 5 6 7 8 9 10 11 12 13
14 Per cent
Wages in private sector Wages corrected by whitening effect
* Bonuses were redistributed according to their historical seasonality if there were shifts in pay-offs between month..
The data received since the last Report corroborated our hypothesis of adjustment through bonuses, because bonus payments have fallen over the past four months. A favourable development from the point of view of inflation is that wage adjustment via the reduction of bonus payments was especially strong in the market service sector. So far, there seems to be no slowdown in regular wage growth, neither in the month-on-month index nor in the year-on-year index. However – in keeping with our earlier assumptions – this may only be possible when wages are set for this year. Overall wage adjustment in gross average earnings was stronger than our previous expectation.
Chart 1-9 Change in bonus payments*
Annual change
-20 -15 -10 -5 0 5 10 15 20 25 30
2005/ Mar 2005/ Jun 2005/ Sep 2005/ Dec 2006/ Mar 2006/ Jun 2006/ Sep 2006/ Dec 2007/ Mar 2007/ Jun 2007/ Sep 2007/ Dec
%
Manufacturing Private sector Services
* Bonuses were redistributed according to their historical seasonality if there were shifts in pay-offs between month..
Box 1-1 Effect of OÉT (National Interest Reconciliation Council) agreements on wages The National Interest Reconciliation Council (OÉT) agreed on raising gross wages by 5.0- 7.5 percentage points on average in 2008. This box looks at the extent to which this agreement may be consistent with the MNB’s wage forecast for 2008. In addition, we will briefly address the representative force of the agreements and will look at the extent to which agreements in the past provided information about actual wage increases.
In Hungary, the process of wage negotiations is decentralised in nature. Wage agreements concluded by OÉT are not mandatory and serve primarily as a guideline. The representative force of participating employee interest representation bodies is low by European standards.2 Therefore, it is not surprising that based on the micro data agreements do not seem to have a strong supportive effect for wages.3
Chart 1-10 Collective bargaining coverage and the proportion of employees in unions in Europe
0 10 20 30 40 50 60 70 80 90 100
Austria Belgium Slovenia Portugal France Sweden Finnland Netherlands Greece Spain Denmark Italy Cyprus Germany Luxembourg Malta Czech Republic Slovakia Poland United Kingdom Bulgaria HUNGARY Estonia Latvia Lithuania
%
Collective bargaining coverage Proportion of employees in unions
Source: ETUI-REHS.
Nevertheless, it is interesting to note that actual wage increases in the past correlated with the agreements, although this may be so purely because the negotiating interest representation bodies were adequately informed.4
4 The members of the OÉT, and corporate leaders, responsible for private wage policy, may have similar view on macroeconomic processes.
Chart 1-11 OÉT wage agreements and gross wages
0 1 2 3 4 5 6 7 8 9 10 11 12 13 14 15
2000 2001 2002 2003* 2004 2005 2006 2007(t) 2008
Per cent
0 1 2 3 4 5 6 7 8 9 10 11 12 13 14 15 Per cent
Bias Minimum wage effect Gross wage OÉT band OÉT median
Gross wages: time series adjusted with the effect of the minimum wage and of efforts to "whiten" the economy (i.e. to make it transparent); deviations as a percentage of the agreed amount; *: the wage agreement of 2003 pertained to net real wages; here we projected deviations from it to gross real wages; (t): fact estimate.
In addition to the correlation, it is apparent that gross wage increases in the past were always higher than the median value of the band proposed by the OÉT. After 2000 the difference stood at around 1.0–2.5%, but in some years the difference was clearly higher.
This consistently positive difference can be explained in several ways: partly by statistics and partly by how wages are determined.
Statistical distorting factors
- A distortion of this kind may be caused in part by changes in the composition of workplaces.
The diminishing weight of low-wage sectors and an increase in the number of white collar workers have raised the wage index by an average of 0.5 per cent each year since 2002. In addition, the composition of workers within sectors may also have changed.
- Deferred effect: Because wage increases occur all year round and not only in January, the annual average wage in each year is affected by wages in the previous year as well. In addition to the fact that wage dynamics typically fell up until the middle of the decade, this deferred effect reduced average wages in the base year to a greater extent than in the year concerned, and thus distorted annual indexes upward compared to actual increases.
The effect of how wages are determined
- Increases in the minimum wage: Distortion was stronger in years when the minimum wage was raised significantly. Consequently, we assume that the wage increase proposed in the agreement between the parties was understood as a proposal pertaining to wages that were
recommendation for the wage increase rate that is to take place at the beginning of the year. As wage raises became less and less frequent, this effect naturally lost its force.
- Unexpected shocks: The deviation can also be explained by unexpected shocks that occur in the course of the year (productivity, inflation, etc.). The available data indicate that this effect is also more apparent in the bonuses, which are easier to change in the course of the year, than in the more inflexible regular wage component.5 Growth in regular wages correlates to the OÉT proposal to a greater extent than the total wage index. The difference due to a change in bonuses correlates with labour-related profit dynamics.
In the case of the wage agreement for 2008, two factors may result in significant deviation from past experience. On the one hand, the raise in the guaranteed minimum wage in January 2008 might increase the gap: we estimate its additional wage-increasing effect in the range of approximately 0.5-1.9%, with a high degree of uncertainty.6 On the other hand, the gap may be further reduced, as companies may be less likely to deviate upwards from the agreement amidst unfavourable economic conditions. Nevertheless, based on the aforementioned reasoning, we assume that actual wage increases will approximate the upper limit of the OÉT agreement rather than fall in the middle band which, overall, confirms our wage forecast for 2008.
Employment in the private sector decreased amongst companies employing more than 5 persons, while the LFS survey, which includes small enterprises as well, indicates stagnation. Sectoral data indicate that the differences in tendencies can be explained by changes in the number of employees in one sector, namely the construction industry. In manufacturing – in line with slower production – the number of employees fell somewhat in the second half of the year. The market service sector, which experienced a higher rate of profit loss, also showed the first signs of employment adjustment in Q3 2007. The increasing employment trend of the past years has been clearly broken in this segment and employment numbers have started to stagnate. On the other hand, the number of working hours reached a historic low point, possibly also indicating that a drop in the number of employees will occur at an earlier date than suggested in our forecast.
5 Data pertaining to regular wage components have been available only since 2003.
6 We assume that the average wages of employees who are affected by an increase of the guaranteed minimum wage would have increased at a rate corresponding to the median value of the OÉT agreement, had it not been for this measure. High uncertainty is caused by the difference between macro and micro level estimates.
Chart 1-12 Employment in the private sector
2700 2750 2800 2850 2900 2950 3000 3050 3100 3150 3200
98:Q0
Q3 Q4 Q1
99:Q1
Q2 Q3 Q4
00:Q1
Q2 Q3 Q4
01:Q1
Q2 Q3 Q4
02:Q1
Q2 Q3 Q4
03:Q1
Q2 Q3 Q4
04:Q1
Q2 Q3 Q4
05:Q1
Q2 Q3 Q4
06:Q1
Q2 Q3 Q4
07:Q1
Q2 Q3
Thousand people
1,700 1,750 1,800 1,850 1,900 1,950 2,000
Thousand people
Employment (LFS) Employment (institutional statistics)
Government employment has been declining continuously in the last few months, and as a result labour usage stood at a historically low level. Overall, flow data at the level of the national economy also corroborate our previous expectations regarding the loosening of the labour market. A decrease in active workers at the beginning of the year gave way to stagnation. Consequently, a drop in the number of employees in the second half of the year resulted in an increase in unemployment. Due two the formerly mentioned factors, the
‘tightness measure’ decreased further.
Chart 1-13 Development of tightness indicators
4 6 8 10 12 14 16 18 20 22
95:Q1 Q3 96:Q1 Q3 97:Q1 Q3 98:Q1 Q3 99:Q1 Q3 00:Q1 Q3 01:Q1 Q3 02:Q1 Q3 03:Q1 Q3 04:Q1 Q3 05:Q1 Q3 06:Q1 Q3 07:Q1 Q3
Per cent
4 6 8 10 12 14 16 18 20
22 Per cent
Tightness indicator (LFS statistics) Tightness indicator (registered unemployed)
1. 6Acceleration instead of deceleration in year-end inflation data
In Q4 2007, inflation and core inflation moderated somewhat according to previous quarter data. Inflation and core inflation declined from 7.7% to 7.1%, and from 5.1% to 4.7%, respectively. Even so, both indicators remained at a higher level than indicated in our short-term projection.7 In addition, according to monthly data both indicators show a re- acceleration of inflationary processes after October. The clear reason for this is an increase in the price of processed foods. The global food-price shock caused inflationary pressure not only in Hungary, but in the region and in the euro area during the last four months of 2007.
Chart 1-14 Consumer price index in region Annual change
-1 0 1 2 3 4 5 6 7 8 9 10
Jan-02 Mar-02 May-02 Jul-02 Sep-02 Nov-02 Jan-03 Mar-03 May-03 Jul-03 Sep-03 Nov-03 Jan-04 Mar-04 May-04 Jul-04 Sep-04 Nov-04 Jan-05 Mar-05 May-05 Jul-05 Sep-05 Nov-05 Jan-06 Mar-06 May-06 Jul-06 Sep-06 Nov-06 Jan-07 Mar-07 May-07 Jul-07 Sep-07 Nov-07
Per cent
-1 0 1 2 3 4 5 6 7 8 9 Per cent 10
Poland Slovakia Czech Republic Eurozone Hungary
Source: EUROSTAT
The end of the year saw positive changes in the price of foods, and this development was the major cause of inflation in the past six months. The price level of unprocessed foods no longer increased starting from November. This may be an indication that the first large wave of the agricultural price shock had an impact on inflation. However, with regard to processed foods, which represent a greater weight in the index, prices increased at a higher rate than expected each month, and so far no significant change can be expected in the time series. Nonetheless, according to our expectations change will begin to appear as well as in this group in early 2008, and it is possible that excess global demand for agricultural items may result in a change in the historical correlation between processed and unprocessed food prices.
7 In line with our expectations the January data show moderate deceleration in inflation, but the price changes of processed food exceeded our short-term projection.
Chart 1-15 Inflation trend and the price of processed foods*
Seasonally adjusted, annualised monthly change
-15.0 -10.0 -5.0 0.0 5.0 10.0 15.0 20.0 25.0 30.0 35.0
Jan-02 Apr-02 Jul-02 Oct-02 Jan-03 Apr-03 Jul-03 Oct-03 Jan-04 Apr-04 Jul-04 Oct-04 Jan-05 Apr-05 Jul-05 Oct-05 Jan-06 Apr-06 Jul-06 Oct-06 Jan-07 Apr-07 Jul-07 Oct-07 Jan-08
Per cent
-30.0 -20.0 -10.0 0.0 10.0 20.0 30.0 40.0 50.0 60.0 Per cent 70.0
Processed (left scale) Non-processed (right scale)
* Excluding effects of VAT changes.
The inflation of goods and market services was in line with our expectations. In 2007, the annualised quarterly price increase of market services, adjusted for VAT and visit fee effects, stood at 6 per cent while in the case of manufactured products this indicator showed a moderate decline8.
Chart 1-16 Inflation of market services* and manufactured products**
Annual change
-2 0 2 4 6 8 10 12 14
Jan-01 May-01 Sep-01 Jan-02 May-02 Sep-02 Jan-03 May-03 Sep-03 Jan-04 May-04 Sep-04 Jan-05 May-05 Sep-05 Jan-06 May-06 Sep-06 Jan-07 May-07 Sep-07 Jan-08
Per cent
-2 0 2 4 6 8 10 12 Per cent 14
Inflationary gap between goods and market services Goods Market services
* Excluding effects of VAT changes and the introduction of visit fee.
** Excluding effects of VAT changes.
The 12-month forward-looking inflation expectations of households remained stable in Q1 2008, after a significant increase in Q4 2007. Perceived inflation in the last 12 months rose further. Both indicators are at historically high levels. However, there is a positive development in that inflation expectations no longer exceed perceived inflation.
Chart 1-17 Perceived and expected inflation of households Annual change
0.0 2.5 5.0 7.5 10.0 12.5 15.0 17.5 20.0 22.5 25.0
02:Q2 02:Q3 02:Q4 03:Q1 03:Q2 03:Q3 03:Q4 04:Q1 04:Q2 04:Q3 04:Q4 05:Q1 05:Q2 05:Q3 05:Q4 06:Q1 06:Q2 06:Q3 06:Q4 07:Q1 07:Q2 07:Q3 07:Q4 08:Q1
Per cent
0.0 2.5 5.0 7.5 10.0 12.5 15.0 17.5 20.0 22.5 25.0 Per cent
Perceived inflation Expected inflation Actual inflation
2 Financial markets
Market sentiment in recent months, and consequently the price of domestic assets, was determined by the market expectations related to the losses in the US sub-prime mortgage lending market, the slowdown in the US economy and the reaction of the central banks.
Since the November Report, overall business confidence and investors’ risk tolerance have decreased further. The continued increase in risk premiums led to considerable devaluation, especially for higher risk assets with lower credit ratings.
Chart 2-1 Changes in risk indices*
0 20 40 60 80 100 120 140 160 180 200
Jan 2006 Mar 2006 May 2006 Jul 2006 Sep 2006 Nov 2006 Jan 2007 Mar 2007 May 2007 Jul 2007 Sep 2007 Nov 2007 Jan 2008
Basis point
0 20 40 60 80 100 120 140 160 180 Basis point200
MAGGIE BBB MAGGIE A MAGGIE AA MAGGIE AAA
* Indicators of euro-denominated debt premiums broken down by credit rating. Source: J.P. Morgan.
News on losses sustained by large investment banks in the US sub-prime mortgage lending business and the related derivative financial products was frequent on the markets in the past few months. The lack of confidence between banks significantly increased the price of interbank lending and, as a result, uncertainty still pervades the interbank dollar and euro market. Central banks attempted to bring down the high money market interest rates by liquidity enhancing transactions, first independently, then, starting from December, in a concerted effort. Although the steps taken by the central banks mitigated the tension in the money markets, they were unable to restore the lower interbank premiums that were typical prior to August. In the meantime, growing demand for safe government securities and increasing expectations of interest rate cuts kept the yields of short-term government securities at low levels.