Intrasession and Between-Visit Variability of Sector Peripapillary Angioflow Vessel Density Values Measured with the Angiovue Optical Coherence Tomograph in Different Retinal Layers in Ocular Hypertension and Glaucoma
Gábor Holló*
Department of Ophthalmology, Semmelweis University, Budapest, Hungary
*hollo.gabor@med.semmelweis-univ.hu
Abstract
Purpose
To evaluate intrasession and between-visit reproducibility of sector peripapillary angioflow vessel-density (PAFD, %) values in the optic nerve head (ONH) and radial peripapillary capillaries (RPC) layers, respectively, and to analyze the influence of the corresponding sector retinal nerve fiber layer thickness (RNFLT) on the results.
Methods
High quality images acquired with the Angiovue/RTVue-XR Avanti optical coherence tomo- graph (Optovue Inc., Fremont, USA) on 1 eye of 18 stable glaucoma and ocular hyperten- sion patients were analyzed using the Optovue 2015.100.0.33 software version. Three images were acquired in one visit and 1 image 3 months later.
Results
PAFD image quality for all images necessary to calculate reproducibility was sufficient to analysis only in 18 of the 83 participants (21.7%) who were successfully imaged for RNFLT.
Intrasession coefficient of variation (CV) ranged between 2.30 and 3.89%, and 3.51 and 5.12% for the peripapillary sectors in the ONH and RPC layers, respectively. The corre- sponding between-visit CV values ranged between 3.05 and 4.26%, and 4.99 and 6.90%, respectively. Intrasession SD did not correlate with the corresponding RNFLT in any sector in either layer (P0.170). In the ONH layer sector PAFD values did not correlate with the corresponding RNFLT values (P0.100). In contrast, in the RPC layer a significant positive correlation between the corresponding sector PAFD and RNFLT values was found for all but one peripapillary sectors (Pearson-r range: 0.652 to 0.771, P0.0046).
a11111
OPEN ACCESS
Citation:Holló G (2016) Intrasession and Between- Visit Variability of Sector Peripapillary Angioflow Vessel Density Values Measured with the Angiovue Optical Coherence Tomograph in Different Retinal Layers in Ocular Hypertension and Glaucoma. PLoS ONE 11(8): e0161631. doi:10.1371/journal.
pone.0161631
Editor:Rafael Linden, Universidade Federal do Rio de Janeiro, BRAZIL
Received:January 27, 2016 Accepted:August 9, 2016 Published:August 18, 2016
Copyright:© 2016 Gábor Holló. This is an open access article distributed under the terms of the Creative Commons Attribution License, which permits unrestricted use, distribution, and reproduction in any medium, provided the original author and source are credited.
Data Availability Statement:All relevant data are within the paper.
Funding:This research received no specific grant from any funding agency in the public, commercial or not-for-profit sectors.
Competing Interests:Gábor Holló is an unpaid consultant of Optovue, Inc. and Carl Zeiss Meditec, Inc. This does not alter the author's adherence to PLOS ONE policies on sharing data and materials.
Conclusion
Though in several patients routine use of PAFD measurement may be limited by suboptimal image quality, in the successfully imaged cases (21.7% of the study eyes in the current investigation) reproducibility of sector PAFD values seems to be sufficient for clinical research. In stable patients intrasession variability explains most of the between-visit vari- ability. Sector PAFD variability is independent from sector RNFLT, a marker of glaucoma severity. In the RPC layer sector PAFD and RNFLT show strong to very strong positive correlation.
Introduction
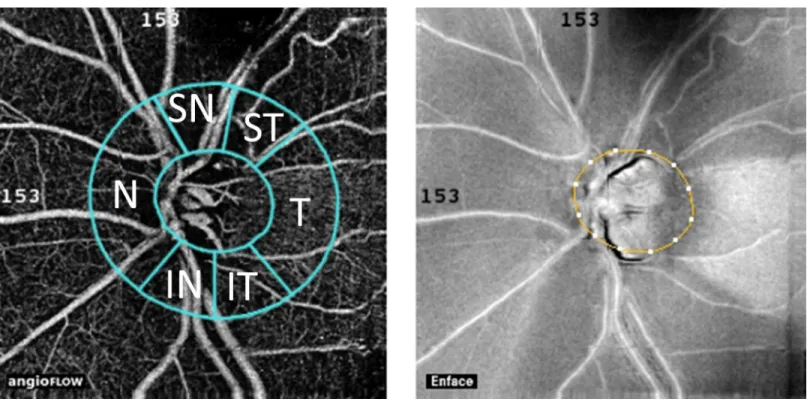
Decreased ocular perfusion and vascular dysregulation in and around the optic nerve head have been considered as risk factors for the development and progression of open-angle glaucoma [1]. Therefore better understanding of the optic nerve head and peripapillary per- fusion may provide clinically useful information for glaucoma research and care. The Angio- vue optical coherence tomograph (OCT; Optovue Inc., Fremont, USA) angiography is a novel non-invasive technology, which was developed to measure vessel density and perfu- sion in various retinal layers in the macula, optic nerve head and peripapillary area, respec- tively [2–8]. Results of recently published investigations using this technology showed decreased disc and peripapillary vessel density in glaucoma, which was related to glaucoma- tous visual field deterioration and glaucoma stage [2,3]. Before manufacturer-provided analysis software to disc and peripapillary measurements for Angiovue OCT angiography became available, research groups used their own software versions for analysis. The researcher-developed analyses did not evaluate the OCT angiography parameters for sepa- rate peripapillary sectors, but used the total peripapillary measurement area as one parame- ter. However, glaucomatous neuroretinal rim damage and decrease of retinal nerve fiber thickness (RNFLT) are frequently localized in early to moderate disease stages, thus separate analysis of the different peripapillary sectors may provide additional or more useful infor- mation compared to analysis of the total peripapillary area. Recently we have shown that peripapillary angioflow-density (PAFD; expressed in % of the measured area) measurement can identify decreased peripapillary perfusion early in the glaucomatous RNFLT thinning process, even prior to the development of clinically significant RNFL damage and visual field deterioration, and that decreased PAFD spatially corresponds with the damaged retinal nerve fiber bundles [8]. In the current investigation we evaluated a commercially not yet released software version (Optovue 2015.100.0.33 software version), which was developed for Angiovue OCT disc angiography to allow separate vessel density analysis in the Optic Nerve Head (ONH) layer (a layer spreading from the internal limiting membrane towards the vitreous body in 150μm thickness) and the Radial Peripapillary Capillaries (RPC) layer (the layer between the outer limit of the retinal nerve fiber layer and the internal limiting membrane) for the disc area, the total peripapillary measurement area, and the temporal, superotemporal, superonasal, nasal, inferonasal, and inferotemporal peripapillary sectors (Fig 1), respectively. To evaluate the potential suitability of this analysis method for clinical research intrasession and between-visit reproducibility, the relationship between measure- ment variability and the spatially corresponding RNFLT, and the relationship between vessel density values and the spatially corresponding RNFLT values were analyzed for each layer and measurement area, respectively, in stable glaucoma and ocular hypertensive eyes.
Materials and Methods Participants and Protocol
The research protocol was approved by the Institutional Review Board for Human Research of Semmelweis University, Budapest. Written informed consent was obtained from all partici- pants before enrollment. All applicable institutional and governmental regulations concerning the ethical use of human volunteers were followed. All participants were white Europeans par- ticipating in a long-term imaging study in the Glaucoma Center of the Semmelweis University in Budapest. OCT angiography and retinal nerve fiber layer imaging were conducted prospec- tively between June and September 2015. In the first visit 3 OCT angiography measurements of the optic nerve head and peripapillary retina, and 1 retinal nerve fiber layer measurement were made. Three months later, in the second visit the eyes underwent 1 OCT angiography measure- ment. In both visits the participants underwent determination of the actual best corrected visual acuity, evaluation of the central 30-degree visual field using Octopus perimetry, and a detailed ophthalmological examination. Only visual field tests with less than 20% false positive and false negative responses, respectively, were used for classification. For retinal nerve fiber layer imaging only images with signal strength index (SSI)>50 were used.
The analyzed population comprised 10 under treatment ocular hypertensive eyes with nor- mal optic nerve head and visual field (with mean defect [MD] less than 2 dB using Octopus perimetry normal strategy, Loss Variance [LV] less than 6 dB2, and no significantly decreased test point sensitivity value) and untreated intraocular pressure consistently above 21 mmHg;
and 8 under treatment primary open-angle glaucoma eyes characterized with glaucomatous neuroretinal rim loss and reliable and reproducible visual field defect typical for glaucoma (inferior and/or superior paracentral or arcuate scotomas, nasal step, hemifield defect or
Fig 1. Positions of the peripapillary sectors given by the Optovue 2015.100.0.33 software version for peripapillary vessel density measurement with the Angiovue OCT.
doi:10.1371/journal.pone.0161631.g001
generalized depression with Octopus perimetry MD higher than 2 dB using normal strategy).
The demographics are shown inTable 1.
Optical Coherence Tomography Angiography
The OCT angiography imaging of the optic nerve head and peripapillary retina, and the retinal nerve fiber layer measurement were made with the Angiovue/RTvue-XR Avanti OCT (Opto- vue Inc., Fremont, CA, USA). Only images with optimal image quality (SSI>50), no motion artifacts, vitreous floaters or other artifacts were selected for analysis. The detailed description of disc and peripapillary angioflow vessel density measurement technique has been published elsewhere [2–8]. In brief, the Angiovue OCT obtains amplitude decorrelation angiography images using an A-scan rate of 70,000 scans per second, a light source centered on 840 nm and a bandwidth of 50 nm. Each OCT-A volume contains 304 x 304 A-scans with two consecutive B-scans captured at each fixed position before proceeding to the next sampling location. Split- spectrum amplitude-decorrelation angiography is used to extract the OCT angiography infor- mation. Motion correction to minimize motion artifacts (vertical or horizontal lines, defo- cused, broken or shifted vessel and image segments) arising from microsaccades and fixation changes is used. Angiography information is displayed en face as the maximum of the decorre- lation values within the corresponding layer. The technique of RNFLT measurements with the glaucoma protocol of the RTvue-XR OCT has been published earlier [8,9].
Determination of Peripapillary Angioflow-Density
One eye per participant (the eye with better image quality) was analyzed for PAFD measure- ment. We used a new and commercially not yet released software (the Optovue 2015.100.0.33 software version, Optovue Inc., Fremont, CA, USA) to measure PAFD (expressed in % of the measured area) in the disc area, the total peripapillary measurement area, and in each of the 6 peripapillary sectors (Fig 1) in 2 different layers, the ONH layer and the RPC layer, respectively.
The software-provided peripapillary sectors are based on the Garway-Heath map [10]. The ONH layer is defined as the layer spreading from the internal limiting membrane towards the vitreous body in 150μm thickness; and the RPC layer as the tissues between the outer limit of the retinal nerve fiber layer and the internal limiting membrane. Each layer corresponds with an en face structural image layer. The 4.5 mm x 4.5 mm scan size was used. The inner elliptical contour (which defines the optic nerve head) is obtained by automatic fitting an ellipse to the disc margin based on the OCT en face image. The peripapillary area is defined as the area
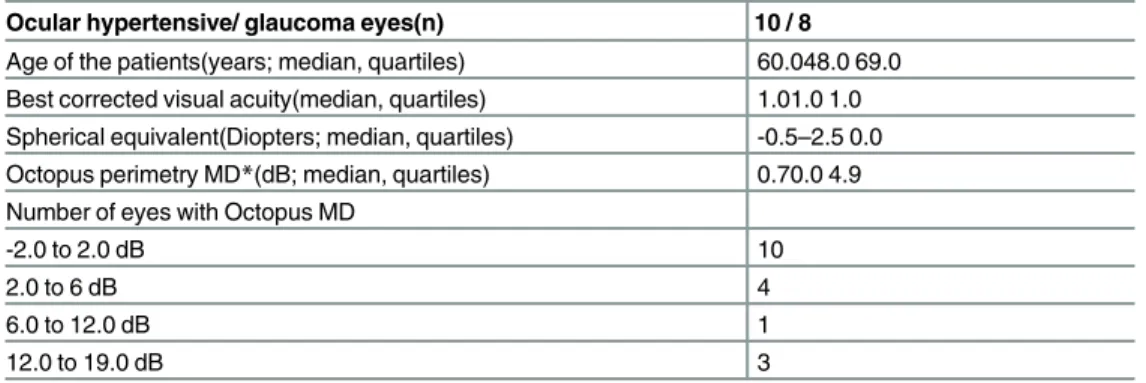
Table 1. Demographics of the study eyes.
Ocular hypertensive/ glaucoma eyes(n) 10 / 8
Age of the patients(years; median, quartiles) 60.048.0 69.0 Best corrected visual acuity(median, quartiles) 1.01.0 1.0 Spherical equivalent(Diopters; median, quartiles) -0.5–2.5 0.0 Octopus perimetry MD*(dB; median, quartiles) 0.70.0 4.9 Number of eyes with Octopus MD
-2.0 to 2.0 dB 10
2.0 to 6 dB 4
6.0 to 12.0 dB 1
12.0 to 19.0 dB 3
*In Octopus perimetry pathological mean deviation (MD) values are positive numbers doi:10.1371/journal.pone.0161631.t001
between the inner and outer ellipses. The ring width between the inner and outer elliptical con- tour lines was 0.75 mm in all cases.
Statistics
The STATA 6 software package was used for statistical analysis. Intrasession and between-visit reproducibility were characterized by the corresponding coefficient of variation (CV). Pear- son's correlation was used to investigate the relationship between RNFLT and the correspond- ing vessel-density, and Spaerman’s correlation to investigate the relationship between RNFLT and the corresponding intrasession vessel-density SD values, respectively. P-values of less than 0.01 were considered to be statistically significant.
Results
Eighty-three study participants were imaged during the 4 month of data collection, but sufficient image quality for all images necessary for the calculation of reproducibility was not achieved in 65 patients. The typical reasons of insufficient image quality were fixation losses, large eye move- ments, blinking due to dry eye related complaints, vitreous floaters and the combination of the above reasons. In the analyzed population (18 eyes, 21.7%) the mean ± SD PAFD values calcu- lated for the disc area, the total peripapillary measurement area, and the 6 peripapillary sectors in the ONH and RPC layers, respectively, are shown inTable 2. For the disc area intrasession and between-visit CV were 3.05% and 6.53% in the ONH layer, and 3.38% and 6.46% in the RPC layer, respectively. The corresponding CV values found for the total peripapillary measurement area were 2.08% and 2.90%, and 2.48% and 3.84%, respectively (Tables3and4). For the peripa- pillary sectors intrasession CV ranged between 2.30 and 3.89% in the ONH layer, and between 3.51 and 5.12% in the RPC layer (Tables3and4). The corresponding between-visit CV values ranged between 3.05 and 4.26%, and 4.99 and 6.90%, respectively. Intrasession SD did not corre- late with the corresponding RNFLT in any sector in either layer (P0.170). In the ONH layer sector PAFD values did not correlate with the corresponding RNFLT values (P0.100). In con- trast, in the RPC layer a strong to very strong, statistically significant positive correlation between the corresponding PAFD and RNFLT values was found for all but one peripapillary sectors, and for the total peripapillary measurement area (Table 4).
Discussion
In the current study we investigated intrasession and between-visit reproducibility of sector angioflow vessel-density values determined by a commercially not yet available software (the Optovue 2015.100.0.33 software version) developed to Angiovue OCT disc angiography by the OCT's manufacturer. This analysis software automatically provides PAFD values for the disc area, the total peripapillary measurement area and its 6 sectors in the ONH layer and the RPC
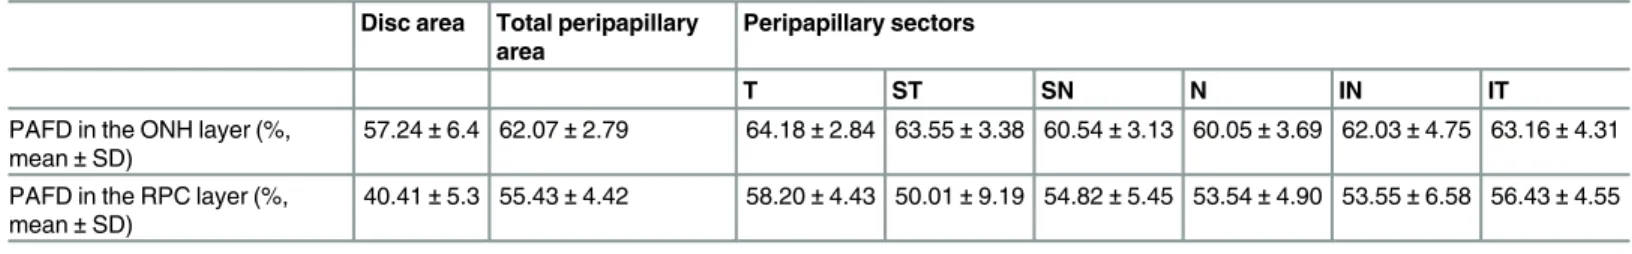
Table 2. Peripapillary angioflow vessel-density (PAFD) in the optic nerve head (ONH) and radial peripapillary capillaries (RPC) layers, respectively.
Disc area Total peripapillary area
Peripapillary sectors
T ST SN N IN IT
PAFD in the ONH layer (%, mean±SD)
57.24±6.4 62.07±2.79 64.18±2.84 63.55±3.38 60.54±3.13 60.05±3.69 62.03±4.75 63.16±4.31 PAFD in the RPC layer (%,
mean±SD)
40.41±5.3 55.43±4.42 58.20±4.43 50.01±9.19 54.82±5.45 53.54±4.90 53.55±6.58 56.43±4.55
T, temporal; ST, superotemporal; SN, superonasal; N, nasal; IN, inferonasal; IT, inferotemporal; NA, not applicable doi:10.1371/journal.pone.0161631.t002
layer, respectively. OCT angiography with the Angiovue OCT is a recently developed non- invasive method made for analysis of perfusion in the macula, and the optic disc and peripapil- lary retina, respectively [2–8]. Motion-corrected information reflecting on perfusion is auto- matically determined using split-spectrum amplitude decorrelation of subsequent images, and is presented for various retinal layers separately, parallel to the corresponding en face structural images. Reproducibility of PAFD determined for the total disc area and total peripapillary mea- surement area was recently investigated [2,3]. The authors found favorable repeatability and a statistically significant relationship with glaucomatous visual field deterioration. However, they used their own software versions for image analysis and calculation, which did not provide data for peripapillary sectors separately. Since glaucomatous structural damage is frequently localized, separate analysis of the peripapillary sectors for PAFD may offer advantages over the use of the total peripapillary measurement area as a single parameter.
Our patient population comprised stable ocular hypertensive and primary open-angle glau- coma patients whose PAFD images were of high quality and free from any artifact. The severity of glaucomatous visual field deterioration ranged from no damage to severe damage, which allowed us to investigate the potential influence of sector RNFLT on the corresponding sector PAFD and its measurement variability. For the disc area the intrasession CV remained below
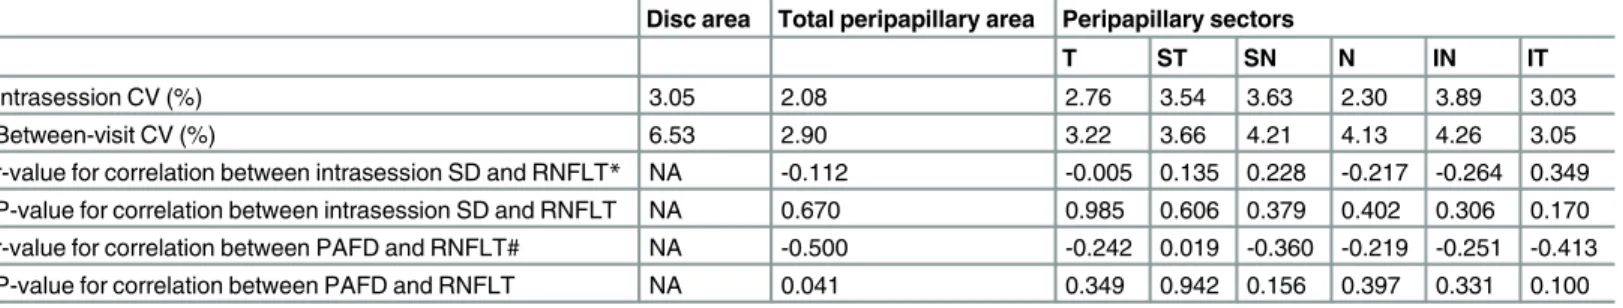
Table 3. Intrasession and between-visit coefficients of variation (CV), correlation coefficients (r) and their significance calculated for the relation- ship between intrasession standard deviation (SD) and the corresponding retinal nerve fiber layer thickness (RNFLT), and peripapillary angioflow vessel-density (PAFD) and the corresponding RNFLT, respectively, in the optic nerve head layer.
Disc area Total peripapillary area Peripapillary sectors
T ST SN N IN IT
Intrasession CV (%) 3.05 2.08 2.76 3.54 3.63 2.30 3.89 3.03
Between-visit CV (%) 6.53 2.90 3.22 3.66 4.21 4.13 4.26 3.05
r-value for correlation between intrasession SD and RNFLT* NA -0.112 -0.005 0.135 0.228 -0.217 -0.264 0.349 P-value for correlation between intrasession SD and RNFLT NA 0.670 0.985 0.606 0.379 0.402 0.306 0.170 r-value for correlation between PAFD and RNFLT# NA -0.500 -0.242 0.019 -0.360 -0.219 -0.251 -0.413
P-value for correlation between PAFD and RNFLT NA 0.041 0.349 0.942 0.156 0.397 0.331 0.100
T, temporal; ST, superotemporal; SN, superonasal; N, nasal; IN, inferonasal; IT, inferotemporal; NA, not applicable
*Spaerman’s correlation
# Pearson’s correlation doi:10.1371/journal.pone.0161631.t003
Table 4. Intrasession and between-visit coefficients of variation (CV), correlation coefficients (r) and their significance calculated for the relation- ship between intrasession standard deviation (SD) and the corresponding retinal nerve fiber layer thickness (RNFLT), and peripapillary angioflow vessel-density (PAFD) and the corresponding RNFLT, respectively, in the radial peripapillary capillaries layer.
Disc area Total peripapillary area Peripapillary sectors
T ST SN N IN IT
Intrasession CV (%) 3.38 2.48 3.51 5.12 3.87 3.69 4.76 3.72
Between-visit CV (%) 6.46 3.84 5.64 5.64 6.90 5.27 4.99 5.18
r-value for correlation between intrasession SD and RNFLT
* NA -0.208 -0.215 -0.012 -0.254 -0.104 0.177 -0.204
P-value for correlation between intrasession SD and RNFLT NA 0.422 0.407 0.963 0.326 0.690 0.497 0.432
r-value for correlation between PAFD and RNFLT# NA 0.844 0.760 0.771 0.474 0.731 0.688 0.652
P-value for correlation between PAFD and RNFLT NA <0.0005 <0.0004 <0.0003 0.0550 0.0009 0.0022 0.0046 T, temporal; ST, superotemporal; SN, superonasal; N, nasal; IN, inferonasal; IT, inferotemporal; NA, not applicable
*Spaerman’s correlation
# Pearson’s correlation doi:10.1371/journal.pone.0161631.t004
3.4%, and the between-visit CV below 6.6% in both layers. For the total peripapillary area the corresponding CV values were lower than 2.5% and 3.9%, respectively. These results are favor- able and similar to the previously published corresponding data [2]. For the 6 peripapillary sec- tors, in the ONH layer intrasession and between-visit CV did not exceed 3.9 and 4.3%,
respectively. In the RPC layer, where the retinal nerve fibers are located, the corresponding CV values did not exceed 5.2 and 6.9%, respectively. Intrasession variability explained most of the between-visit variability. These results suggest that sector PAFD results have a reproducibility which is sufficient for clinical research.
Intrasession SD of the PAFD measurements did not correlate with the spatially correspond- ing RNFLT in either layer, for any parameter. This suggests that measurement precision in the peripapillary sectors is not reduced in glaucoma compared to that in eyes with no structural and functional damage. Thus the probability of obtaining reproducible result does not depend on the severity of the disease, which is important for future research. In the RPC layer the spa- tially corresponding PAFD and RNFLT values showed a statistically significant, strong to very strong positive correlation in all but 1 sectors, and in the total peripapillary area. In contrast, in the ONH layer, where the retinal nerve fibers are not present, no correlation was found. These results mean that peripapillary PAFD in the RPC layer in fact shows RNFL-related vessel den- sity, and suggest that image segmentation for PAFD measurement is satisfactory.
Our study has limitations. All our patients were white Europeans with low refractive error, thus limited conclusions can be drawn from our results with regard to other ethnic groups and eyes with high myopia or hyperopia. Of the 83 participants, who have all been successfully imaged for RNFLT and ganglion cell complex measurement with Optovue OCT for several years, only 18 had sufficient image quality in the total image area for all images necessary to calculate the repro- ducibility figures. We think that in addition to the high image quality requirement made to the current investigation the relatively long image acquisition time, the fixation problems common in advanced glaucoma, and the dry eye symptoms common in elderly glaucoma patients can be con- sidered the main reasons of suboptimal image quality. This suggests that a considerable propor- tion of elderly glaucoma patients may not be optimal candidates for repeated OCT disc angioflow measurements. This may limit the routine clinical use of the technology, but with continued refinement may not significantly influence the use of PAFD measurements for research purposes.
It is also important to note that while in the current investigation image quality had to be optimal in the total image area in all images for inclusion, in the studies published earlier no detailed defi- nition of the required image quality was provided. This may explain the difference in the ratio of eligible and imaged eyes between previous studies and the current investigation [2–4].
In conclusion, in a selected stable ocular hypertensive and primary open-angle glaucoma pop- ulation reproducibility of peripapillary sector PAFD determined with the Optovue 2015.100.0.33 software version using images obtained with the Angiovue OCT showed satisfactory short-term and long-term reproducibility. The measurement variability was independent from the spatially corresponding RNFLT. Peripapillary sector PAFD in the RPC layer showed strong to very strong positive correlation with the corresponding RNFLT values. Our results suggest that when image quality is optimal sector analysis of peripapillary vessel density may be reliably used for clinical research. However, it is important to note that high image quality in the total scan area in all images for an eye was obtained only in 21.7% of the participants in the current investigation, which suggests that further development of the technology is necessary.
Acknowledgments
The author thanks Ágota Szabó and Anita Csorba for technical assistance and Péter Vargha for the statistical analysis
Author Contributions Conceptualization:GH.
Data curation:GH.
Formal analysis:GH.
Investigation:GH.
Methodology:GH.
Resources:GH.
Supervision:GH.
Validation:GH.
Visualization:GH.
Writing - original draft:GH.
Writing - review & editing:GH.
References
1. Quaranta L, Katsanos A, Russo A, Riva I. 24-hour intraocular pressure and ocular perfusion pressure in glaucoma. Surv Ophthalmol. 2013; 58: 26–41. doi:10.1016/j.survophthal.2012.05.003PMID:
23217586
2. Liu L, Jia Y, Takusagawa HL, Pechauer AD, Edmunds B, Lombardi L, et al. Optical coherence tomogra- phy angiography of the peripapillary retina in glaucoma. JAMA Ophthalmol 2015; 133: 1045–1052. doi:
10.1001/jamaophthalmol.2015.2225PMID:26203793
3. Wang X, Jiang C, Ko T, Kong X, Yu X, Min W, et al. Correlation between optic disc perfusion and glau- comatous severity in patients with open-angle glaucoma: an optical coherence tomography angiogra- phy study. Graefes Arch Clin Exp Ophthalmol 2015; 253: 1557–1564. doi:10.1007/s00417-015-3095- yPMID:26255817
4. Pechauer AD, Jia Y, Liu L, Gao SS, Jiang C, Huang D, et al. Optical coherence tomography angiogra- phy of peripapillary retinal blood flow response to hyperoxia. Invest Ophthalmol Vis Sci. 2015; 56:
3287–3291. doi:10.1167/iovs.15-16655PMID:26024111
5. Kuehlewein L, Sadda SR, Sarraf D. OCT angiography and sequential quantitative analysis of type 2 neovascularization after ranibizumab therapy. Eye 2015; 29: 932–935. doi:10.1038/eye.2015.80 PMID:25976641
6. Carpineto P, Mastropasqua R, Marchini G, Toto L, Di Nicola M, Di Antonio L. Reproducibility and repeatability of foveal avascular zone measurements in healthy subjects by optical coherence tomogra- phy angiography. Br J Ophthalmol 2016; 100:671–676. doi:10.1136/bjophthalmol-2015-307330PMID:
26377414
7. Coscas F, Glacet-Bernard A, Miere A, Caillaux V, Uzzan J, Lupidi M, et al. Optical coherence tomogra- phy angiography in retinal vein occlusion: Evaluation of superficial and deep capillary plexa. Am J Ophthalmol 2016; 161: 160–171. doi:10.1016/j.ajo.2015.10.008PMID:26476211
8. Holló G. Vessel density calculated from OCT angiography in three peripapillary sectors in normal, ocu- lar hypertensive and glaucoma eyes. Eur J Ophthalmol 2016; 26: e42–e45. doi:10.5301/ejo.5000717 PMID:26692060
9. Garas A, Vargha P, Holló G. Reproducibility of retinal nerve fiber layer and macular thickness measure- ment with the RTVue-100 optical coherence tomograph. Ophthalmology 2010; 117: 738–746. doi:10.
1016/j.ophtha.2009.08.039PMID:20079538
10. Garway-Heath DF, Poinoosawmy D, Fitzke FW, Hitchings RA. Mapping the visual field to the optic disc in normal tension glaucoma eyes. Ophthalmology 2000; 107: 1809–1815. PMID:11013178