DOI: 10.1556/606.2019.14.2.12 Vol. 14, No. 2, pp. 131–142 (2019) www.akademiai.com
NUMERICAL EVALUATION OF OUTDOOR THERMAL COMFORT AND WEATHER
PARAMETERS IN SUMMERTIME AT SZÉCHENYI SQUARE
1 Mohammad S. ALBDOUR, 2 Bálint BARANYAI*
1 Marcel Breuer Doctoral School, Faculty of Engineering and Information Technology University of Pecs, Boszorkany u. 2, 7624 Pecs, Hungary, e-mail: albdour_m@yahoo.com
2 Department of Architectural Engineering, Faculty of Engineering and Information Technology, University of Pecs, Boszorkany u. 2, 7624 Pecs, Hungary
e-mail: balint.baranyai@mik.pte.hu
Received 7 December 2018; accepted 20 January 2019
Abstract: Numerical research in the context of urban in a humid continental climate zone is still limited. The aim of modeling the case study is to assess the performance of outdoor thermal comfort parameters and investigate their capabilities in achieving the outdoor thermal comfort. A computer-based tool is used to quantitatively study the outdoor thermal comfort and its weather parameters. The parameters have been analyzed using ENVI-met tool and then compared against different comfort scales like relative humidity comfort scale, the predicted mean vote scale as well as other scales and standards. The results have shown that the average predicted mean vote value is +4 (very hot), the average air temperature is hot, the average wind speed is light breeze and the relative humidity falls within the comfort range. However, street orientation, shading, water bodies and plantation play a significant role in increasing and decreasing the outdoor thermal comfort.
Keywords: Evaluation, Modeling, Outdoor thermal comfort, Summertime, ENVI-met
1. Introduction
The energy demand of the built environment is almost 50% of the total energy demand of a national economy [1]. Reducing the built environment demand for energy means it is necessary to assess and study the outdoor its and its design measures.
Outdoor public spaces contribute to the quality of life in cities. They play an important role in the outdoor activities of urban dwellers and contribute to strengthening social interactions between citizens [2], [3], [4]. The city of Pecs was chosen as a case study
* Corresponding Author
because it represents a typical example of a Central European city located in the southwest of Hungary characterized by hot summers and mild winters.
The investigations in this study are conducted in the summertime due to heat stress in outdoor spaces mainly happens during the summertime of the year. In particular, this paper investigates and discusses the outdoor thermal comfort in urban spaces in a Central European square.
The microclimate analysis of an urban space must consider all meteorological conditions like solar incidence and radiation exchanges, local wind characteristics, topography, vegetation and the presence of water. Beyond these factors, the urban design, the morphology of the buildings, and the behavior of individuals are also factors that influence the thermal conditions of the outdoor spaces considered. The most precise way to calculate or assess the impact of changes is to use numerical methods, which are able to deal with the complexity of urban structures and even take into account human thermal comfort [5].
2. ENVI-met software thermal comfort model
The importance of new green branches of science aiming to find solutions to environmental challenges has been internationally considered as undisputable [6]. In order to understand and solve problems in complex environmental settings effectively, environmental modeling has been used more frequently in scientific research in this area. For this research, the ENVI-met software climate model developed by the Research Group Climatology at Ruhr-University Bochum in Germany for the microclimate modeling was selected to simulate urban climate parameters, like air temperature, relative humidity, and wind velocity, Mirzaei and Haghighat [7], [8].The quantitative evaluation has shown that the ENVI-met model is capable of predicting the thermal behavior of different ground surfaces with good accuracy [7], [9]-[11]. The reliability of ENVI-met results for simulating the outdoor thermal spaces validated in many investigations. These investigations showed that the data measured at local meteorological locations seemed to accord with the simulated results [12], [13]. Monam and Ruckert validated that concerning several investigations [7], [14]-[16]. ENVI-met results could be recognized as accurate and reliable [7].
2.1. ENVI-met predicted mean vote index model
Thermal comfort is defined as that condition of mind, which expresses satisfaction with the thermal environment and is assessed by subjective evaluation, [17]. A more analytical approach by Fanger mentions that thermal comfort is achieved when the rate of metabolic heat generation and the heat loss of the body are balanced. Many indices have been developed to estimate outdoor thermal comfort conditions in the last years’- Predicted Mean Vote (PMV) - Predicted Percentage Dissatisfied (PPD) model was developed for indoor spaces, and it was adapted for outdoor climate by Jendritzky, [17], [18].
Typically, PMV range is described within ‒4 very cold and +4 very hot, 0 is the thermal comfort value (neutral), (Fig. 1). Although PMV values are the mathematical
function of the local environment, in most utilization, it can also give values above ‒4 or below +4. Implementing of PMV equation to the outdoor circumstances in summer temperature stress conditions can efficiently provide values of PMV high over +4 - +8 and more. While these results are mathematically accurate, it infringes the scale of the actual PMV method [17].
Fig. 1. PMV scale [11]
Various thermal indices are also derived from this model. Common climatic parameters like air Temperature (Ta), Relative Humidity (RH), Wind speed (Ws) and solar Radiation (Rs) are required to quantify the climatic conditions with Mean Radiant Temperature (MRT) [19], [20] being the most important. All short and long wave radiation fluxes, which the body is exposed to are integrated into the MRT index and associated with thermal comfort [19], [21].
3. Methodology
A computer-aided tool was employed in order to quantitatively investigate the outdoor thermal comfort and its parameters on the case study site’s occupants. It is known that the simulation research method can be effectively used where the experimental work in the real world cannot be performed due to unacceptable ethical, economic or dangerous restrictions [22]. In order to assess the whole site, thermal performance simulations were conducted at 14:00 PM on the 21st of July as a representation for the summer period. It is an extreme summer day analyzed by climate consultant 6.0 [23], which is expected to result in high radiant interaction values. Model domain: Mean domain area: x-grids=58, y-grids=105, z-grids=20. Grid size and structures: dx=2 m, dy=2 m, dz=2 m. Geographic coordinates of Pécs, Hungary’s Latitude: 46°04′59″ N, longitude: 18°13′59″ E, elevation above sea level is 153 m.
3.1. Selected study area
Széchenyi square is the main square and the historical center of Pécs, Hungary [24].
The case study is located in the middle of the selected city and surrounded by 11 buildings. The total area is almost 11222 m2, and most buildings are 3-4-floor height.
The case study has two water bodies and some plantation nearly 7% of the entire area.
The vast majority of the buildings are built of light-colored brick with red roof tiles (Fig. 2). Space serves as an assembly point where locals can meet, chat as well as wandering.
A representative case study was chosen to be used in this research. The case study was analyzed in terms of identifying the properties of its design measures, which could affect the outdoor thermal comfort performance.
Cold Neutral Hot
-4 0 +4
Fig. 2. The location of the case study’s site [25]
The results of the case study analysis could be concluded as follows:
1. The streets were found to be oriented to the northeast-southwest mostly direction and northwest-southeast direction;
2. There are some mature trees and bushes were found. Vegetation is limited to 6- 9 m trees and flowers over the public open spaces. The entire area of the vegetation is 750 m2, i.e. 7% of the site. These bushes are not expected to affect the airflow profile over the site;
3. The site analysis also showed that ponds and fountains had been designed to be located on the site in two different places. Water constitutes about 3% of the total site;
4. The hardscape for instance roads, seats, and statuses are found on location in different places;
5. The climate analysis: [23], [26]:
• Wind: The average wind speed is 2.5-3 m/s in the summertime. The wind direction in degrees in summertime equals 0 ° in June, 20 ° in July, 0 ° in August;
• Relative humidity: The average summertime percentage of humidity is around 71%;
• Temperature: On average, the warmest month is July, the mean temperature is 22 oC, and the average high temperature is around 26 oC, in addition, design temperature is 33 oC and low is 15 oC;
• Radiation: On average July sees the highest radiation mean value where direct radiation is around 300 W/m2 while the average high radiation is 440 W/m2, however the average low is 50 W/m2;
6. Building characteristics analysis [27]:
• Heat transmission:
• Walls the U-value is almost 1.7 W/m2K;
• Roofs the U-value is almost 2.2 W/m2K;
• Albedo: walls 0.5 and Roofs 0.2;
7. Clothing insulation analysis: In the summertime, the majority of individuals wear garments that have clothing insulation rages from 0.5 to 67 Clo. However, in wintertime clothing insulation increase up to 1.3 col [28];
8. Metabolic rate analysis: The most common activities in the case study site are seated, standing, relaxed and walking. The most popular activity metabolic rates range from 1 met (seated) to 2.6 met (waking) [28].
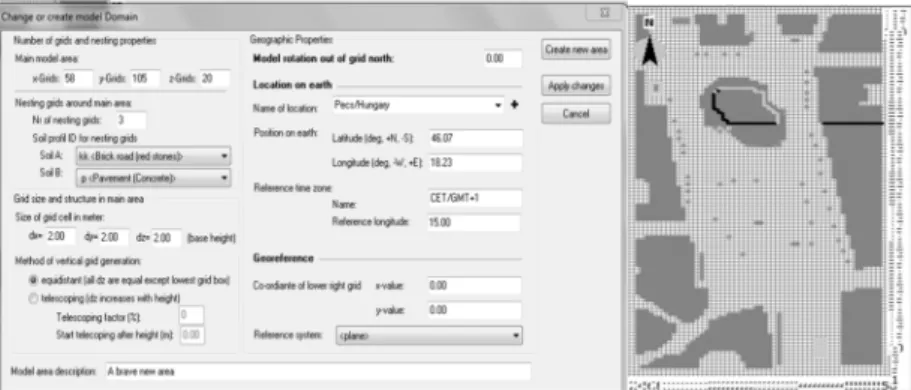
3.2. Modeling and simulation process
The model requires relatively few input parameters and calculates all required meteorological factors, namely air and surface temperatures, wind speed and direction, air humidity, short-wave and long-wave radiation flux as well as the mean radiant temperature needed for comfort analyses. The first task will be to set the space to be tested (Fig. 3). This includes the location, the horizontal and vertical dimensions of the architectural environment, the surface materials and the vegetation size, kind, distribution and percentage to non-green areas (Table I).
Fig. 3. ENVI-met model domain and model area inputs for the whole site Table I
Model area inputs 11294 m2 Area
13 Number of surrounding buildings
750 m2 (7-8%) Vegetation
9675 m2 (86%) Paving(interlock)
270 m2 (2%) Paving(asphalt)
290 m2 (3%) Water body (fountains)
200 m2 (1.5%) Hardscape
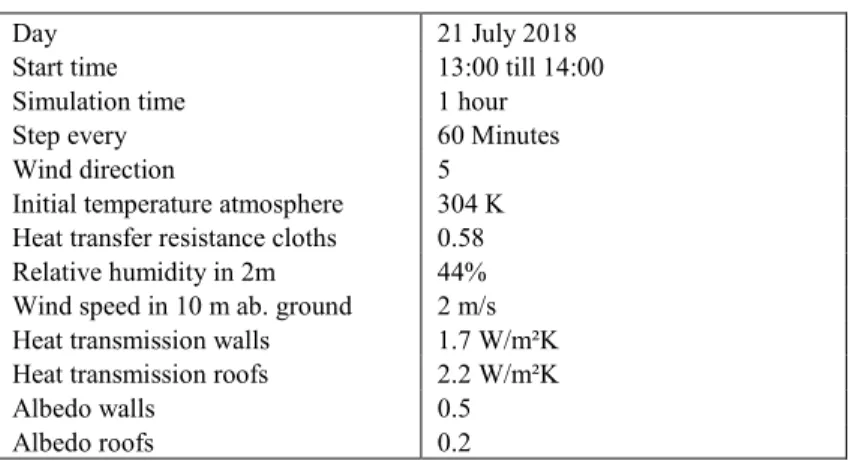
The second step would be to gather information about the site location and its climatic data like temperature, wind speed, humidity, PMV parameters and databases
for soil types and vegetation (Table II). The simulation using ENVI-met is then processed. The output files are visualized using the program LEONARDO [29].
Table II
ENVI-met model’s configuration 21 July 2018 Day
13:00 till 14:00 Start time
1 hour Simulation time
60 Minutes Step every
5 Wind direction
304 K Initial temperature atmosphere
0.58 Heat transfer resistance cloths
44%
Relative humidity in 2m
2 m/s Wind speed in 10 m ab. ground
1.7 W/m²K Heat transmission walls
2.2 W/m²K Heat transmission roofs
0.5 Albedo walls
0.2 Albedo roofs
4. Results and discussion
4.1. Air temperature
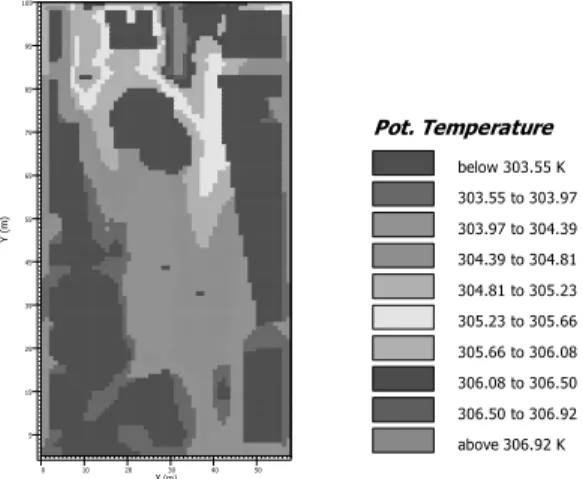
On average the air temperature on the 21st of July at 14:00 PM is 305 K, which means the temperature ranges from warm to hot. Areas close to buildings and covered by shade and plantation have a lower temperature 303.55 K than other places of the square 304-306.9 K. Buildings height, orientation and plantation have a significant effect on outdoor thermal comfort. In addition, water bodies play an essential role in mitigating the temperature (Table III), (Fig. 4).
Table III
Maximum, Minimum and Average air temperature on the 21st of July at 14:00 305 K ~ 31.85 oC
Average
307 K ~ 33.85 oC Maximum
303 K ~ 29.85 oC Minimum
The average monthly outside temperature over the month of investigation (July 2018) from the raw climatic data (30.85 oC) was used to calculate the thermal comfort threshold temperature above, which an overheating sensation is likely to occur using the thermal neutrality model adopted by the American Society of Heating, Refrigerating and Air-Conditioning (ASHRAE) (Table IV). The air temperature has been analyzed using ENVI-met tool and then compared against ASHRAE standards (Fig. 4), (Table IV).
Fig. 4. Air temperature on 21st of July at 14:00 Table IV
Comfort lowest and highest temperature according to ASHRAE standard 55 comfort model [28]
Less than 20.3 oC
20.3 oC winter lowest
24.3 oC winter highest
26.7 oC summer highest
More than 26.7 oC
4.2. Relative humidity
The relative humidity falls within the comfort range in the summertime (Table V).
Streets orientation, water bodies, and plantation play a significant role in increasing the relative humidity (Fig. 5).
The relative humidity has been analyzed using ENVI-met tool and then compared against ASHRAE relative humidity/temperature diagram based on comfort zone (Fig. 5- Fig. 6).
Table V
Maximum, Minimum and average relative humidity on the 21st of July at 14:00 34.5%
Average
38 % Maximum
31 % Minimum
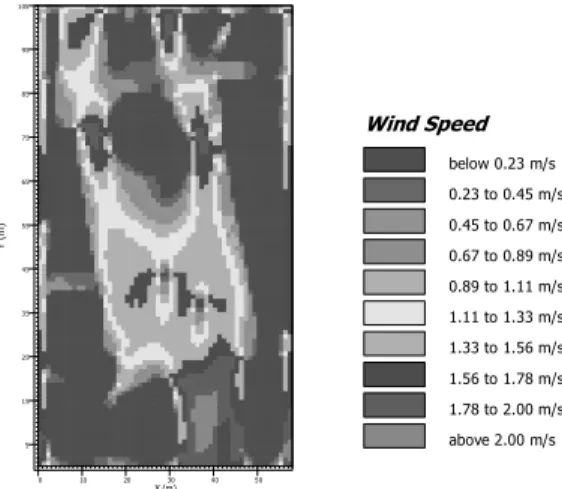
4.3. Wind speed
The wind speed has been analyzed using ENVI-met tool and then compared against the Beaufort wind scale (Table VI), (Fig. 7).
The average wind speed is light breeze 1.3 m/s (Table VII). Streets orientation and streets canyon geometry play a significant role in accelerating the wind speed (Fig. 7).
X (m)
0 10 20 30 40 50
Y (m)
5 15 25 35 45 55 65 75 85 95 105
Pot. Temperature
below 303.55 K 303.55 to 303.97 K 303.97 to 304.39 K 304.39 to 304.81 K 304.81 to 305.23 K 305.23 to 305.66 K 305.66 to 306.08 K 306.08 to 306.50 K 306.50 to 306.92 K above 306.92 K
Fig. 5. Relative humidity on the 21st of July at 14:00
Fig. 6. Relative humidity /temperature diagram based on comfort zone according to ASHRAE 55 [28].
Table VI
Maximum, Minimum and average wind speed on 21st of July at 14:00 1.3 m/s
Average
2 m/s Maximum
0.45 m/s Minimum
Table VII Beaufort wind scale [30]
8-10.7 m/s Fresh breeze 5.5-7.9 m/s
Moderate breeze 3.4-5.5 m/s
Gentle breeze 1.6-3.3 m/s
Light breeze 0.3-1.5 m/s
Light air 0.3 m/s
Clam
X (m)
0 10 20 30 40 50
Y (m)
5 15 25 35 45 55 65 75 85 95 105
Relative Humidity
below 30.30 % 30.30 to 31.27 % 31.27 to 32.24 % 32.24 to 33.21 % 33.21 to 34.19 % 34.19 to 35.16 % 35.16 to 36.13 % 36.13 to 37.10 % 37.10 to 38.08 % above 38.08 %
Fig. 7. Wind speed on the 21st of July at 14:00 4.4. Mean radiant temperature
MRT is a measure of the average temperature of the surfaces that surround a particular point, with which it will exchange thermal radiation. If the point is exposed to the outside, this may include the sky temperature and solar radiation [31].
Results: On average the MRT is 333.2 K (Fig. 8), (Table VIII). Areas close to buildings that covered by shade and plantation have lower MRT than the rest areas of the square (Fig. 8), (Table VIII). Water bodies play an essential role in mitigating the MRT.
Fig. 8. Mean radiant temperature on 21st of July at 14:00
X (m)
0 10 20 30 40 50
Y (m)
5 15 25 35 45 55 65 75 85 95 105
Wind Speed
below 0.23 m/s 0.23 to 0.45 m/s 0.45 to 0.67 m/s 0.67 to 0.89 m/s 0.89 to 1.11 m/s 1.11 to 1.33 m/s 1.33 to 1.56 m/s 1.56 to 1.78 m/s 1.78 to 2.00 m/s above 2.00 m/s
X (m)
0 10 20 30 40 50
Y (m)
5 15 25 35 45 55 65 75 85 95 105
Mean Radiant Temperature below 310.10 K 310.10 to 315.89 K 315.89 to 321.68 K 321.68 to 327.47 K 327.47 to 333.26 K 333.26 to 339.04 K 339.04 to 344.83 K 344.83 to 350.62 K 350.62 to 356.41 K above 356.41 K
Table VIII
Maximum, minimum and average mean radiant temperature on 21st of July at 14:00 333.2 K
Average
356.41 K Maximum
310.10 K Minimum
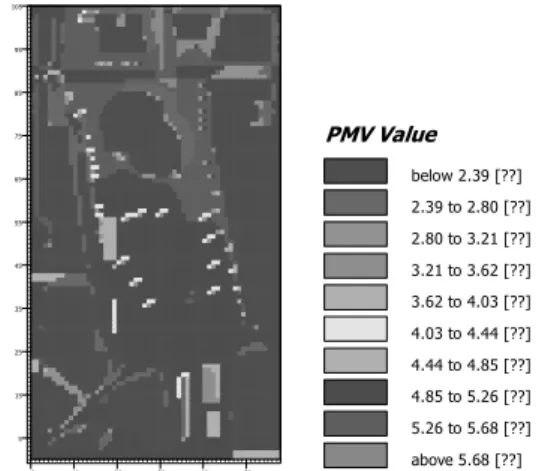
4.5. Predicted mean vote
The predicted mean vote has been analyzed using ENVI-met tool and then compared against ASHRAE thermal sensation scale (Fig. 9), (Table IX).
The average PMV value on the 21st of July at 14:00 PM is very hot (Table X). On average areas close to buildings and covered by shading and vegetation have a lower PMV value than the rest places of the square (Fig. 9).
Fig. 9. Predicted mean vote on the 21st of July at 14:00 Table IX
Maximum, Minimum and average PMV on the 21st of July at 14:00 PM 4 (very hot)
Average
5.6 (very hot) Maximum
2.4 (warm) Minimum
Table X
ASHRAE thermal sensation scale [28]
+3 hot +2 warm
+1 slightly warm 0 neutral
-1 slightly cool -2 cool
-3 Cold
X (m)
0 10 20 30 40 50
Y (m)
5 15 25 35 45 55 65 75 85 95 105
PMV Value
below 2.39 [??]
2.39 to 2.80 [??]
2.80 to 3.21 [??]
3.21 to 3.62 [??]
3.62 to 4.03 [??]
4.03 to 4.44 [??]
4.44 to 4.85 [??]
4.85 to 5.26 [??]
5.26 to 5.68 [??]
above 5.68 [??]
5. Conclusions
The case study was modeled to assess the performance of outdoor thermal comfort parameters and investigate their capabilities in achieving the outdoor thermal comfort.
However, it is concluded that areas close to buildings and covered in shading and plantation have less temperature than other places of the square, water bodies play a significant role in mitigating the temperature and decreasing the PMV value. Street orientation, shading, water bodies as well as plantation play a significant role in increasing and decreasing the outdoor thermal comfort level.
Open Access statement
This is an open-access article distributed under the terms of the Creative Commons Attribution 4.0 International License (https://creativecommons.org/licenses/by/4.0/), which permits unrestricted use, distribution, and reproduction in any medium, provided the original author and source are credited, a link to the CC License is provided, and changes - if any - are indicated. (SID_1)
References
[1] Baranyai B., Kistelegdi I. Energy management monitoring and control of public buildings, Pollack Periodica, Vol. 9, No. 2, 2014, pp. 77‒79.
[2] Thorsson S., Lindqvist M., Lindqvist S. (2004). Thermal bioclimatic conditions and patterns of behaviour in an urban park in Göteborg, Sweden, International Journal of Biometeorology, Vol. 48, No. 3, 2004, pp. 149‒156.
[3] Oliveira S., Andrade H. An initial assessment of the bioclimatic comfort in an outdoor public space in Lisbon, International Journal of Biometeorology, Vol. 52, No. 1, 2007, pp. 69‒70.
[4] Nikolopoulou M., Steemers K. Thermal comfort and psychological adaptation as a guide for designing urban spaces, Energy and Buildings, Vol. 35, No. 1, 2003, pp. 95‒101.
[5] Grifoni R. C., Passerini G., Pierantozzi M. Assessment of outdoor thermal comfort and its relation to urban geometry, WIT Transactions on Ecology and the Environment, Vol. 173, 2013, pp. 3-14.
[6] Póth B., Kistelegdi I. (2013). The history of the energy and climate concept of the szentágothai research center, Pollack Periodica, Vol. 8, No. 3, 2013, pp. 3‒14.
[7] Shen T., Chow D. H., Darkwa J. Simulating the influence of microclimatic design on mitigating the urban heat island effect in the Hangzhou Metropolitan area of China, International Journal of Low-Carbon Technologies, Vol. 11, No. 1, 2016, pp. 130‒139.
[8] Mirzaei P. A., Haghighat F. Approaches to study urban heat island - Abilities and limitations, Building and Environment, Vol. 45, No. 10, 2010, pp. 2192‒2201.
[9] Ali-Toudert F., Mayer H. Numerical study on the effects of aspect ratio and orientation of an urban street canyon on outdoor thermal comfort in hot and dry climate, Building and Environment, Vol. 41, No. 2, 2006, pp. 94-108.
[10] Fahmy M., Sharples S. On the development of an urban passive thermal comfort system in Cairo, Egypt, Building and Environment, Vol. 44, No. 9, 2009, pp. 1907‒1916.
[11] Yang X., Zhao L., Bruse M., Meng Q. Evaluation of a microclimate model for predicting the thermal behavior of different ground surfaces, Building and Environment, Vol. 60, 2013, pp. 93‒104.
[12] Ridha S. J. Effect of aspect ratio and symmetrical distribution on urban design in Baghdad City, and the impact of greenery strategies on improving outdoor thermal comfort, IOP Conference Series: Earth and Environmental Science, Vol. 151, 2018, Paper 012035.
[13] Ghaffarianhoseini A., Berardi U., Ghaffarianhoseini A. Thermal performance characteristics of unshaded courtyards in hot and humid climates, Building and Environment, Vol. 87, 2015, pp. 154‒168.
[14] Monam A., Rückert K. The dependence of outdoor thermal comfort on urban layouts, Young Cities - Developing Urban Energy Efficiency Project, Technical University of Berlin, 2013.
[15] Ali-Toudert F., Mayer H. Effects of street design on outdoor thermal comfort, https://www.researchgate.net/publication/242157021_EFFECTS_OF_STREET_DESIGN_
ON_OUTDOOR_THERMAL_COMFORT, (last visited 25 November 2018).
[16] Lahm E., Bruse M. Microclimatic effects of a small urban park in densely built-up areas:
Measurements and model simulations, 5th International Conference on Urban Climate, Lodz, Poland, 1-5 September 2003, pp. 273‒276.
[17] Karakounos I., Dimoudi A., Zoras S. The influence of bioclimatic urban redevelopment on outdoor thermal comfort, Energy and Buildings, Vol. 158, 2018, pp. 1266‒1274.
[18] A holistic microclimate model, ENVI-met http://www.envi-met.info/doku.php?id=apps:
biomet_pmv, (last visited 27 November 2018).
[19] Kariminia S., Ahmad S. S., Omar M., Ibrahim N. Urban outdoor thermal comfort prediction for public square in moderate and dry climate, 2011 IEEE Symposium on Business, Engineering and Industrial Applications, Langkawi, Malaysia, 25-28 September 2011, pp. 308‒309.
[20] Matzarakis A., Rutz F., Mayer H. Modeling the thermal bioclimate in urban areas with the RayMan Model, The 23rdConference on Passive and Low Energy Architecture, Geneva, Switzerland, 6-8 September 2006, pages 1‒4.
[21] Thorsson S., Lindberg F., Eliasson I., Holmer B. Different methods for estimating the mean radiant temperature in an outdoor urban setting, International Journal of Climatology, Special Issue: Urban Climatology, Vol. 27, No. 14, 2007, pp. 1983‒1993.
[22] Groat L. N., Wang D. Architectural research methods, 2nd Ed. 2013.
[23] Energy Design Tools Group, http://energy-design-tools.aud.ucla.edu/climate-consultant/
request-climate-consultant.php, (last visited 3 September 2018).
[24] Széchenyi square, Pécs, https://en.wikipedia.org/wiki/Sz%C3%A9chenyi_square_
(P%C3%A9cs) (last visited 3 September 2018).
[25] Google earth, https://earth.google.com/, (last visited 4 August 2018).
[26] Climate of Hungary, https://www.met.hu/en/eghajlat/magyarorszag_eghajlata/altalanos_
eghajlati_jellemzes/szel/, (last visited 10 August 2018.)
[27] European Insulation Manufacturers Association, EURIMA, https://www.eurima.org/, (last visited 6 September 2018).
[28] ASHRAE Standard 55-2004, Thermal environmental conditions for human occupancy, American Society of Heating, Refrigerating, and Air-Conditioning Engineers, 2004.
[29] Kenawy I., Afifi M. M., Mahmoud A. H. The effect of planning design on thermal comfort in outdoor spaces, First International Conference of Sustainability and the Future, Eelshourouq, Egypt, 23-25 November 2010, pages 1-12.
[30] Beaufort Wind Scale, https://www.spc.noaa.gov/faq/tornado/beaufort.html, (last visited 14 September 2018).
[31] Designing buildings, Wiki share your construction industry knowledge, https://www.
designingbuildings.co.uk/wiki/Mean_radiant_temperature, (last visited 21 November 2018).
![Fig. 1. PMV scale [11]](https://thumb-eu.123doks.com/thumbv2/9dokorg/1063304.70207/3.892.214.594.302.371/fig-pmv-scale.webp)
![Fig. 2. The location of the case study’s site [25]](https://thumb-eu.123doks.com/thumbv2/9dokorg/1063304.70207/4.892.308.651.189.408/fig-location-case-study-s-site.webp)
![Fig. 6. Relative humidity /temperature diagram based on comfort zone according to ASHRAE 55 [28]](https://thumb-eu.123doks.com/thumbv2/9dokorg/1063304.70207/8.892.354.599.479.705/relative-humidity-temperature-diagram-based-comfort-according-ashrae.webp)