Attila M. Nagy is with the Department of Networked Systems and Services, Faculty of Electrical Engineering and Informatics, Budapest University of Techonolgy and Economics, Hungary, e-mail: anagy@hit.bme.hu.
Bernát Wiandt is with the Department of Networked Systems and Services, Faculty of Electrical Engineering and Informatics, Budapest University of Techonolgy and Economics, Hungary, e-mail: bwiandt@hit.bme.hu.
Vilmos Simon is with the Department of Networked Systems and Services, Faculty of Electrical Engineering and Informatics, Budapest University of Techonolgy and Economics, Hungary, e-mail: svilmos@hit.bme.hu.
Transient-based automatic incident detection method for intelligent transport systems
Attila M. Nagy, Bernát Wiandt and Vilmos Simon
DOI: 10.36244/ICJ.2021.3.1
Transient-based automatic incident detection method for intelligent transport systems
Attila M. Nagy, Bernát Wiandt, Vilmos Simon
Abstract—One of the major problems of traffic in big cities today is the occurrence of congestion phenomena on the road network, which has several serious effects not only on the lives of drivers, but also on city inhabitants. In order to deal with these phenomena, it is essential to have an in-depth understanding of the processes that lead to the occurrence of congestion and its spilling over into contiguous areas of the city.
One of the main causes of congestion phenomena is unexpected traffic incidents on major roads and urban freeways, the rapid and reliable detection of which can help reduce negative impacts.
Researching Automatic Incident Detection (AID) has a long history that has again become one of the main subjects of research with the rise of new machine learning methods.
Our article presents a new Transient-based Automatic Incident Detection (TBAID) method we have developed, which uses an approach not yet seen in professional literature to detect the occurrence of incidents. The results of our detailed analysis showed that our method performed better than the methods currently available in terms of both speed and reliability on traffic data collected from freeways.
We also created a new dataset for the examination of our method, because the datasets used in previous research were either too small or not publicly available. Our dataset contains 452 incidents and data measured with dual loop traffic detectors from the immediate vicinity of incidents, which, to the best of our knowledge, is the largest publicly available incident dataset to date.
Index Terms—automatic incident detection, time series analy- sis, congestion, smart cities
I. INTRODUCTION
One of the major problems related to transportation in major cities around the world is the phenomenon of traffic jams and congestion occurring on major roads and urban freeways. Con- gestion has a serious impact not only on the lives of vehicle drivers, but also on the lives of every inhabitant of the city.
Congestion increases energy and fuel consumption, as well as harmful emissions [1], [2]. Other research has focused on the physiological effects of congestion. Air pollution associated with congestion has been shown to increase the chances of developing allergies [3] and to aggravate the symptoms of people who are sensitive to them. In addition, studies have shown that congestion also increases the risk of heart attacks [4].
Attila M. Nagy is with the Department of Networked Systems and Services, Faculty of Electrical Engineering and Informatics, Budapest University of Techonolgy and Economics, Hungary, e-mail: anagy@hit.bme.hu.
Bernát Wiandt is with the Department of Networked Systems and Services, Faculty of Electrical Engineering and Informatics, Budapest University of Techonolgy and Economics, Hungary, e-mail: bwiandt@hit.bme.hu.
Vilmos Simon is with the Department of Networked Systems and Services, Faculty of Electrical Engineering and Informatics, Budapest University of Techonolgy and Economics, Hungary, e-mail: svilmos@hit.bme.hu.
The negative effects listed above illustrate the significance of avoiding and possibly eliminating congestion, as they harm the health of citizens in addition to causing significant economic damage. A reduction of congestion would bring serious economic and social benefits [5].
Intelligent city management systems can provide solutions to these problems or at least significantly reduce negative impacts with the help of Intelligent Transportation Systems (ITS) [6]. The task of these systems is to continually monitor the traffic and to provide information to the urban transport infrastructure designers and operators based on the collected data, as well as to manage the automated allocation of re- sources, for example, opening or closing new lanes, adapting traffic lights to current traffic conditions [7] or assisting route planning applications with accurate forecasts.
There are countless reasons for the occurrence of conges- tion, only some of which can be predicted. Unpredictable congestion phenomena typically do not repeat and are usually caused by unexpected traffic incidents. Research has shown that traffic incidents account for at least 60% of non-recurring congestion [8], [9].
In order to reduce the negative effects of unexpected traffic incidents, it is essential that intelligent city management sys- tems are able to respond as quickly as possible to unexpected situations. In addition to providing useful information to city traffic management, quick and reliable AID can also provide new data for route planning and traffic forecasting algorithms, along with being an important data source for dynamic traffic light control systems.
AID is a long-established area of research that has come back into focus now that new types of data sources and data analysis methods, as well as increasingly used artificial intelligence-based solutions, have become wide-spread [10].
From the start, it has been a major challenge for researchers to address the contradiction between the accuracy and the speed of detection. Looking at the performance of the methods found in professional literature, it can be concluded that although the methods are capable of high detection rates, even close to 100%, they are also very slow to detect incidents, or they send a number of false alarms. The opposite of this phenomenon can also be observed, with rapid detection being achieved but accompanied by a low accuracy of less than 70%. It is important to point out that frequent false detection makes the task of traffic management extremely difficult. False detection can result in incorrect reallocation of resources and modification of traffic light schedules, which can upset the otherwise normal pace of traffic.
Another major challenge with AID is obtaining a suitable Abstract—One of the major problems of traffic in big cities
today is the occurrence of congestion phenomena on the road network, which has several serious effects not only on the lives of drivers, but also on city inhabitants. In order to deal with these phenomena, it is essential to have an in-depth understanding of the processes that lead to the occurrence of congestion and its spilling over into contiguous areas of the city.
One of the main causes of congestion phenomena is unexpected traffic incidents on major roads and urban freeways, the rapid and reliable detection of which can help reduce negative impacts. Researching Automatic Incident Detection (AID) has a long history that has again become one of the main subjects of research with the rise of new machine learning methods.
Our article presents a new Transient-based Automatic Incident Detection (TBAID) method we have developed, which uses an approach not yet seen in professional literature to detect the occurrence of incidents. The results of our detailed analysis showed that our method performed better than the methods currently available in terms of both speed and reliability on traffic data collected from freeways.
We also created a new dataset for the examination of our method, because the datasets used in previous research were either too small or not publicly available. Our dataset contains 452 incidents and data measured with dual loop traffic detectors from the immediate vicinity of incidents, which, to the best of our knowledge, is the largest publicly available incident dataset to date.
Index Terms—automatic incident detection, time series analysis, congestion, smart cities
Transient-based automatic incident detection method for intelligent transport systems
Attila M. Nagy, Bernát Wiandt, Vilmos Simon
Abstract—One of the major problems of traffic in big cities today is the occurrence of congestion phenomena on the road network, which has several serious effects not only on the lives of drivers, but also on city inhabitants. In order to deal with these phenomena, it is essential to have an in-depth understanding of the processes that lead to the occurrence of congestion and its spilling over into contiguous areas of the city.
One of the main causes of congestion phenomena is unexpected traffic incidents on major roads and urban freeways, the rapid and reliable detection of which can help reduce negative impacts.
Researching Automatic Incident Detection (AID) has a long history that has again become one of the main subjects of research with the rise of new machine learning methods.
Our article presents a new Transient-based Automatic Incident Detection (TBAID) method we have developed, which uses an approach not yet seen in professional literature to detect the occurrence of incidents. The results of our detailed analysis showed that our method performed better than the methods currently available in terms of both speed and reliability on traffic data collected from freeways.
We also created a new dataset for the examination of our method, because the datasets used in previous research were either too small or not publicly available. Our dataset contains 452 incidents and data measured with dual loop traffic detectors from the immediate vicinity of incidents, which, to the best of our knowledge, is the largest publicly available incident dataset to date.
Index Terms—automatic incident detection, time series analy- sis, congestion, smart cities
I. INTRODUCTION
One of the major problems related to transportation in major cities around the world is the phenomenon of traffic jams and congestion occurring on major roads and urban freeways. Con- gestion has a serious impact not only on the lives of vehicle drivers, but also on the lives of every inhabitant of the city.
Congestion increases energy and fuel consumption, as well as harmful emissions [1], [2]. Other research has focused on the physiological effects of congestion. Air pollution associated with congestion has been shown to increase the chances of developing allergies [3] and to aggravate the symptoms of people who are sensitive to them. In addition, studies have shown that congestion also increases the risk of heart attacks [4].
Attila M. Nagy is with the Department of Networked Systems and Services, Faculty of Electrical Engineering and Informatics, Budapest University of Techonolgy and Economics, Hungary, e-mail: anagy@hit.bme.hu.
Bernát Wiandt is with the Department of Networked Systems and Services, Faculty of Electrical Engineering and Informatics, Budapest University of Techonolgy and Economics, Hungary, e-mail: bwiandt@hit.bme.hu.
Vilmos Simon is with the Department of Networked Systems and Services, Faculty of Electrical Engineering and Informatics, Budapest University of Techonolgy and Economics, Hungary, e-mail: svilmos@hit.bme.hu.
The negative effects listed above illustrate the significance of avoiding and possibly eliminating congestion, as they harm the health of citizens in addition to causing significant economic damage. A reduction of congestion would bring serious economic and social benefits [5].
Intelligent city management systems can provide solutions to these problems or at least significantly reduce negative impacts with the help of Intelligent Transportation Systems (ITS) [6]. The task of these systems is to continually monitor the traffic and to provide information to the urban transport infrastructure designers and operators based on the collected data, as well as to manage the automated allocation of re- sources, for example, opening or closing new lanes, adapting traffic lights to current traffic conditions [7] or assisting route planning applications with accurate forecasts.
There are countless reasons for the occurrence of conges- tion, only some of which can be predicted. Unpredictable congestion phenomena typically do not repeat and are usually caused by unexpected traffic incidents. Research has shown that traffic incidents account for at least 60% of non-recurring congestion [8], [9].
In order to reduce the negative effects of unexpected traffic incidents, it is essential that intelligent city management sys- tems are able to respond as quickly as possible to unexpected situations. In addition to providing useful information to city traffic management, quick and reliable AID can also provide new data for route planning and traffic forecasting algorithms, along with being an important data source for dynamic traffic light control systems.
AID is a long-established area of research that has come back into focus now that new types of data sources and data analysis methods, as well as increasingly used artificial intelligence-based solutions, have become wide-spread [10].
From the start, it has been a major challenge for researchers to address the contradiction between the accuracy and the speed of detection. Looking at the performance of the methods found in professional literature, it can be concluded that although the methods are capable of high detection rates, even close to 100%, they are also very slow to detect incidents, or they send a number of false alarms. The opposite of this phenomenon can also be observed, with rapid detection being achieved but accompanied by a low accuracy of less than 70%. It is important to point out that frequent false detection makes the task of traffic management extremely difficult. False detection can result in incorrect reallocation of resources and modification of traffic light schedules, which can upset the otherwise normal pace of traffic.
Another major challenge with AID is obtaining a suitable
method for intelligent transport systems
INFOCOMMUNICATIONS JOURNAL 2
dataset. Since incidents are rarely occurring events, collection is difficult in large quantities. It is also important that we have information not only about incidents, but also about traffic data in their immediate vicinity. Unfortunately, the datasets used for research in professional literature contain a small number of incidents (10-30), which is not sufficient for the artificial intelligence models used today, or the dataset has not been made publicly available.
In this article, we would like to offer a solution to the two challenges mentioned above. First, we created an incident dataset containing data from 452 incidents as well as traffic detector data from the immediate vicinity of incidents for the investigated time period. The dataset has been made publicly available to make our results reproducible and to assist related scientific research.
Using the completed dataset, we developed a new AID model. To do this we applied a new approach, in which we used state-of-the-art machine learning tools and devel- oped new, complex features that focus on detecting transient phenomena caused by incidents in traffic data. Our detailed analysis showed that the model we developed can surpass the methods from professional literature in accuracy as well as speed, with low false alarm rates.
The remainder of this article contains the following sections.
In Section II, we present related works found in professional literature. In addition to presenting previously developed AID methods, we also place considerable focus on describing the key features of incidents. The method we have developed is described in Section III. The evaluation of TBAID is performed in Section IV, where we compare it with the results of several machine learning models and previous AID methods. We end our article with a short conclusion in Section V.
II. RELATED RESEARCH
For decades, researchers and city managers have been work- ing on ways to automate the detection of traffic incidents. The reliable and fast Automatic Incident Detection (AID) allows city managers to take preventive action to avoid congestion, as well as route planners and forecasting systems to use this additional information to improve planned routes and forecasts.
The proper implementation of incident detection requires understanding and examination of traffic phenomena caused by incidents. Therefore, in Section II-A we focus on presenting the features defined by professional literature that are currently used for implementing AID. The main AID methods from professional literature are then described in Section II-B.
A. Incidents
An incident is defined as any non-recurring event on a road network that reduces the capacity of a given road segment.
An incident can be an accident, a pulled over or broken down vehicle, traffic hazards, debris on the road, fallen cargo, road network maintenance or refurbishment and other special, non- emergency events [11], [9]. Events in the previous list are referred to as incident types.
To categorize incidents, the Traffic Incident Management Handbook (TIMH) [12] defines an incident profiling and classification procedure based on the type, location (has it blocked a lane?) and duration of the incident. The incident classification shows that we have data for 70% of all incidents, of which 80% are related to vehicles pulled over, 10% are acci- dents and the remaining 10% are classified in other categories.
It can be seen that in all cases the incidents that block lanes are causing relatively large delays, but the incidents at the side of the road can also cause measurable capacity reductions.
Accidents blocking multiple lanes cause considerably large delays. This means that incidents that have no effect on traffic development cannot be detected from traffic data, so there will definitely be a subset of incidents that are impossible to detect with a traffic-data based AID.
The Manual on Uniform Traffic Control Devices (MUTCD) [13] compiles incident types into three main categories based on a similar set of criteria. Major incidents last for at least 2 hours and are typically fatal accidents or other incidents involving dangerous substances that are difficult to clean getting on the road. When this happens, it is often necessary to close all lanes (interestingly, these 2 hours are not in line with the maximum 90-minute value in TIMH [12]). The length of intermediate incidences falls between 30 minutes and 2 hours. This may require the complete closing of the given road segment, but partial roadblocks are more common.Minor incidencesare those of less than 30 minutes that rarely require lane closure. Typically this includes vehicles that are pulled over or small collisions.
Recently, the length of incidents has been the subject of several studies [14], [15], [16], as this may be valuable information for road network management organizations, route planning algorithms or traffic forecasting services. These re- searches have found that different types of incidents have different lengths that correspond to them. A study conducted in Australia [15] showed that the accidents included in the study lasted on average 43 minutes and the incidents related to pulled-over vehicles lasted on average 41 minutes. Hazards have the longest lasting effects, with an average length of 74 minutes. Another interesting observation was that incidents last longer on weekdays than on weekends.
traffic direction
incident location Upstream
detector Downstream
detector
Du I Dv
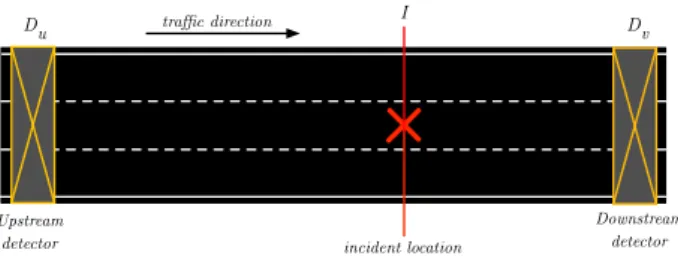
Fig. 1: Configuration method for examining traffic incidents.
A common examination method for traffic incidents is illus- trated in Figure 1, where incidents are detected with data from traffic detectors [17], [18], [19], [20], [21]. Of course, there are other methods [22], [23], which determine the occurrence of an incident from travel time data or speed/acceleration data
Fig. 1: Configuration method for examining traffic incidents.
INFOCOMMUNICATIONS JOURNAL 2
dataset. Since incidents are rarely occurring events, collection is difficult in large quantities. It is also important that we have information not only about incidents, but also about traffic data in their immediate vicinity. Unfortunately, the datasets used for research in professional literature contain a small number of incidents (10-30), which is not sufficient for the artificial intelligence models used today, or the dataset has not been made publicly available.
In this article, we would like to offer a solution to the two challenges mentioned above. First, we created an incident dataset containing data from 452 incidents as well as traffic detector data from the immediate vicinity of incidents for the investigated time period. The dataset has been made publicly available to make our results reproducible and to assist related scientific research.
Using the completed dataset, we developed a new AID model. To do this we applied a new approach, in which we used state-of-the-art machine learning tools and devel- oped new, complex features that focus on detecting transient phenomena caused by incidents in traffic data. Our detailed analysis showed that the model we developed can surpass the methods from professional literature in accuracy as well as speed, with low false alarm rates.
The remainder of this article contains the following sections.
In Section II, we present related works found in professional literature. In addition to presenting previously developed AID methods, we also place considerable focus on describing the key features of incidents. The method we have developed is described in Section III. The evaluation of TBAID is performed in Section IV, where we compare it with the results of several machine learning models and previous AID methods. We end our article with a short conclusion in Section V.
II. RELATED RESEARCH
For decades, researchers and city managers have been work- ing on ways to automate the detection of traffic incidents. The reliable and fast Automatic Incident Detection (AID) allows city managers to take preventive action to avoid congestion, as well as route planners and forecasting systems to use this additional information to improve planned routes and forecasts.
The proper implementation of incident detection requires understanding and examination of traffic phenomena caused by incidents. Therefore, in Section II-A we focus on presenting the features defined by professional literature that are currently used for implementing AID. The main AID methods from professional literature are then described in Section II-B.
A. Incidents
An incident is defined as any non-recurring event on a road network that reduces the capacity of a given road segment.
An incident can be an accident, a pulled over or broken down vehicle, traffic hazards, debris on the road, fallen cargo, road network maintenance or refurbishment and other special, non- emergency events [11], [9]. Events in the previous list are referred to as incident types.
To categorize incidents, the Traffic Incident Management Handbook (TIMH) [12] defines an incident profiling and classification procedure based on the type, location (has it blocked a lane?) and duration of the incident. The incident classification shows that we have data for 70% of all incidents, of which 80% are related to vehicles pulled over, 10% are acci- dents and the remaining 10% are classified in other categories.
It can be seen that in all cases the incidents that block lanes are causing relatively large delays, but the incidents at the side of the road can also cause measurable capacity reductions.
Accidents blocking multiple lanes cause considerably large delays. This means that incidents that have no effect on traffic development cannot be detected from traffic data, so there will definitely be a subset of incidents that are impossible to detect with a traffic-data based AID.
The Manual on Uniform Traffic Control Devices (MUTCD) [13] compiles incident types into three main categories based on a similar set of criteria. Major incidents last for at least 2 hours and are typically fatal accidents or other incidents involving dangerous substances that are difficult to clean getting on the road. When this happens, it is often necessary to close all lanes (interestingly, these 2 hours are not in line with the maximum 90-minute value in TIMH [12]). The length of intermediate incidences falls between 30 minutes and 2 hours. This may require the complete closing of the given road segment, but partial roadblocks are more common.Minor incidencesare those of less than 30 minutes that rarely require lane closure. Typically this includes vehicles that are pulled over or small collisions.
Recently, the length of incidents has been the subject of several studies [14], [15], [16], as this may be valuable information for road network management organizations, route planning algorithms or traffic forecasting services. These re- searches have found that different types of incidents have different lengths that correspond to them. A study conducted in Australia [15] showed that the accidents included in the study lasted on average 43 minutes and the incidents related to pulled-over vehicles lasted on average 41 minutes. Hazards have the longest lasting effects, with an average length of 74 minutes. Another interesting observation was that incidents last longer on weekdays than on weekends.
traffic direction
incident location Upstream
detector Downstream
detector
Du I Dv
Fig. 1: Configuration method for examining traffic incidents.
A common examination method for traffic incidents is illus- trated in Figure 1, where incidents are detected with data from traffic detectors [17], [18], [19], [20], [21]. Of course, there are other methods [22], [23], which determine the occurrence of an incident from travel time data or speed/acceleration data
extracted from vehicle trajectories, but we won’t deal with these approaches here.
IncidentI is detected using two traffic detectors:Du (up- stream) andDd (downstream). In relation to traffic direction, theupstreamdetector is located in the pre-incident area, while the downstream detector is monitoring traffic in the post- incident segment. Usingupstreamanddownstream detectors, several articles break down the investigated road network into segments, where detection is carried out.
The detectors typically measureflow,speedandoccupancy values, which are always determined for consecutive time intervals of a fixed length. Typical time intervals include 30 seconds, 5 minutes and 1 hour.Flowrepresents the number of vehicles per time unit (veh/h) andspeedrepresents the average speed of vehicles passing by a detector for a given time interval.Occupancyindicates the percentage of time vehicles were over a detector for a given time interval.
In case of incidentI, different phenomena may be observed on theupstreamand downstreamdetectors [24].
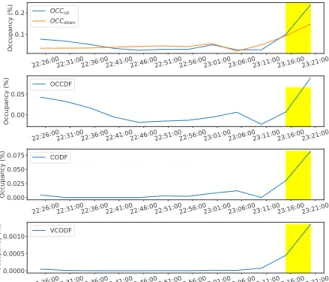
In order to better illustrate the differences in the forming traffic patterns between upstream and downstream detectors, a comparison of different measured metrics can be found in Figure 2 for three different traffic demands. If, as a result of the incident, the capacity of the affected road segment is reduced at the location of the incident, vehicles will start to pile up when traffic demand rises above this amount on the pre-incident segment towards theupstreamdetector. As soon as the effect reaches theDu upstream detector, significantly reduced flow and speed values can be measured (Figure 2c and Figure 2e), while occupancy, in contrast, increases (Figure 2a). However, it is important to note that if the traffic demand is low enough, it is impossible to detect the incident from traffic detector data, since even with reduced capacity, the road segment can serve the current traffic demand.
In the meantime, the measured speed values on the Dd downstreamdetector start to increase up to the free-flow speed (Figure 2d).
Free-flow speed is the speed at which vehicle drivers can go when other vehicles do not impede their movement [25].
The vehicles are congested before the incident, therefore the flow and occupancy values measured on the downstream detector will show a declining trend compared to the pre- incident values (Figure 2f and Figure 2b). Another important observation is that the effect on theupstreamdetector appears slower than on the downstream detector, as the congestion phenomenon propagating in theupstreamdirection is moving slower than the vehicles leaving the incident.
As a first step we looked at the occupancy time series.
Figure 2a shows a dramatic increase in occupancy in case of all three traffic demands after the occurrence of the incident with variable delay. An interesting observation of theupstream is that the time it takes for the effect of the incident to appear depends on the traffic demand. The higher the traffic demand, the faster the effect appears. This is logical, since vehicles are congesting faster behind each other.
It is important to note that depending on the position of the incident between two measuring stations, the effect of the incident on the detectors appears with different delays.
In contrast to upstream, the phenomenon that appears down- stream (Figure 2b) appears quite quickly, but even though the effect can be detected it is less distinct than in the case of upstream. The time of the effect appearing downstream does not depend on traffic demand.
A drastic change, much like upstream occupancy, can be seen in Figure 2c, which shows upstream speeds. After the incident, the measured speed started to decrease sharply with the delay, depending on the traffic demand. As seen in Figure 2d, the downstream speed data cannot detect the effect of the incident.
The pattern of the upstream flow time series shown in Figure 2e is a surprising phenomenon. These time series do not show any difference, regardless of traffic demand, although the measurements appear noisy. The effect of the incident is much more prevalent in the downstream flow time series shown in Figure 2f. Here we can see a decrease in flow rate after the incident occurred. The bigger the traffic demand, the greater the decrease. This phenomenon confirms that due to a decrease in capacity, only part of the traffic demand can be adequately satisfied.
Of course, there is no guarantee that an occurrence of an incident will cause congestion. Incidents only cause problems on a given road segment if the current traffic demand is greater than the capacity of the road segment. For example, on a three- lane highway, a pulled over car is often not a problem even with higher traffic demands. Another example could be an accident at night on a three-lane highway that occupies only the outer lane. Although the capacity of the road segment is temporarily reduced, the effect can hardly be detected due to the minimal traffic demand at night. Another extreme is when an incident occurs on an already congested road segment. In this case, it is also not possible to detect an incident simply by taking the detector data into account.
B. Incident detection methods
An examination of the effects of incidents has shown that the occurrence of an incident distorts the time series of the traffic data in a way that is readily detectable. The challenge is that, depending on the type of incident, the capacity of the road network, the current traffic demand, and the distance between the detectors, the effect appears in the data at a different extent and delay. Because of this, for a truly reliable and rapid detection method it is necessary to carry out our studies on a dataset that is large and contains many different scenarios.
AID methods have been continuously published by re- searchers since the 1970s, but the area is still actively researched thanks to the spread of new machine learning methods. In this section, the significant AID methods from professional literature will be described. Since our own method is based on data from traffic detectors, we mainly focused on those methods that use detectors as data sources as well.
Of course, methods based on other data sources will also described.
In professional literature, three main metrics are generally used to compare the performance of AID methods. The Detection Rate (DR) represents the ratio of correctly detected
method for intelligent transport systems
INFOCOMMUNICATIONS JOURNAL 4
(a) Different occupancy time series
measured on the upstream detector. (b) Different occupancy time series measured on the downstream detec- tor.
(c) Different speed time series mea- sured on the upstream detector.
(d) Different speed time series mea-
sured on the downstream detector. (e) Different flow time series mea-
sured on the upstream detector (f) Different flow time series mea- sured on the downstream detector.
Fig. 2: Time series measured on upstream and downstream detectors for different traffic demands [24].
incidents to the total number of incidents. Mean time to detect (MTTD) contains the average amount of time needed to detect incidents. False Alarm Rate (FAR) is the ratio of false incidents detected when no incident actually occurred.
The metrics are detailed in Section IV-B.
To make the comparison of methods fair, we have imple- mented them wherever possible. It is important to point out that the performance of each method was measured on the new incident dataset described in our article, so that the operation of the methods is actually comparable, as each method had to recognize the same incidents. The results are summarized in Table III.
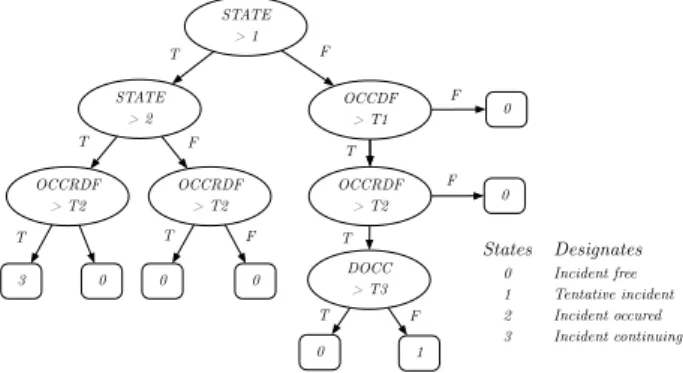
One of the best known of the early AID methods is the California algorithm [26], of which several modified versions have been made [27]. The method compares the occupancy values measured by two adjacent traffic detectors. The steps for comparison are shown in Figure 3, which is from one of the most frequently referenced: the 7th version of the algorithm.
The 3 variable denotes the difference between the occupancy values measured on the detectors, the OCCRDF variable denotes the ratio of the difference between occupancy values measured on the detectors, and theDOCC variable denotes the occupancy value of the second detector in the direction of travel.
If these are larger than the pre-set threshold values T1, T2, T3, then the method considers the measurement to be an incident. Although the method is simple and surprisingly effective, the three thresholds are difficult to adjust. Setting these thresholds incorrectly and using noisy datasets can cause high FAR values. When comparing the results, the algorithm
achieved 91.85% DR, 7.73% FAR and 7.28-minute MTTD values, which can be considered an average performance.
In order to reduce noise induced FAR, a Low-pass (LP) filter is used in the Minnesota algorithm [28], which is applied separately to the occupancy time series of the two detectors.
The time series were examined with disjoint time intervals of 30 seconds. The operation of the algorithm is similar to that of the California algorithm: the steps and two thresholds defined by experts can be used to determine whether an incident had occurred at a given time. The disadvantage of the algorithm is that it cannot distinguish between congestion occurring because of a narrow cross section and actual incidents. Our studies also showed that using the parameter settings proposed in the article, although the DR value was high (99.25%) and only 2.2 minutes were measured for the MTTD value, the FAR value was extremely high at 48.23%.
Noise-induced difficulties are addressed by the University of California, Berkeley (UCB) algorithm [29] with a cumulative difference in occupancy values.
To do this, first the sum of the occupancy values measured so far on the two adjacent detectors is calculated separately, and then the difference between the two sums is taken.
According to the authors, the change in the difference of the cumulative occupancy values follows Random-walk move- ment, so if the magnitude of movement rises above a pre-set threshold, their method identifies the given time as an incident.
Our studies have shown that the method can achieve a low MTTD value of 3.34 minutes and a 3.4% FAR value, but the value of DR was only 82.22%, which is low compared to other methods.
Fig. 2: Time series measured on upstream and downstream detectors for different traffic demands [24].
(a) Different occupancy time series
measured on the upstream detector. (c) Different speed time series mea-
sured on the upstream detector.
(e) Different dow time series mea- sured on the upstream detector.
(b) Different occupancy time series measured on the downstream detector.
(d) Different speed time series mea-
sured on the downstream detector. (f) Different dow time series mea-
sured on the downstream detector.
INFOCOMMUNICATIONS JOURNAL 4
(a) Different occupancy time series
measured on the upstream detector. (b) Different occupancy time series measured on the downstream detec- tor.
(c) Different speed time series mea- sured on the upstream detector.
(d) Different speed time series mea-
sured on the downstream detector. (e) Different flow time series mea-
sured on the upstream detector (f) Different flow time series mea- sured on the downstream detector.
Fig. 2: Time series measured on upstream and downstream detectors for different traffic demands [24].
incidents to the total number of incidents. Mean time to detect (MTTD) contains the average amount of time needed to detect incidents. False Alarm Rate (FAR) is the ratio of false incidents detected when no incident actually occurred.
The metrics are detailed in Section IV-B.
To make the comparison of methods fair, we have imple- mented them wherever possible. It is important to point out that the performance of each method was measured on the new incident dataset described in our article, so that the operation of the methods is actually comparable, as each method had to recognize the same incidents. The results are summarized in Table III.
One of the best known of the early AID methods is the California algorithm [26], of which several modified versions have been made [27]. The method compares the occupancy values measured by two adjacent traffic detectors. The steps for comparison are shown in Figure 3, which is from one of the most frequently referenced: the 7th version of the algorithm.
The 3 variable denotes the difference between the occupancy values measured on the detectors, the OCCRDF variable denotes the ratio of the difference between occupancy values measured on the detectors, and theDOCC variable denotes the occupancy value of the second detector in the direction of travel.
If these are larger than the pre-set threshold values T1, T2, T3, then the method considers the measurement to be an incident. Although the method is simple and surprisingly effective, the three thresholds are difficult to adjust. Setting these thresholds incorrectly and using noisy datasets can cause high FAR values. When comparing the results, the algorithm
achieved 91.85% DR, 7.73% FAR and 7.28-minute MTTD values, which can be considered an average performance.
In order to reduce noise induced FAR, a Low-pass (LP) filter is used in the Minnesota algorithm [28], which is applied separately to the occupancy time series of the two detectors.
The time series were examined with disjoint time intervals of 30 seconds. The operation of the algorithm is similar to that of the California algorithm: the steps and two thresholds defined by experts can be used to determine whether an incident had occurred at a given time. The disadvantage of the algorithm is that it cannot distinguish between congestion occurring because of a narrow cross section and actual incidents. Our studies also showed that using the parameter settings proposed in the article, although the DR value was high (99.25%) and only 2.2 minutes were measured for the MTTD value, the FAR value was extremely high at 48.23%.
Noise-induced difficulties are addressed by the University of California, Berkeley (UCB) algorithm [29] with a cumulative difference in occupancy values.
To do this, first the sum of the occupancy values measured so far on the two adjacent detectors is calculated separately, and then the difference between the two sums is taken.
According to the authors, the change in the difference of the cumulative occupancy values follows Random-walk move- ment, so if the magnitude of movement rises above a pre-set threshold, their method identifies the given time as an incident.
Our studies have shown that the method can achieve a low MTTD value of 3.34 minutes and a 3.4% FAR value, but the value of DR was only 82.22%, which is low compared to other methods.
![Fig. 2: Time series measured on upstream and downstream detectors for different traffic demands [24].](https://thumb-eu.123doks.com/thumbv2/9dokorg/763836.33469/4.871.110.719.132.540/series-measured-upstream-downstream-detectors-different-traffic-demands.webp)