Short version of the Smartphone Addiction Scale in Chinese adults:
Psychometric properties, sociodemographic, and health behavioral correlates
TZU TSUN LUK1, MAN PING WANG1*, CHEN SHEN2, ALICE WAN3, PUI HING CHAU1, JOHN OLIFFE4, KASISOMAYAJULA VISWANATH5,6, SOPHIA SIU-CHEE CHAN1and TAI HING LAM3
1School of Nursing, The University of Hong Kong, Hong Kong, China
2Department of Epidemiology and Biostatistics, Imperial College London, London, UK
3School of Public Health, The University of Hong Kong, Hong Kong, China
4School of Nursing, University of British Columbia, Vancouver, Canada
5Center for Community-Based Research, Dana-Farber Cancer Institute, Harvard TH Chan School of Public Health, Boston, MA, USA
6Department of Social and Behavioral Sciences, Harvard TH Chan School of Public Health, Boston, MA, USA (Received: June 27, 2018; revised manuscript received: September 18, 2018; accepted: September 20, 2018)
Background and aims:Problematic smartphone use (PSU) is an emerging but understudied public health issue. Little is known about the epidemiology of PSU at the population level. We evaluated the psychometric properties of the Smartphone Addiction Scale–Short Version (SAS-SV) and examined its associated sociodemographic factors and health behaviors in Chinese adults in Hong Kong. Methods:A random sample of 3,211 adults aged ≥18 years (mean±SD: 43.3±15.7, 45.3% men) participated in a population-based telephone survey in Hong Kong and completed the Chinese SAS-SV. Multivariable linear regressions examined the associations of sociodemographic factors, health behaviors, and chronic disease status with SAS-SV score. Data were weighted by age, sex, and education attainment distributions of the Hong Kong general population.Results:The Chinese SAS-SV is internally consistent (Cronbach’s α=.844) and stable over 1 week (intraclass correlation coefficient=.76, p<.001).
Confirmatory factor analysis supported a unidimensional structure established by previous studies. The weighted prevalence of PSU was 38.5% (95% confidence interval: 36.9%, 40.2%). Female sex, younger age, being married/
cohabitated or divorced/separated (vs. unmarried), and lower education level were associated with a higher SAS-SV score (allps<.05). Current smoking, weekly to daily alcohol drinking, and physical inactivity predict greater PSU after controlling for sociodemographic factors and mutual adjustment. Discussion and conclusions:The Chinese SAS-SV was found valid and reliable for assessing PSU in Hong Kong adults. Several sociodemographic and health behavioral factors were associated with PSU at the population level, which may have implication for prevention of PSU and future research.
Keywords: problematic mobile phone use, smartphone dependence, smartphone ownership, epidemiology, population studies, validation studies
INTRODUCTION
Problematic use of mobile information and communication technologies (ICTs) that directly lead to significant and persistent functional impairments and distress may constitute behavioral addiction (Kardefelt-Winther et al., 2017).
Emerging research has found that problematic use of mobile phone is associated with several health hazards, ranging from psychosocial disturbances like anxiety and depression (Elhai, Dvorak, Levine, & Hall, 2017) to potentially fatal injuries from traffic accidents wherein mobile phone use was a contributing factor (Cazzulino, Burke, Muller, Arbogast, &
Upperman, 2014;Kim, Min, Kim, & Min, 2017), and social problems like poor family and peer relationship (Hawi &
Samaha, 2017;Wang et al., 2017). However, partly due to the diverse psychometric scales used to assess mobile phone use dependency, very little is known about its prevalence and
course, and its conceptualization is much debated (Billieux, Maurage, Lopez-Fernandez, Kuss, & Griffiths, 2015;
Panova & Carbonell, 2018).
The Smartphone Addiction Scale (SAS), originally developed in Korean but published in English, is a contem- porary scale developed to assess problematic smartphone use (PSU;Kwon, Lee, et al., 2013). Alternative measures of PSU include Smartphone Addiction Inventory (Lin et al., 2014), Smartphone Addiction Proneness Scale (Kim, Lee, Lee, Nam, & Chung, 2014), Problematic Mobile Phone Use Questionnaire–Revised (Kuss, Harkin, Kanjo, & Billieux, 2018), and Implicit Association Test measures for
* Corresponding author: Man Ping Wang; School of Nursing, The University of Hong Kong, 21 Sassoon Road, Hong Kong, China;
Phone: +852 3917 6636; Fax: +852 2872 6079; E-mail:mpwang@
hku.hk
This is an open-access article distributed under the terms of theCreative Commons Attribution-NonCommercial 4.0 International License, which permits unrestricted use, distribution, and reproduction in any medium for non-commercial purposes, provided the original author and source are credited, a link to the CC License is provided, and changes–if any–are indicated.
DOI: 10.1556/2006.7.2018.105 First published online November 12, 2018
Smartphone and Internet Addiction (Roh et al., 2018).
The short version of SAS (SAS-SV;Kwon, Kim, Cho, &
Yang, 2013) is among the most widely used instruments with validated translations in Turkish (Noyan, Darçın, Nurmedov, Yılmaz, & Dilbaz, 2015), Italian (De Pasquale, Sciacca, & Hichy, 2017), Spanish and French (Lopez- Fernandez, 2017), and Arabic (Sfendla et al., 2018), making it a useful instrument for cross-cultural comparisons and further research. However, the psychometric properties of the Chinese translation of SAS-SV are unknown.
The original SAS contains 33 items assessing “daily life disturbance,” “positive anticipation,” “withdrawal,”
“cyberspace-oriented relationship,” “overuse,” and “toler- ance” symptoms of PSU (Kwon, Lee, et al., 2013). A content validation process was conducted with three items from the “daily life disturbance,” four from the “with- drawal,”and one each from the“cyberspace-oriented rela- tionship,” “overuse,”and“tolerance”subscales selected to form the 10-item SAS-SV (Kwon, Kim, et al., 2013).
Although the scale developers did not report its factor structure (Kwon, Kim, et al., 2013), validation studies have suggested a single factor structure for the SAS-SV (De Pasquale et al., 2017; Hawi & Samaha, 2017;Lopez- Fernandez, 2017;Noyan et al., 2015;Sfendla et al., 2018).
Confirmatory factor analysis (CFA) is warranted to validate the unidimensional structure of the instrument in Chinese.
Identifying sociodemographic and health behavioral risk factors associated with PSU can help identify at-risk popu- lation for further research and guide targeted interventions.
Most related studies to date were conducted in relatively small, convenience samples of adolescents or young adults (typically college students) with uncertain generalizability (De-Sola Gutiérrez, de Fonseca, & Rubio, 2016). As smart- phone use continues to rise among adults and older people, population studies are needed for a broader understanding of the PSU phenomenon.
Hong Kong is a technologically advanced city of China and ranked 6th out of 175 countries in the ICT Development Index in 2016 (International Telecommunication Union, 2016). The proportion of smartphone users surged rapidly from 54.0% in 2012 to 85.6% in 2016 (Census and Statistics Department, 2017). Therefore, capitalizing on the extensive smartphone penetration in Hong Kong, this study aims to (a) evaluate the psychometric properties of the Chinese translation of SAS-SV and (b) examine the sociodemo- graphic and health behavior correlates of PSU in the general adult population in Hong Kong.
METHODS
Participants and procedure
The Hong Kong Family and Health Information Trends Survey (hereafter referred to as “the Survey”), under the project “FAMILY: A Jockey Club Initiative for a Harmonious Society,”is a cross-sectional, population-based telephone study. The Survey aimed to examine the use of ICTs in relation to family and individual health and behavior in the Hong Kong general public. Details of the methods have been reported in previous phases of the Survey
(Shen et al., 2017;Wang, Viswanath, Lam, Wang, & Chan, 2013). The present phase, conducted from February to May 2017, included the measure of PSU.
The Public Opinion Programme of the University of Hong Kong, a reputable local survey agency, was commis- sioned to implement the Survey. Cantonese-speaking Hong Kong residents aged ≥18 years were selected by a two- stage, probability-based sampling procedure. In the first stage, landline telephone numbers were randomly generated using known dialing codes retrieved from the official num- bering plan for telecommunication services, which covers nearly all residents in Hong Kong. After excluding invalid numbers according to computer and manual dialing records, the generated numbers were randomly listed for telephone contact. In the second stage, upon successful contact with a household, an eligible household member whose coming birthday was closest to the interview date was invited to participate in the anonymous survey. Participation is completely voluntary with no incentive. Each interview was administered in Cantonese by a trained interviewer using a web-based computer-assisted telephone interview system.
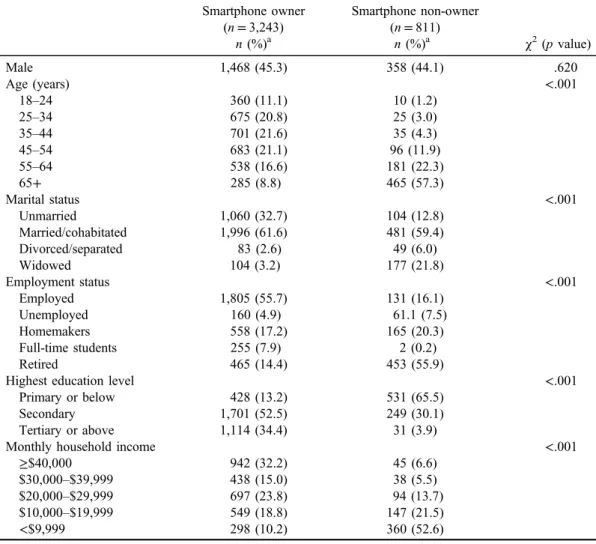
A total of 4,054 out of 5,573 eligible subjects completed the Survey (response rate=70.2%), with 80.0% (3,243/4,054) reporting owning a smartphone. Smartphone ownership was associated with younger age, unmarried, employed, higher education level, and higher monthly household income (all ps<.001), but not with sex (p=.63; Table1).
Measures
The SAS-SV contains 10 items, each scores on a Likert scale of 1 (strongly disagree) to 6 (strongly agree). The sum of these items gives an overall SAS-SV score (range: 10–60) with higher score indicating PSU. A native Chinese fluent in English translated the English SAS-SV into Chinese with local adaptations. We modified the 8th item of the original SAS-SV “Constantly checking my smartphone so as not to miss conversations between other people on Twitter or Facebook”by replacing“Twitter or Facebook”with“What- sApp, Facebook, or WeChat,”which were more relevant to this study population. Backward translation was conducted by a native English speakerfluent in Chinese. Discrepancies were resolved by discussion and further modification before the instrument was finalized for use in this study.
Respondents reported their smoking status (categorized into “never smoker,” “former smoker,” and “current smoker”), alcohol drinking habit [“never drinker,” “former drinker,” “occasional drinker (<1 day/month),” “monthly drinker (1–3 days/month),” and “weekly to daily drinker (≥1 day/week)”], and number of days in the past week they performed at least 10 min of moderate physical exercise (recoded as“none,” “1–4 days,”and“5–7 days”). History of doctor-diagnosed chronic diseases was also reported (dichotomized as “yes”or “no”).
We also collected data on sex, age, and marital status (“unmarried,” “married/cohabitated,” “divorced/separated,” and “widowed”). Information on indicators of socioeco- nomic status (SES), including highest education level (“primary or below,” “secondary,”and“tertiary or above”), employment status (“employed,” “unemployed,” “home- makers,” “full-time students,”and“retired”), and monthly
household income [“≥$40,000,” “$30,000–$39,999,”
“$20,000–$29,999,” “$10,000–$19,999,” and “≤$9,999” (reported in HKD; HKD7.8≈USD1)], was also collected.
Statistical analysis
Cronbach’sαwas used to assess the internal consistency of the Chinese SAS-SV. Item analyses were conducted by calculating the corrected item-total correlation and Cronbach’sαfor items deleted from the scale. One hundred subjects were randomly selected to evaluate 1-week test–retest reliability using intraclass correlation coefficient.
CFA with diagonally weighted least square estimation was used to verify the single factor structure for SAS-SV using LISREL version 9.30 (Li, 2016). All 10 items of SAS-SV were specified as ordinal variables. The asymptotic covariance matrix needed for the estimation was computed using PRELIS included in the LISREL application. Addi- tional covariations among items 1–3 and items 4–7 in the SAS-SV were expected as they were similarly formulated and conceptualized to assess the “daily life disturbances” symptom and “withdrawal” symptom, respectively, in the original SAS (Kwon, Lee, et al., 2013). Residual covar- iances were thus freely estimated among items 1–3 and items 4–7 a priori to reflect the intended design of SAS-SV (Cole, Ciesla, & Steiger, 2007). No post-hoc modifications
were allowed. Fit index value of<0.10 for root mean square error of approximation,>0.90 for comparativefit index, and
>0.90 for Tucker–Lewis index indicate satisfactory model fitness (Hu & Bentler, 1995; MacCallum, Browne, &
Sugawara, 1996).
Given the large sample size (n>300), we examined the normality of SAS-SV score by checking its skewness and kurtosis, with skewness of≤2 and kurtosis of≤7 indicating a normal distribution (Kim, 2013). Floor and ceiling effects were evaluated by measuring the proportions of subjects scoring the lowest and highest SAS-SV scores, with≤15%
indicating satisfactory floor and ceiling effects (Terwee et al., 2007).
To enhance the representativeness of the results of this study, all data were weighted by the sex, age, and education attainment distributions of the Hong Kong general popula- tion using random iterative method (Izrael, Hoaglin, &
Battaglia, 2004). Sociodemographic profiles of the partici- pants with or without a smartphone were compared usingχ2 tests. To determine the prevalence of PSU in the Hong Kong population for cross-cultural comparison, the widely used SAS-SV cut-off scores of ≥31 for males and ≥33 for females were used as proposed by the scale developers (Kwon, Kim, et al., 2013). Multivariable linear regressions were used to compute regression coefficients (b) of SAS-SV score in relation to all sociodemographic factors.
Table 1. Sociodemographic of the sample by smartphone ownership (N=4,054) Smartphone owner
(n=3,243)
Smartphone non-owner (n=811)
χ2(pvalue)
n(%)a n(%)a
Male 1,468 (45.3) 358 (44.1) .620
Age (years) <.001
18–24 360 (11.1) 10 (1.2)
25–34 675 (20.8) 25 (3.0)
35–44 701 (21.6) 35 (4.3)
45–54 683 (21.1) 96 (11.9)
55–64 538 (16.6) 181 (22.3)
65+ 285 (8.8) 465 (57.3)
Marital status <.001
Unmarried 1,060 (32.7) 104 (12.8)
Married/cohabitated 1,996 (61.6) 481 (59.4)
Divorced/separated 83 (2.6) 49 (6.0)
Widowed 104 (3.2) 177 (21.8)
Employment status <.001
Employed 1,805 (55.7) 131 (16.1)
Unemployed 160 (4.9) 61.1 (7.5)
Homemakers 558 (17.2) 165 (20.3)
Full-time students 255 (7.9) 2 (0.2)
Retired 465 (14.4) 453 (55.9)
Highest education level <.001
Primary or below 428 (13.2) 531 (65.5)
Secondary 1,701 (52.5) 249 (30.1)
Tertiary or above 1,114 (34.4) 31 (3.9)
Monthly household income <.001
≥$40,000 942 (32.2) 45 (6.6)
$30,000–$39,999 438 (15.0) 38 (5.5)
$20,000–$29,999 697 (23.8) 94 (13.7)
$10,000–$19,999 549 (18.8) 147 (21.5)
<$9,999 298 (10.2) 360 (52.6)
Note.aWeighted by age, sex, and education attainment distribution of the Hong Kong general population.
The associations of health behaviors and chronic disease status with SAS-SV scores were also examined with adjust- ment of the sociodemographic factors. Given the ordinal responses, age, highest education level, monthly household income, and physical activity were analyzed as continuous variables in separate models to calculate the pvalues for linear trend (p for trend). All statistical analyses (except CFA) were conducted using Stata/IC version 13.1 (Stata- Corp LLC, College Station, TX, USA).
Ethics
The study was conducted in accordance with the Declaration of Helsinki. Ethical approval was granted by the institution- al review board of the University of Hong Kong/Hospital Authority West Cluster. All participants were informed about the study and provided verbal informed consent. The telephone interviews were tape-recorded for quality check- ing with participants’consent. The records were then erased 6 months after the completion of the Survey.
RESULTS
Sample characteristics
After excluding those with missing data in any item of SAS-SV (n=32), 3,211 subjects were included in the regression analyses. The mean (SD, range) age was 43.3 (15.7, 18–96) years and 45.3% were male.
Psychometric properties of the Chinese SAS-SV
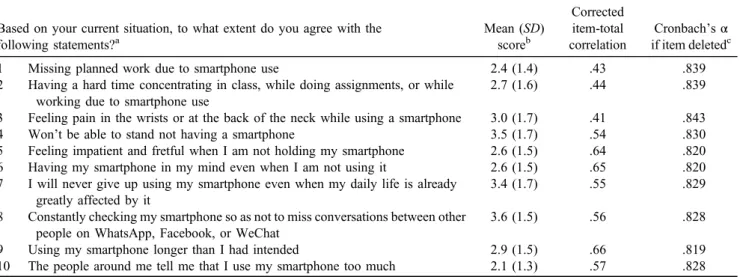
Table 2 shows that the 10 items had corrected item-total correlations of .41–.66, exceeding the acceptable cut-off of .40. The Cronbach’sα of the scale was .844. Removal of any item slightly reduced the internal consistency, which ranged from .819 to .843. Intraclass correlation for 1-week test–retest reliability was .76 (p<.001; n=100). CFA showed that the single factor structure for the Chinese
translation of SAS-SV exhibited acceptable fit (root mean square error of approximation=0.084; comparative fit index=0.98; Tucker–Lewis index=0.96).
The mean (SD) SAS-SV score was 28.9 (10.1) and generally followed a normal distribution (skewness=0.28;
kurtosis=2.55). Of all subjects, 1.9% achieved the lowest possible score and 0.2% achieved the highest possible score, suggesting minimal floor and ceiling effects (≤15%).
Sociodemographic correlates of SAS-SV score
The mean [95% confidence interval (CI)] SAS-SV scores were 27.9 (27.4, 28.4) in males and 29.7 (29.3, 30.2) in females (p<.001). The corresponding prevalence (95% CI) of PSU was 37.7% (35.3%, 40.3%) and 39.2% (36.9%, 41.5%), respectively (p=.56).
Both bivariable and multivariable analyses showed that being female (p<.001) and younger (p for trend<.001) were associated with higher scores in SAS-SV compared to male and older respondents (Table 3). After adjusting for other sociodemographic factors, higher SAS-SV scores were observed in married/cohabitating (b=2.72; 95%
CI=1.60, 3.84) and divorced/ separated (b=3.31; 95%
CI=0.79, 5.82) respondents relative to those who were unmarried. Education level was inversely associated with SAS-SV score (pfor trend=.008). Compared to those with monthly household income of “≥$40,000,”a higher SAS- SV score was observed for respondents in the category of
“$10,000–$19,999”(b=2.32; 95% CI=1.16, 3.47) but not the other income groups. Homemakers had lower SAS-SV score (b=−1.35; 95% CI=−2.51, −0.19) than employed respondents.
Health behavior correlates of SAS-SV score
Table 4 shows that current smokers and weekly to daily drinkers had higher SAS-SV scores than never smokers (b=1.48; 95% CI=0.19, 2.78) and never drinkers (b=−1.32; 95% CI=−2.44, −0.20), respectively. Lower SAS-SV scores were observed in respondents who
Table 2. The Chinese Smartphone Addiction Scale–Short Version (reported in English) Based on your current situation, to what extent do you agree with the
following statements?a
Mean (SD) scoreb
Corrected item-total correlation
Cronbach’sα if item deletedc
1 Missing planned work due to smartphone use 2.4 (1.4) .43 .839
2 Having a hard time concentrating in class, while doing assignments, or while working due to smartphone use
2.7 (1.6) .44 .839
3 Feeling pain in the wrists or at the back of the neck while using a smartphone 3.0 (1.7) .41 .843
4 Won’t be able to stand not having a smartphone 3.5 (1.7) .54 .830
5 Feeling impatient and fretful when I am not holding my smartphone 2.6 (1.5) .64 .820
6 Having my smartphone in my mind even when I am not using it 2.6 (1.5) .65 .820
7 I will never give up using my smartphone even when my daily life is already greatly affected by it
3.4 (1.7) .55 .829
8 Constantly checking my smartphone so as not to miss conversations between other people on WhatsApp, Facebook, or WeChat
3.6 (1.5) .56 .828
9 Using my smartphone longer than I had intended 2.9 (1.5) .66 .819
10 The people around me tell me that I use my smartphone too much 2.1 (1.3) .57 .828 Note. SD: standard deviation.
aEach item scores on a scale of 1 (strongly disagree) to 6 (strongly agree).bWeighted by age, sex, and education attainment distribution of the Hong Kong general population.cOverall Cronbach’sα=.844.
performed≥5 days (vs. 0 day) of moderate physical exercise per week (b=−1.32; 95% CI=−2.44,−0.20). No associ- ation between chronic disease status and SAS-SV was observed (b=−0.50; 95% CI=−1.42, 0.43).
DISCUSSION
This is the first study to (a) evaluate the psychometric properties of the Chinese version of SAS-SV, (b) provide an estimate of PSU prevalence, and (c) examine the socio- demographic and health behavior associated with PSU in a large population-representative sample of adults including older people. The Chinese translation of SAS-SV showed good internal consistency (Cronbach’sα=.844), compara- ble to those observed in other languages (.79–.91) (De Pasquale et al., 2017;Haug et al., 2015;Hawi & Samaha, 2017; Lopez-Fernandez, 2017; Noyan et al., 2015;
Sfendla et al., 2018), with satisfactory test–retest reliability.
Results from item analyses suggested that all items were measuring the same construct of the scale and non-redundant.
CFA supported a unidimensional structure for the Chinese SAS-SV with adequate modelfitness, as suggested by previ- ous factor analyses in other languages (De Pasquale et al., 2017; Hawi & Samaha, 2017; Lopez-Fernandez, 2017;
Noyan et al., 2015;Sfendla et al., 2018). The SAS-SV score also followed a normal distribution (a desirable property for many statistical tests) with minimalfloor and ceiling effects.
Overall, thefindings of this study supported the Chinese SAS- SV as a useful tool to measure PSU in Hong Kong adults, which can be further adapted for use in other Chinese subpopulations.
The prevalence of PSU observed in our sample (38.5%) was high compared to those observed in western, conve- nience samples of adults from Spain (12.5%) and Belgium (21.5%) (Lopez-Fernandez, 2017), and students from Switzerland (16.9%) using the SAS-SV (Haug et al., 2015). This discrepancy may be explained in part by the Table 3. Associations of sociodemographic characteristics with SAS-SV score (n=3,211)
Mean (SD) b[95% CI]
SAS-SV scorea Crude association Adjusted associationb Sex
Male 27.9 (9.7) Ref. Ref.
Female 29.7 (10.4) 1.87 [1.17, 2.58]*** 1.67 [0.86, 2.48]***
Age (years)
18–24 29.9 (8.8) Ref. Ref.
25–34 30.5 (9.6) 0.69 [−0.60, 1.98] 0.07 [−1.92, 2.06]
35–44 29.4 (10.6) −0.50 [−1.78,−0.78] −2.61 [−4.72,−0.50]*
45–54 27.6 (10.1) −2.28 [−3.57,−0.99]** −4.50 [−6.68,−2.32]***
55–64 28.3 (10.4) −4.18 [−2.86,−0.16]** −4.18 [−6.51,−1.85]***
65+ 26.7 (10.5) −3.17 [−4.74,−1.59]*** −6.80 [−9.58,−4.01]***
pfor trend <.001 <.001
Marital status
Unmarried 28.8 (9.4) Ref. Ref.
Married/cohabitated 29.0 (10.5) 0.26 [−0.49, 1.02] 2.72 [1.60, 3.84]***
Divorced/separated 28.9 (11.1) 0.10 [−2.17, 2.37] 3.31 [0.79, 5.82]*
Widowed 27.6 (10.0) −1.12 [−3.18, 0.94] 1.57 [−0.86, 4.00]
Highest education level
Primary or below 29.2 (11.4) Ref. Ref.
Secondary 28.9 (10.2) −0.29 [−1.37, 0.80] −1.11 [−2.39, 0.17]
Tertiary or above 28.7 (9.5) −0.55 [−1.69, 0.59] −1.76 [−3.26,−0.26]*
pfor trend .320 .008
Employment status
Employed 29.0 (10.1) Ref. Ref.
Unemployed 28.0 (9.7) −1.00 [−2.65, 0.65] −1.23 [−2.99, 0.53]
Homemakers 28.8 (10.4) −0.18 [−1.14, 0.79] −1.35 [−2.51,−0.19]*
Full-time students 30.2 (8.4) 1.22 [−0.11, 2.55] 0.67 [−1.53, 2.86]
Retired 28.2 (11.0) −0.84 [−1.88, 0.20] 0.80 [−0.73, 2.33]
Monthly household income
≥$40,000 28.2 (9.8) Ref. Ref.
$30,000–$39,999 29.2 (10.1) 1.00 [−0.15, 2.15] 0.92 [−0.24, 2.08]
$20,000–$29,999 29.2 (10.3) 1.00 [0.01, 2.00]* 0.78 [−0.26, 1.82]
$10,000–$19,999 30.7 (10.5) 2.49 [1.42, 3.55]*** 2.32 [1.16, 3.47]***
<$9,999 27.2 (10.0) −1.00 [−2.32, 0.32] 0.09 [−1.39, 1.58]
pfor trend .110 .040
Note. SD: standard deviation; SAS-SV: Smartphone Addiction Scale–Short Version; CI: confidence interval.
aWeighted by age, sex, and education attainment distribution of the Hong Kong general population.bMutually adjusted for other variables in the table.
*p<.05. **p<.01. ***p<.001.
differences in sampling methods while it likely reflects the geographical disparity in ICTs development and penetration in Hong Kong. Specifically, Hong Kong is significantly more technologically advanced than other countries with affordable (0.18% of gross national income per capita) mobile-cellular services (International Telecommunication Union, 2016), promoting mobile phone use. Furthermore, as mobile phone use has been rapidly increasing in the past few years, our more recent data in 2017 would perhaps be expected to show higher prevalence of PSU. Cultural dif- ference may also contribute to the discrepancy, as suggested by a cross-cultural study, which found markedly higher rate of PSU in convenience samples of young adults in China (63%) than Germany (7.0%) (Lachmann et al., 2018). Note that the suggested SAS-SV cut-off scores used to identify subjects with PSU were established by receiver-operating characteristic analyses on Korean adolescents (Kwon, Kim, et al., 2013), which may be less applicable to adults. Further studies are needed to determine the optimal cut-offs for other age groups. Nevertheless, the high prevalence of PSU in Hong Kong underscores the need to examine its adverse health consequences at the population level.
Consistent with previous studies, we found that female had more dependent use of smartphone, which may relate to their greater sociability and feminine ideal of collaboration nurturing (Billieux, 2012; De-Sola Gutiérrez et al., 2016;
Lopez-Fernandez et al., 2017). We also observed older age strongly predict lower PSU, as younger respondents may have lower self-control ability and seem more reliant on using smartphone for daily life activities (Billieux, 2012;
De-Sola Gutiérrez et al., 2016). Previous research did not find clear relationship between SES and problematic use of mobile phone (Billieux, 2012). We found lower risk of PSU
in respondents with higher levels of education, possibly explained by their greater health literacy and thus lower risk of developing unhealthy behaviors (DeWalt & Pignone, 2005). The roles of other indicators of SES (employment status and household income) in PSU were less clear. Lower household income seemed to predict PSU, but the results were inconsistent, as we found SAS-SV score was not associated with the poorest category of household income.
This contrasted to the strong and consistent associations between higher SES and Internet health information seeking and smartphone health apps possession (the inverse ICT law: those most in need of healthcare have less access to health-related ICTs) observed in our earlier studies (Shen et al., 2017; Wang et al., 2013). It is possible that respondents in the lowest income group may avoid heavy use of smartphones to reduce the expense or cannot afford to buy expensive prepaid data packages for mobile Internet ser- vices. This contributes to the null association between low income and PSU. Of note, smartphones have many functions (e.g., social networking, Internet browsing, online shopping, and video gaming), all of which may have distinct relations to SES. Therefore, the relationship between SES and PSU may be unique with complex diversity depending on the use of specific smartphone functions and costs. Future studies may benefit from more detailed measurements of the pattern of smartphone usage including cost barriers and the type of smartphone functions most frequently used by owners.
We found intriguing associations between higher risk of PSU and both married/cohabitated and divorced/separated respondents when compared to the never-married. Being married/cohabitated is associated with more frequent use of telephone calls, instant messaging, and e-mail for family communication compared to those who are single Table 4. Associations of health behaviors and chronic disease status with SAS-SV score
n(%)a
b[95% CI]
Model 1b Model 2c
Cigarette smoking
Never smoker 2,572 (80.1) Ref. Ref.
Former smoker 328 (10.2) 0.22 [−1.05, 1.50] −0.64 [−1.38, 1.25]
Current smoker 311 (9.7) 1.81 [0.54–3.09]** 1.48 [0.19, 2.78]*
Alcohol drinking habit
Never drinking 1,386 (43.2) Ref. Ref.
Former drinking 128 (4.0) 0.91 [−1.02, 2.85] 1.14 [−0.86, 3.14]
Occasional drinking 1,111 (34.6) 1.34 [0.49, 2.19]** 1.24 [0.39, 2.10]**
Monthly drinking 266 (8.3) 1.14 [−0.26, 2.55] 1.03 [−0.38, 2.44]
Weekly or more drinking 320 (10.0) 1.91 [0.61, 3.21]** 1.50 [0.18, 2.83]*
Moderate physical exercise
None 1,908 (59.5) Ref. Ref.
1–4 days/week 870 (27.1) −0.36 [−1.22, 0.50] −0.45 [−1.32, 0.41]
5–7 days/week 431 (13.4) −1.32 [−2.44,−0.20]* −1.32 [−2.44,−0.20]*
pfor trend .024 .019
Chronic disease diagnosis
No 2,358 (73.4) Ref. Ref.
Yes 854 (26.6) −0.50 [−1.41, 0.42] −0.50 [−1.42, 0.43]
Note.No results reached a significance level ofp<.001. SAS-SV: Smartphone Addiction Scale–Short Version;SD: standard deviation; CI:
confidence interval.
aWeighted by age, sex, and education attainment distribution of the Hong Kong general population.bAdjusted for sex, age, marital status, highest education level, employment status, and monthly household income.cAdditionally adjusted for other variables in the table.
*p<.05. **p<.01.
(Wang et al., 2015), which may contribute to more dependent use of smartphones. On the contrary, problematic use of smartphone functions unrelated to family communication such as online video gaming and gambling may worsen family relationships and contribute to marital breakdown (Black, Shaw, McCormick, & Allen, 2012; Wang et al., 2014). Overuse of social networking sites (e.g., Facebook) may also contribute to family conflict due to reduced time spent with family or inattention during face-to-face conversa- tions (Sharaievska & Stodolska, 2017). Disrupted communi- cation pattern may also mediate the relationship between problematic use of media (including smartphone use, online gaming, and video watching) and marital dissatisfaction (Spencer, Lambertsen, Hubler, & Burr, 2017).
We found current smoking and weekly or more frequent alcohol drinking are associated with higher risk of PSU.
Similar findings in adolescent samples of Spanish and Chinese from Taiwan were reported (Sánchez-Martínez &
Otero, 2009;Yang, Yen, Ko, Cheng, & Yen, 2010). These correlations may be explained by a shared underlying psychosocial process that contributes to overuse and/or addictions. Established risk factors of PSU, including personality traits like neuroticism and lower conscientious- ness, mental health problems like anxiety and depression, and other attributes like low self-esteem and low self-control ability (Billieux et al., 2015;De-Sola Gutiérrez et al., 2016;
Hussain, Griffiths, & Sheffield, 2017;Park & Choi, 2017), may also contribute to substance use (Kotov, Gamez, Schmidt, & Watson, 2010). Future research that includes measures of these psychosocial factors would be helpful to understand the interrelationship among PSU, health beha- viors, and comorbidities. We also found an association between PSU and physical activity in our sample. More dependent use of smartphone may reduce the time spent on leisure time exercise, and this has significant potential negative health impacts. The coexistence of PSU with current smoking, frequent drinking, and physical inactivity also likely reflects higher health risks – all of which are amenable to effectual health promotion interventions.
This study had several limitations. First, longitudinal associations between PSU and health behavioral and other risk factors cannot be determined due to the cross-sectional design of the Survey. Second, we did not collect detailed information on the pattern of smartphone use among the users, which would have been helpful for interpreting the complex relationship between PSU and SES and other factors. Third, measures on health behaviors were self- reported. Although self-reported smoking and alcohol con- sumption are widely used and valid, the potential of under- reporting might reduce the strength of associations observed in this study (Del Boca & Darkes, 2003;Gorber, Schofield- Hurwitz, Hardt, Levasseur, & Tremblay, 2009). Future research may also be benefited from more comprehensive measures of these behaviors such as nicotine dependence and alcohol use disorder. Fourth, although we adjusted for several potential confounders, residual or unmeasured con- founders (e.g., personality traits) might explain the observed associations between PSU and health behaviors. Finally, the debatable conceptualization of PSU precludes a strong theoretical foundation on which to develop a universally accepted measure (Billieux et al., 2015; Panova &
Carbonell, 2018). This also applies to SAS-SV as a mea- suring tool for PSU. Nevertheless, the SAS-SV is among the most widely used and translated instruments assessing smartphone dependence, which can help unify approaches to collecting empirical data to understand and address this rapidly emerging public health issue.
CONCLUSIONS
The Chinese adaptation of SAS-SV was found valid and reliable in Chinese adults in Hong Kong. The high preva- lence of PSU in the Hong Kong adult population suggests that further research on its health consequence is required.
The identified sociodemographic factors and health beha- viors associated with PSU are important findings, which should be further investigated to help developing potential prevention programs for PSU.
Funding sources: This work was supported by the Hong Kong Jockey Club Charities Trust as part of the project:
“FAMILY: a Jockey Club Initiative for a Harmonious Society”(https://www.family.org.hk/en).
Authors’ contribution: MPW, CS, AW, SS-C, and THL conceived the study. TTL and PHC, a statistician, analyzed the data. TTL, MPW, PHC, JO, and THL interpreted the data. TTL wrote thefirst draft of the manuscript. All authors critically revised and approved the final version of the manuscript.
Conflict of interest: The authors declare no conflict of interest.
REFERENCES
Billieux, J. (2012). Problematic use of the mobile phone:
A literature review and a pathways model.Current Psychiatry Review, 8(4), 299–307. doi:10.2174/157340012803520522 Billieux, J., Maurage, P., Lopez-Fernandez, O., Kuss, D. J., &
Griffiths, M. D. (2015). Can disordered mobile phone use be considered a behavioral addiction? An update on current evidence and a comprehensive model for future research.Cur- rent Addiction Reports, 2(2), 156–162. doi:10.1007/s40429-015- 0054-y
Black, D. W., Shaw, M. C., McCormick, B. A., & Allen, J.
(2012). Marital status, childhood maltreatment, and family dysfunction: A controlled study of pathological gambling.
Journal of Clinical Psychiatry, 73(10), 1293–1297.
doi:10.4088/JCP.12m07800
Cazzulino, F., Burke, R. V., Muller, V., Arbogast, H., &
Upperman, J. S. (2014). Cell phones and young drivers: A systematic review regarding the association between psycho- logical factors and prevention.Traffic Injury Prevention, 15(3), 234–242. doi:10.1080/15389588.2013.822075
Census and Statistics Department. (2017). Thematic house- hold survey no. 62: Information technology usage and
penetration. Hong Kong Special Administrative Region.
Retrieved from http://www.statistics.gov.hk/pub/B1110006 2016AN16B0100.pdf
Cole, D. A., Ciesla, J. A., & Steiger, J. H. (2007). The insidious effects of failing to include design-driven correlated residuals in latent-variable covariance structure analysis.Psychological Methods, 12(4), 381–398. doi:10.1037/1082-989X.12.4.381 De Pasquale, C., Sciacca, F., & Hichy, Z. (2017). Italian validation
of Smartphone Addiction Scale Short Version for adolescents and young adults (SAS-SV).Psychology, 8(10), 1513–1518.
doi:10.4236/psych.2017.810100
De-Sola Gutiérrez, J., Rodríguez de Fonseca, F., & Rubio, G.
(2016). Cell-phone addiction: A review.Frontiers in Psychia- try, 7,175. doi:10.3389/fpsyt.2016.00175
Del Boca, F. K., & Darkes, J. (2003). The validity of self-reports of alcohol consumption: State of the science and challenges for research.Addiction, 98(s2), 1–12. doi:10.1046/j.1359-6357.2003.
00586.x
DeWalt, D. A., & Pignone, M. P. (2005). Reading is fundamental:
The relationship between literacy and health. Archives of Internal Medicine, 165(17), 1943–1944. doi:10.1001/archinte.
165.17.1943
Elhai, J. D., Dvorak, R. D., Levine, J. C., & Hall, B. J. (2017).
Problematic smartphone use: A conceptual overview and systematic review of relations with anxiety and depression psychopathology. Journal of Affective Disorders, 207, 251–259. doi:10.1016/j.jad.2016.08.030
Gorber, S. C., Schofield-Hurwitz, S., Hardt, J., Levasseur, G., &
Tremblay, M. (2009). The accuracy of self-reported smoking:
A systematic review of the relationship between self-reported and cotinine-assessed smoking status. Nicotine Tobacco Research, 11(1), 12–24. doi:10.1093/ntr/ntn010
Haug, S., Castro, R. P., Kwon, M., Filler, A., Kowatsch, T., &
Schaub, M. P. (2015). Smartphone use and smartphone addic- tion among young people in Switzerland.Journal of Behav- ioral Addictions, 4(4), 299–307. doi:10.1556/2006.4.2015.037 Hawi, N. S., & Samaha, M. (2017). Relationships among smart- phone addiction, anxiety, and family relations.Behaviour &
Information Technology, 36(10), 1046–1052. doi:10.1080/
0144929X.2017.1336254
Hu, L., & Bentler, P. (1995). Structural equation modeling:
Concepts, issues, and applications. In R. Hoyle (Ed.),Struc- tural equation modeling: Concepts, issues, and applications (pp. 76–99). Thousand Oaks, CA: Sage Publications.
Hussain, Z., Griffiths, M. D., & Sheffield, D. (2017). An investi- gation into problematic smartphone use: The role of narcis- sism, anxiety, and personality factors.Journal of Behavioral Addictions, 6(3), 378–386. doi:10.1556/2006.6.2017.052 International Telecommunication Union. (2016). Measuring the
information society report 2016. Geneva, Switzerland: Inter- national Telecommunication Union. Retrieved from https://
www.itu.int/en/ITU-D/Statistics/Documents/publications/
misr2016/MISR2016-w4.pdf
Izrael, D., Hoaglin, D. C., & Battaglia, M. P. (2004).To rake or not to rake is not the question anymore with the enhanced raking macro. Paper presented at the Proceedings of the 29th Annual SAS Users Group International Conference, Montreal, Canada.
Kardefelt-Winther, D., Heeren, A., Schimmenti, A., van Rooij, A., Maurage, P., Carras, M., Edman, J., Blaszczynski, A., Khazaal, Y.,
& Billieux, J. (2017). How can we conceptualize behavioural
addiction without pathologizing common behaviours?Addiction, 112(10), 1709–1715. doi:10.1111/add.13763
Kim, D., Lee, Y., Lee, J., Nam, J. K., & Chung, Y. (2014).
Development of Korean Smartphone Addiction Proneness Scale for Youth. PLoS One, 9(5), e97920. doi:10.1371/
journal.pone.0097920
Kim, H. Y. (2013). Statistical notes for clinical researchers:
Assessing normal distribution (2) using skewness and kurtosis.Restorative Dentistry & Endodontics, 38(1), 52–54.
doi:10.5395/rde.2013.38.1.52
Kim, H. J., Min, J. Y., Kim, H. J., & Min, K. B. (2017). Accident risk associated with smartphone addiction: A study on univer- sity students in Korea.Journal of Behavioral Addictions, 6(4), 699–707. doi:10.1556/2006.6.2017.070
Kotov, R., Gamez, W., Schmidt, F., & Watson, D. (2010). Linking
“big”personality traits to anxiety, depressive, and substance use disorders: A meta-analysis.Psychological Bulletin, 136(5), 768–821. doi:10.1037/a0020327
Kwon, M., Kim, D. J., Cho, H., & Yang, S. (2013). The Smartphone Addiction Scale: Development and validation of a short version for adolescents. PLoS One, 8(12), e83558.
doi:10.1371/journal.pone.0083558
Kwon, M., Lee, J. Y., Won, W. Y., Park, J. W., Min, J. A., Hahn, C., Gu, X., Choi, J.-H., & Kim, D. J. (2013). Develop- ment and validation of a Smartphone Addiction Scale (SAS).
PLoS One, 8(2), e56936. doi:10.1371/journal.pone.0056936 Kuss, D. J., Harkin, L., Kanjo, E., & Billieux, J. (2018). Problem-
atic smartphone use: Investigating contemporary experiences using a convergent design.International Journal of Environ- mental Research and Public Health, 15(1), 142. doi:10.3390/
ijerph15010142
Lachmann, B., Sindermann, C., Sariyska, R. Y., Luo, R., Melchers, M. C., Becker, B., Cooper, A. J., & Montag, C. (2018). The role of empathy and life satisfaction in Internet and smartphone use disorder. Frontiers in Psychology, 9,398. doi:10.3389/
fpsyg.2018.00398
Li, C. H. (2016). Confirmatory factor analysis with ordinal data:
Comparing robust maximum likelihood and diagonally weight- ed least squares.Behavior Research Methods, 48(3), 936–949.
doi:10.3758/s13428-015-0619-7
Lin, Y. H., Chang, L. R., Lee, Y. H., Tseng, H. W., Kuo, T. B., &
Chen, S. H. (2014). Development and validation of the Smart- phone Addiction Inventory (SPAI).PLoS One, 9(6), e98312.
doi:10.1371/journal.pone.0098312
Lopez-Fernandez, O. (2017). Short version of the Smartphone Addiction Scale adapted to Spanish and French: Towards a cross-cultural research in problematic mobile phone use.Ad- dictive Behaviors, 64, 275–280. doi:10.1016/j.addbeh.2015.
11.013
Lopez-Fernandez, O., Kuss, D. J., Romo, L., Morvan, Y., Kern, L., Graziani, P., Rousseau, A., Rumpf, H. J., Bischof, A., Gässler, A. K., Schimmenti, A., Passanisi, A., Männikkö, N., Kääriänen, M., Demetrovics, Z., Király, O., Ch´oliz, M., Zacarés, J. J., Serra, E., Griffiths, M. D., Pontes, H. M., Lelonek-Kuleta, B., Chwaszcz, J., Zullino, D., Rochat, L., Achab, S., & Schimmenti, A. (2017). Self-reported dependence on mobile phones in young adults: A European cross-cultural empirical survey. Journal of Behavioral Addictions, 6(2), 168–177. doi:10.1556/2006.6.2017.020
MacCallum, R. C., Browne, M. W., & Sugawara, H. M. (1996).
Power analysis and determination of sample size for covariance
structure modeling. Psychological Methods, 1(2), 130–149.
doi:10.1037/1082-989X.1.2.130
Noyan, C. O., Darçın, A. E., Nurmedov, S., Yılmaz, O., &
Dilbaz, N. (2015). Validity and reliability of the Turkish version of the Smartphone Addiction Scale-Short Version among uni- versity students.Anatolian Journal of Psychiatry, 16,73–81.
doi:10.5455/apd.176101
Panova, T., & Carbonell, X. (2018). Is smartphone addiction really an addiction?Journal of Behavioral Addictions, 7(2), 252–259. doi:10.1556/2006.7.2018.49
Park, H., & Choi, E. (2017). Smartphone addiction and depression:
The mediating effects of self-esteem and resilience among middle school students. Journal of Korean Academy of Community Health Nursing, 28(3), 280–290. doi:10.12799/
jkachn.2017.28.3.280
Roh, D., Bhang, S. Y., Choi, J. S., Kweon, Y. S., Lee, S. K., &
Potenza, M. N. (2018). The validation of Implicit Association Test measures for smartphone and Internet addiction in at-risk children and adolescents. Journal of Behavioral Addictions, 7(1), 79–87. doi:10.1556/2006.7.2018.02
Sánchez-Martínez, M., & Otero, A. (2009). Factors associated with cell phone use in adolescents in the community of Madrid (Spain). CyberPsychology & Behavior, 12(2), 131–137. doi:10.1089/cpb.2008.0164
Sfendla, A., Laita, M., Nejjar, B., Souirti, Z., Touhami, A. A. O., &
Senhaji, M. (2018). Reliability of the Arabic Smartphone Addiction Scale and Smartphone Addiction Scale-Short Version in two different Moroccan samples.Cyberpsychology, Behavior, and Social Networking, 21(5), 325–332. doi:10.1089/
cyber.2017.0411
Sharaievska, I., & Stodolska, M. (2017). Family satisfaction and social networking leisure. Leisure Studies, 36(2), 231–243.
doi:10.1080/02614367.2016.1141974
Shen, C., Wang, M. P., Chu, J. T., Wan, A., Viswanath, K., Chan, S. S. C., & Lam, T. H. (2017). Health app possession among smartphone or tablet owners in Hong Kong:
Population-based survey. JMIR mHealth and uHealth, 5(6), e77. doi:10.2196/mhealth.7628
Spencer, T. A., Lambertsen, A., Hubler, D. S., & Burr, B. K.
(2017). Assessing the mediating effect of relationship dynam- ics between perceptions of problematic media use and rela- tionship satisfaction. Contemporary Family Therapy, 39(2), 80–86. doi:10.1007/s10591-017-9407-0
Terwee, C. B., Bot, S. D., de Boer, M. R., van der Windt, D. A., Knol, D. L., Dekker, J., Bouter, L. M., & de Vet, H. C. (2007).
Quality criteria were proposed for measurement properties of health status questionnaires.Journal of Clinical Epidemiology, 60(1), 34–42. doi:10.1016/j.jclinepi.2006.03.012
Wang, C. W., Chan, C. L., Mak, K. K., Ho, S. Y., Wong, P. W., &
Ho, R. T. (2014). Prevalence and correlates of video and Internet gaming addiction among Hong Kong adolescents:
A pilot study. Scientific World Journal, 2014, 874648.
doi:10.1155/2014/874648
Wang, M. P., Chu, J. T., Viswanath, K., Wan, A., Lam, T. H., &
Chan, S. S. (2015). Using information and communication technologies for family communication and its association with family well-being in Hong Kong: FAMILY project.Journal of Medical Internet Research, 17(8), e207. doi:10.2196/jmir.4722 Wang, M. P., Viswanath, K., Lam, T. H., Wang, X., & Chan, S. S.
(2013). Social determinants of health information seeking among Chinese adults in Hong Kong. PLoS One, 8(8), e73049. doi:10.1371/journal.pone.0073049
Wang, P., Zhao, M., Wang, X., Xie, X., Wang, Y., & Lei, L.
(2017). Peer relationship and adolescent smartphone addiction:
The mediating role of self-esteem and the moderating role of the need to belong. Journal of Behavioral Addictions, 6(4), 708–717. doi:10.1556/2006.6.2017.079
Yang, Y. S., Yen, J. Y., Ko, C. H., Cheng, C. P., & Yen, C. F.
(2010). The association between problematic cellular phone use and risky behaviors and low self-esteem among Taiwanese adolescents. BMC Public Health, 10(1), 217. doi:10.1186/
1471-2458-10-217