Universitatis Szegediensis, Tomus 46, 2012, 33-49
ASSOCIATION OF SOCIODEMOGRAPHIC AND ENVIRONMENTAL FACTORS WITH ALLERGIC RHINITIS AND ASTHMA
BB BÁLÓ1, L MAKRA1, I MATYASOVSZKY2 and Z CSÉPE1
1Department of Climatology and Landscape Ecology, University of Szeged, P.O.Box 653, 6701 Szeged, Hungary E-mail: barnabas_balo@yahoo.com
2Department of Meteorology, Eötvös Loránd University, Pázmány Péter Street 1/A, 1117 Budapest, Hungary
Summary: Asthma and allergic rhinitis can play an important role in the quality of life, and its components are not clearly understood. The aim of the study is to analyse the role of socio-demographic and environmental factors in developing allergic asthma and rhinitis. The data set of the study is a questionnaire-based survey, with altogether 3666 interviewees. Altogether 26 socio-demographic and environmental variables are considered in the statistical analysis. Furthermore, seven resultant variables inducing allergic reactions were considered. They are as follows: dust, pollen, food, skin, pet, medicine and insect byte. For this, canonical correlation analysis (CCA) and a factor analysis with special transformation was performed in order to find out the strength and direction of the socio-demographic and environmental factors examined in forming certain allergic diseases.
Key words: asthma, allergic rhinitis, questionnaire-based survey, socio-demographic and environmental factors, canonical correlation analysis, factor analysis and special transformation
1. INTRODUCTION
Air pollution is a permanently increasing environmental hazard. During the last three decades there has been a persistent rise in both allergic diseases and allergic sensitisation (Batlles-Garrido et al. 2010). Furthermore, based on historical records, the prevalence of allergic rhinitis (AR) and allergic asthma have significantly increased over the past two centuries. Although the reasons for this increase are not fully clarified, epidemiologic data suggest that certain pollutants produced from the burning of fossil fuels may have played an important role in the changes of prevalence (Peterson and Saxon 1996).
This increase may be partly explained by changes in environmental factors. Urbanization, increasing automobile traffic, high levels of vehicle emissions, as well as the changing environment, lifestyle and living conditions are associated to the increasing frequency of allergic diseases (D'Amato et al. 2005, Batlles-Garrido et al. 2010).
Weather conditions can also influence both biological and chemical air pollutants.
There are evidences on the effect of air pollution upon allergens, increasing exposure to the latter, their concentration and/or biological allergenic activity (Bartra et al. 2007).
Furthermore, simultaneous exposure to more than one allergen might modify the effect of individual allergens (Custovic et al. 2003).
Allergies give rise to the fifth leading group of chronic diseases (Singh et al. 2010) and allergic rhinitis is considered to be the most frequent allergic disorder becoming a major public health problem in developed countries (Todo-Bom et al. 2007, Navarro et al.
2009). Allergic rhinitis represents a significant health problem because of the high variety of symptoms and its impact on general well-being and quality of life (QoL) among patients consulting for this condition (Canonica et al. 2008).
Air pollution in Hungary belongs to the highest in Europe concerning both ambient PM10 concentrations (Bozó et al. 2003) and pollen load (Makra et al. 2005). The concentration of Ambrosia pollen in Central Europe including Hungary is around one order of magnitude higher than in the remaining parts of the continent. In Southern Hungary, Ambrosia produces 44.1% of the total pollen production, indicating that ragweed is the most important aero-allergen taxon in Hungary (Juhász and Juhász 1997). In Szeged, 83.7%
of the patients were sensitive to Ambrosia in 1998-1999 (Kadocsa and Juhász 2000). About 30% of the Hungarian population has some type of allergy, 65% of them have pollen- sensitivity, and at least 60% of this pollen-sensitivity is caused by Ambrosia (Járai-Komlódi 1998). The number of patients with registered allergic illnesses has doubled and the number of cases of allergic asthma has become four times higher in Southern Hungary by the late 1990s over the last 40 years (Makra et al. 2005).
Economic losses due to the crop loss through the expanded vegetating of ragweed, expenses of protection, the number of days on sick-leave, expenses of medicines, medications and hospitalizations, other direct and indirect effects (drop-out of labour from production, losses from tourism and natural protection, seed-corn contaminated by ragweed seeds) produce further losses. Total annual losses due to ragweed and ragweed pollen in Hungary can reach 400-800 million € (Mányoki et al. 2011).
Allergic rhinitis (AR) is a common inflammatory condition of the nasal mucosa, characterised by nasal pruritus, sneezing, rhinorrhoea, and nasal congestion. AR is mediated by an IgE-associated response to ubiquitous indoor and/or outdoor environmental allergens (Dullaers et al. 2012).
Asthma is defined as a chronic inflammatory disorder, where the chronic inflammation is associated with airway hyper-responsiveness that leads to recurrent episodes of wheezing, breathlessness, chest tightness and coughing particularly at night or in the early morning (Global Strategy for Asthma Management and Prevention 2010).
Asthma is caused by environmental and genetic factors (Martinez 2007), which influence the severity of asthma. The interaction of these factors is complex and not fully understood (Miller and Ho 2008).
Many patients with asthma, particularly those with allergic asthma, also have AR.
The mucosa of the upper and lower airways is continuous, and the type of inflammation in AR and asthma is very similar, involving T helper type 2 cells, mast cells, and eosinophils (Jeffery and Haahtela 2006). Both diseases have characteristic symptoms and are strongly influenced by environmental factors.
A number of characteristics were identified that can lead to an increased risk of pollutant-related respiratory diseases, including sex, age (i.e., children, adults and the elderly), pre-existing respiratory diseases and low socio-economic status (Sacks et al.
2011).
Differences can be observed in the prevalence of allergy and asthma for urban/rural scale, as well as for developed/developing country comparisons. In West Germany, the prevalence of sensitizations was slightly higher in urban than in rural areas (Krämer et al.
1999), furthermore, at the time of the German reunification in 1990, most allergic diseases were less prevalent in East than in West Germany (Krämer et al. 2010). Parallel to this, El- Sharif et al. (2003) detected lower rates for asthma and asthma symptoms on Palestinian
school children aged 6-12 years compared to those in economically developed and industrialized countries. Recent studies of children suggest that factors encountered in a farm environment might protect against the development of allergy. Farmers' children are less frequently sensitized to “common” allergens (grass pollen, dog, cat, birch, mugwort) than the non-farmers' children (Remes et al. 2005, Norback et al. 2007). Farm environment reduces the occurrence of asthma, allergic diseases, and atopic sensitization in children, and also the occurrence of allergen-induced rhinitis (Leynaert et al. 2001, Remes et al. 2005, Waser et al. 2005). Furthermore, Koskela et al. (2003) suggests that animal husbandry may also decrease the risk of pet- and pollen-induced upper airway symptoms among female adults. A hypothesis of potential protective effects of exposure to pets during early childhood on the development of atopic disorders in children later in life is supported (Anyo et al. 2002, Holscher et al. 2002, Custovic et al. 2003). Among the single allergens, sensitization against pets or pollen, or against horse or cow, had the strongest association with asthma and hay fever (Remes et al. 2005).
Asthma and allergic rhinitis can play an important role in the quality of life, and its components are not clearly understood. Namely, the influence of socio-demographic and environmental factors on QoL in patients with AR has been so far little investigated (Laforest et al. 2005). The aim of the study is to analyse the role of socio-demographic and environmental factors in developing allergic asthma and rhinitis. For this, canonical correlation analysis (CCA) and a factor analysis with special transformation was performed in order to find out the strength and direction of the socio-demographic and environmental factors examined in forming certain allergic diseases.
2. MATERIALS AND METHODS
2.1. Materials
The data set of the study is a questionnaire-based survey, containing the data of altogether 3666 subjects. The questionnaire comprises 42 questions that can be classified in 11 topics, as follows: (1) individual parameters (gender, birth data and profession); (2) education; (3) diseases of the parents and siblings; (4) own diseases and diseases of own children; (5) breastfeeding; (6) own non-allergic diseases; (7) own allergic diseases; (8) alcohol; (9) smoking; (10) living conditions and (11) home interior. Furthermore additional information was also considered (symptoms denoting allergy, diagnosed allergy, and regular medication).
Altogether 26 socio-demographic and environmental variables are considered in the statistical analysis. Their possible role in developing asthma and allergic rhinitis are examined. These variables are as follows: breastfeeding (yes/no), high blood pressure, vascular diseases, heart disease, lung diseases, diabetes, obesity, cancer, alcohol (yes/no), smoking (yes/no), urban apartment living, live in apartment housing, family house living, concrete wall of the housing, brick wall of the housing, adobe walls of the housing, state of the housing walls (dry, wet), parquet flooring in the house, the flat floor carpet, the flat floor stone, the bedding material (feather, non-feather), dog, cat, chicken, pig and cattle.
Furthermore, seven resultant variables inducing allergic reactions were considered. They are as follows: dust, pollen, food, skin, pet, medicine and insect byte.
The mean age of those who were interviewed was 30.8 years, the youngest person was 16, while the oldest 107. The sample examined was not random, since most of the interviewed people were students. Out of those 3666 people who were interviewed, 1598 people were male and 2060 female. 1860 people didn’t have any kind of allergy, while 1798 people were sensitive to at least one allergen. The highest education level was nothing in the case of 10 people, primary school for 146 individuals secondary school for 1630, higher educational institution and university or part of it in the case of 689 and 1183 people, respectively. Out of all the interviewed individuals 1780 people were young (15 yr
< age ≤ 24 yr) (787 males and 993 females), 1410 people wee adults (619 males and 791 females), furthermore 283 people were elderly (101 males and 182 females).
Data preparation, part of the calculations and graphic editing was performed with EXCEL 2007 software. At the same time, factor analysis was carried out with SPSS 16.0 software.
2.2. Methods
2.2.1. Pearson's chi-squared test
Pearson's chi-squared test (χ2) examines a null hypothesis stating that the frequency distribution of certain events observed in a sample is consistent with a particular theoretical distribution. The events considered must be mutually exclusive and have total probability 1.
Pearson's chi-squared goodness of fit test establishes whether or not an observed frequency distribution differs from a theoretical distribution (Bolla and Krámli 2005).
2.2.2. Canonical correlation analysis (CCA)
If we have a set of explaining variables X = (x1,…,xp)T and a set of target variables Y = (y1,…,yq)T, and there are correlations among the variables, then canonical correlation analysis will enable us to find linear combinations of the components of X and Y which have maximum correlation with each other.
Canonical correlation analysis (CCA) seeks vectors a and b so that the random variables aT X and bT X maximize the canonical correlation ρ = corr[aT X, bTY]. The random variables u = aT X and v = bT Y represent the first pair of canonical variables.
Then one seeks vectors maximizing the same correlation subject to the constraint that they are to be uncorrelated with the first pair of canonical variables; this gives the second pair of canonical variables. This procedure may be continued up to m = min {p,q} times.
Each canonical correlation can be tested for significance the following way. Saying that the ith canonical correlation is zero implies all further correlations are also zero. If we have n independent observations in a sample and ρi is the estimated canonical correlation, the test statistic is:
( ) ∏
=
ρ
− +
+
−
−
−
= χ
m
i j
2j
2 n 1 (p q 1)/2 ln (1 ) (1)
which is asymptotically distributed as a chi-squared with (p – i + 1)(q – i + 1) degrees of freedom for large n.
The visualization of the results of the canonical correlation ρi is usually through tables for the coefficients aiT = (ai1,…,aip) and biT = (bi1,…,biq) of the two sets of variables for the pairs of canonical variables showing significant correlations between the original and canonical variables. In order to ensure an easier interpretation the canonical correlation analysis is performed with standardized explaining and target variables. The standardization of a random variable means a simple transformation resulting in a variable with zero expectation and unit variance.
Supposing that q < p (which is a typical case) and supposing that every canonical correlation is significant, then the estimate Y of Y is
X ) RA B (
Y= −1 (2)
where the ith row of A and B is aiT and biT respectively, and R is a diagonal matrix with ρi in its ith diagonal element (Johnson and Wichern 2007).
2.2.3. Factor analysis and special transformation
Factor analysis (FA) identifies linear relationships among subsets of examined variables, which helps to reduce the dimensionality of the initial database without any substantial loss of information. First, a factor analysis was applied to the initial dataset consisting of 26 explanatory variables in order to transform the original variables to fewer variables. These new variables called factors can be viewed as the main socio- demographic/environmental functions that potentially influence allergic sensitivity. The optimum number of retained factors is determined by the criterion of reaching a prespecified percentage of the total variance (Jolliffe 1993). This percentage value was set at 80% in our case. After performing a factor analysis, a special transformation of the retained factors was performed to discover to what degree the above-mentioned 26 explanatory variables affect the 7 resultant variables (7 type of allergy), and to give a rank of importance of their influence (Fischer and Roppert 1965, Jahn and Vahle 1968, Jolliffe 1993).
Thresholds of significance are obtained according to the following consideration.
Introducing the null-hypothesis that a given factor loading (weight) is zero, i.e. this factor is not present in forming the resultant variable, the statistics
2 2
r 1
) 2 n ( t r
−
= − (3)
follows a Student t-distribution with n – 2 degrees of freedom, where r is the value of the given factor loading and n is the number of data.
3. RESULTS 3.1. Pearson’s χ2-test
It was analysed whether the pairwise frequencies of non-sensitive individuals and those who are sensitive at least to one allergen differ significantly on the basis of the 26 explanatory variables. We found that those suffering from lung disease are substantially
more sensitive to at least one allergen (99% probability level), while for those living in family house and breeding chicken or pig, the number of sensitive individuals is remarkably smaller (95% and 99% probability levels) (Table 1).
Table 1 Frequency of non-sensitive individuals and those being sensitive at least to one allergen according to the explanatory variables Explanatory variables Non-sensitive
individuals
Those being sensitive
To at least one allergen Total
Breastfeeding (yes/no) 1704 1625 3329
High blood pressure 300 307 607
Vascular diseases 108 111 219
Heart disease 92 119 211
Lung disease 38 134 172
Diabetes 50 59 109
Obesity 268 282 550
Cancer 21 23 44
Alcohol (yes/no) 0.45 0.44 0.89
Smoking (yes/no) 0.42 0.46 0.88
Urban apartment living 1003 1070 2073
Live in apartment housing 436 487 923
Family house living 1151 1035 2186
Concrete wall of the housing 418 449 867
Brick wall of the housing 1297 1218 2515
Adobe walls of the housing 289 242 531
State of the housing walls
(dry, wet) 1.08 1.11 2.19
Parquet flooring in the house 1286 1192 2478
The flat floor carpet 589 593 1182
The flat floor stone 469 418 887
The bedding material
(feather, non-feather) 1.54 1.69 3.23
dog 962 891 1853
cat 660 646 1306
chicken 294 220 514
pig 149 106 255
cattle 24 37 61
Bold: significant at the 99% significance level; Italic: significant at the 95% significance level
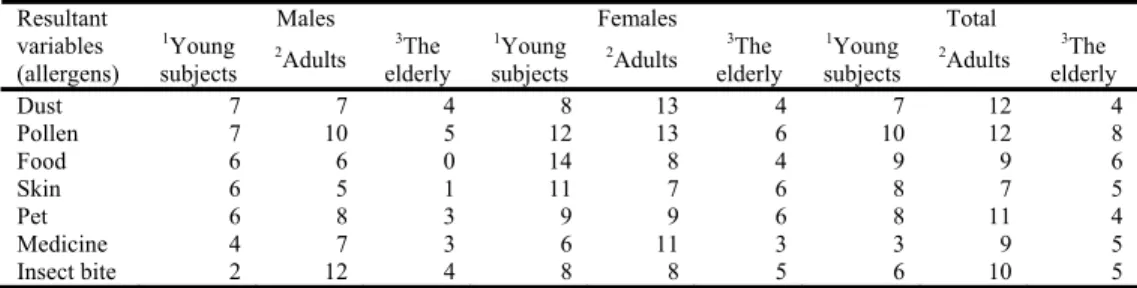
The frequencies of those being sensitive to at least one allergen were determined for all 7 allergens. Thereafter, these frequencies were summarised for young individuals, adults and the elderly, according to sex. Then we analysed whether the pairwise frequencies for all three age categories and sex differed significantly. We received that for young individuals (15 yr < age ≤ 24 yr) the ratio of females suffering from any kind of allergy is remarkably higher compared to males (99% probability level); for adults (25 yr < age ≤ 54 yr) the ratio of sensitive individuals is also higher for females, but there is no significant difference (75% probability level); furthermore, for the elderly (age > 54 yr) females are also more sensitive to any allergen compared to males indicating a weakly significant association (90% probability level) (Table 2).
Table 2 Frequency of those being sensitive to at least one allergen for the individual categories
Males Females Total
Resultant variables (allergens)
1Young
subjects 2Adults 3The elderly
1Young
subjects 2Adults 3The elderly
1Young
subjects 2Adults 3The elderly
Dust 7 7 4 8 13 4 7 12 4
Pollen 7 10 5 12 13 6 10 12 8
Food 6 6 0 14 8 4 9 9 6
Skin 6 5 1 11 7 6 8 7 5
Pet 6 8 3 9 9 6 8 11 4
Medicine 4 7 3 6 11 3 3 9 5
Insect bite 2 12 4 8 8 5 6 10 5
1: 15 yr < age ≤ 24 yr; 2: 25 yr < age ≤ 54 yr; 3: age > 54 yr
3.2. Canonical correlation analysis (CCA)
3.2.1. All sensitive individuals
When applying canonical correlation analysis, the period of breastfeeding was dropped out. Namely, due to preliminary examinations this variable does not explain anything about allergic diseases.
Three canonical variable pairs were found significant at 95% probability level.
These are worth further consideration.
The importance and direction (sign) of the individual variables in forming the canonical variables can be measured by the coefficient of the actual variable. Further important information is the correlation between the original variables and the canonical variables belonging to them. These two characteristics definitely don’t behave similarly, so they should be considered simultaneously. The most relevant results of these two variable pairs are as follows.
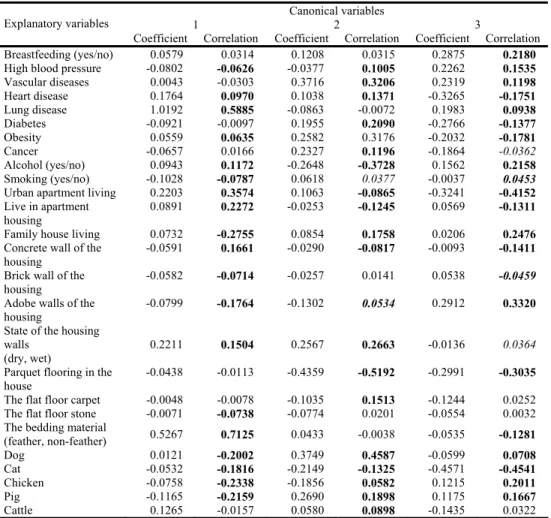
First canonical variable pair: The most remarkable explaining variables are the bedding material and lung disease in decreasing order of importance. Urban environment (urban apartment living) and partly the state of the housing walls are also important (Table 3). The coefficients are positive (Table 3) and since the coefficients of the first canonical variable of the resultant variables are also positive (Table 4), these explaining variables induce allergic symptoms, namely pollen-, dust- and pet allergy, in decreasing order of importance (Tables 3-4).
Second canonical variable pair: In the canonical variables of the resultant variables insect byte and pollen allergy are dominant, with different signs. Hence, there is a tendency that someone has one kind of allergy but misses the other (Table 4). The most relevant explaining variables are parquet flooring in the house (based on signs, pollen allergy tends to occur in apartments with parquet flooring), dog and vascular disease (they have an inverse and a proportional relationship with pollen-, and insect byte allergies, respectively), as well as alcohol (being in a proportional and an inverse association with pollen- and insect byte allergy, respectively) (Tables 3-4).
Table 3 Coefficients of explaining variables in the canonical variables and correlations between explaining variables and canonical variables (bold, bold italic and italic refer to correlations different
from zero at 99.9, 99 and 95% significance levels) Canonical variables
1 2 3 Explanatory variables
Coefficient Correlation Coefficient Correlation Coefficient Correlation Breastfeeding (yes/no) 0.0579 0.0314 0.1208 0.0315 0.2875 0.2180 High blood pressure -0.0802 -0.0626 -0.0377 0.1005 0.2262 0.1535 Vascular diseases 0.0043 -0.0303 0.3716 0.3206 0.2319 0.1198 Heart disease 0.1764 0.0970 0.1038 0.1371 -0.3265 -0.1751 Lung disease 1.0192 0.5885 -0.0863 -0.0072 0.1983 0.0938 Diabetes -0.0921 -0.0097 0.1955 0.2090 -0.2766 -0.1377
Obesity 0.0559 0.0635 0.2582 0.3176 -0.2032 -0.1781
Cancer -0.0657 0.0166 0.2327 0.1196 -0.1864 -0.0362
Alcohol (yes/no) 0.0943 0.1172 -0.2648 -0.3728 0.1562 0.2158 Smoking (yes/no) -0.1028 -0.0787 0.0618 0.0377 -0.0037 0.0453 Urban apartment living 0.2203 0.3574 0.1063 -0.0865 -0.3241 -0.4152 Live in apartment
housing
0.0891 0.2272 -0.0253 -0.1245 0.0569 -0.1311 Family house living 0.0732 -0.2755 0.0854 0.1758 0.0206 0.2476 Concrete wall of the
housing
-0.0591 0.1661 -0.0290 -0.0817 -0.0093 -0.1411 Brick wall of the
housing
-0.0582 -0.0714 -0.0257 0.0141 0.0538 -0.0459 Adobe walls of the
housing
-0.0799 -0.1764 -0.1302 0.0534 0.2912 0.3320 State of the housing
walls (dry, wet)
0.2211 0.1504 0.2567 0.2663 -0.0136 0.0364 Parquet flooring in the
house
-0.0438 -0.0113 -0.4359 -0.5192 -0.2991 -0.3035 The flat floor carpet -0.0048 -0.0078 -0.1035 0.1513 -0.1244 0.0252 The flat floor stone -0.0071 -0.0738 -0.0774 0.0201 -0.0554 0.0032 The bedding material
(feather, non-feather) 0.5267 0.7125 0.0433 -0.0038 -0.0535 -0.1281
Dog 0.0121 -0.2002 0.3749 0.4587 -0.0599 0.0708
Cat -0.0532 -0.1816 -0.2149 -0.1325 -0.4571 -0.4541
Chicken -0.0758 -0.2338 -0.1856 0.0582 0.1215 0.2011
Pig -0.1165 -0.2159 0.2690 0.1898 0.1175 0.1667
Cattle 0.1265 -0.0157 0.0580 0.0898 -0.1435 0.0322
Table 4 Coefficients of target variables in the canonical variables and correlations between target variables and canonical variables (bold, bold italic and italic refer to correlations different
from zero at 99.9, 99 and 95% significance levels) Canonical variables
1 2 3 Resultant
variables
Coefficient Correlation Coefficient Correlation Coefficient Correlation Dust 0.4613 0.7526 -0.1547 -0.2849 0.2615 0.1698 Pollen 0.5405 0.7551 -0.4772 -0.5480 -0.4037 -0.4038 Food -0.0091 0.1568 -0.1405 -0.0361 -0.6187 -0.5759 Skin 0.0822 0.1786 0.2540 0.2639 -0.4248 -0.4930
Pet 0.6324 0.6677 0.2940 0.1016 0.3576 0.2169
Medicine 0.2936 0.2560 0.3479 0.3773 0.1901 0.1038 Insect bite 0.0459 0.1500 0.6757 0.6192 -0.2034 -0.2630
Third canonical variable pair: The most remarkable resultant variables are food-, skin- and pollen allergy in decreasing order of importance and with the same sign. These kind of allergies are facilitated by cat, urban apartment living and parquet flooring in the house in decreasing order of importance, while adobe walls are of opposite effect (Tables 3- 4).
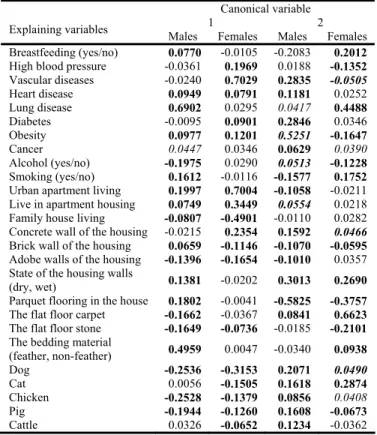
3.2.2. Sensitive males
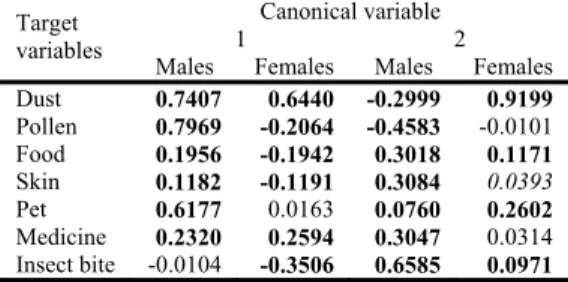
First canonical variable pair: The most important explanatory variables are lung disease and bedding material. Urban environment (urban apartment living) and partly the state of the housing walls are also relevant (Table 5). The coefficients are positive (Table 5) and since the coefficients of the first canonical variable of the resultant variables are also positive (Table 6), accordingly allergic symptoms (mainly pollen-, dust- and pet allergies) are induced by these variables (Tables 5-6).
Table 5 Correlations between explaining variables and canonical variables (bold, bold italic and italic refer to correlations different from zero at 99.9, 99 and 95% significance levels)
Canonical variable
Explaining variables Males Females Males Females 1 2 Breastfeeding (yes/no) 0.0770 -0.0105 -0.2083 0.2012 High blood pressure -0.0361 0.1969 0.0188 -0.1352 Vascular diseases -0.0240 0.7029 0.2835 -0.0505 Heart disease 0.0949 0.0791 0.1181 0.0252 Lung disease 0.6902 0.0295 0.0417 0.4488 Diabetes -0.0095 0.0901 0.2846 0.0346
Obesity 0.0977 0.1201 0.5251 -0.1647
Cancer 0.0447 0.0346 0.0629 0.0390
Alcohol (yes/no) -0.1975 0.0290 0.0513 -0.1228 Smoking (yes/no) 0.1612 -0.0116 -0.1577 0.1752 Urban apartment living 0.1997 0.7004 -0.1058 -0.0211 Live in apartment housing 0.0749 0.3449 0.0554 0.0218 Family house living -0.0807 -0.4901 -0.0110 0.0282 Concrete wall of the housing -0.0215 0.2354 0.1592 0.0466 Brick wall of the housing 0.0659 -0.1146 -0.1070 -0.0595 Adobe walls of the housing -0.1396 -0.1654 -0.1010 0.0357 State of the housing walls
(dry, wet) 0.1381 -0.0202 0.3013 0.2690
Parquet flooring in the house 0.1802 -0.0041 -0.5825 -0.3757 The flat floor carpet -0.1662 -0.0367 0.0841 0.6623 The flat floor stone -0.1649 -0.0736 -0.0185 -0.2101 The bedding material
(feather, non-feather) 0.4959 0.0047 -0.0340 0.0938
Dog -0.2536 -0.3153 0.2071 0.0490
Cat 0.0056 -0.1505 0.1618 0.2874
Chicken -0.2528 -0.1379 0.0856 0.0408
Pig -0.1944 -0.1260 0.1608 -0.0673
Cattle 0.0326 -0.0652 0.1234 -0.0362
Second canonical variable pair: In the canonical variable of the resultant variables insect byte - and pollen allergy are prevailing in decreasing order of importance with different signs (Table 6). Hence, there is a tendency that someone has one kind of allergy but misses the other. The most important explanatory variables are parquet (based on the
signs, pollen allergy tends to occur with parquet flooring in the house) and obesity (being in an inverse and a proportional relationship with pollen- and insect byte allergies, respectively) (Tables 5-6).
Table 6 Correlations between target variables and canonical variables (bold, bold italic and italic refer to correlations different from zero at 99.9, 99 and 95% significance levels)
Canonical variable
Target 1 2
variables
Males Females Males Females Dust 0.7407 0.6440 -0.2999 0.9199 Pollen 0.7969 -0.2064 -0.4583 -0.0101 Food 0.1956 -0.1942 0.3018 0.1171 Skin 0.1182 -0.1191 0.3084 0.0393 Pet 0.6177 0.0163 0.0760 0.2602 Medicine 0.2320 0.2594 0.3047 0.0314 Insect bite -0.0104 -0.3506 0.6585 0.0971
3.2.3. Sensitive females
First canonical variable pair: The most relevant explanatory variables are vascular disease, urban apartment living and (with a smaller weight and opposite sign) family house living, in decreasing order of importance (Table 5). Based on this, vascular disease and urban apartment living are the main reasons of dust allergy symptoms, while family house living may facilitate insect byte allergy (Table 6).
Second canonical variable pair: In the canonical variable of the resultant variables practically the role of dust allergy is the most relevant (Table 6). The most remarkable explanatory variables are floor carpet and lung disease (Table 5). They both may provoke dust allergy. The role of parquet flooring is smaller with an opposite sign. Namely, this variable hinders developing dust allergy (Tables 5-6).
3.3. Factor analysis and special transformation
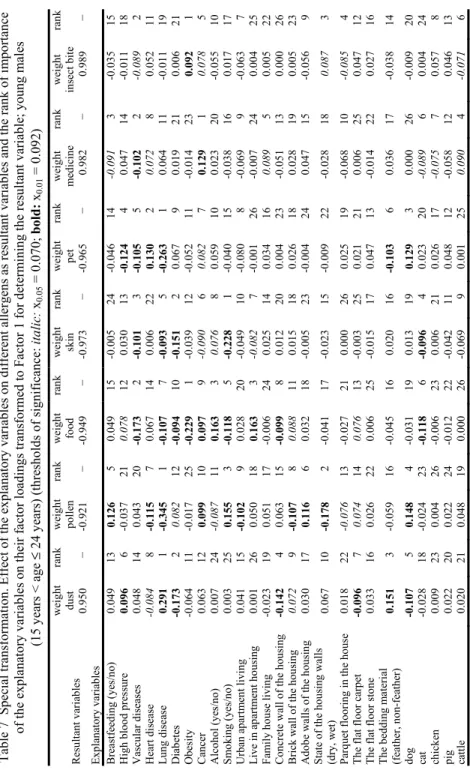
In order to determine the influence of the 26 explanatory variables considered on the 7 allergens (resultant variables), furthermore to calculate their weight in developing allergic diseases, factor analysis and then special transformation were performed for the age groups of younger individuals, adults and the elderly, furthermore for all sensitive individuals (males and females, total). Altogether 4 (3 age groups + total) x 3 (genders + total) x 7 (resultant variables) = 84 factor analyses and then 84 special transformations were performed.
Not all the results received from the 84 procedures according to the individual categories will be presented here. Instead, the effect of the 26 explanatory variables are only analysed for the age category of young males on all 7 resultant variables (allergens) (7 factor analyses and special transformations (Table 7). The development of dust allergy is substantially influenced by 9 explanatory variables. They are in decreasing order of importance: lung disease (with the same sign, +), diabetes (with opposite sign, −), the bedding material (feather, non-feather) (+), concrete wall of the housing (−), dog (−), high blood pressure (+), the flat floor carpet (−), heart disease (−) and brick wall of the housing (+). Explanatory variables with positive sign facilitate developing dust allergy, while those
Table 7 Special transformation. Effect of the explanatory variables on different allergens as resultant variables and the rank of importance of the explanatory variables on their factor loadings transformed to Factor 1 for determining the resultant variable; young males (15 years < age ≤ 24 years) (thresholds of significance:italic: x0.05 = 0.070; bold: x0.01 = 0.092) weight rankweight rank weight rankweight rank weight rankweight rankweight rank dustpollen food skinpet medicineinsect bite Resultant variables 0.950 − -0.921 − -0.949− -0.973 − -0.965− 0.982 − 0.989 − Explanatory variables Breastfeeding (yes/no) 0.049 13 0.126 5 0.049 15-0.005 24 -0.04614-0.091 3 -0.03515 High blood pressure0.096 6 -0.037 21 0.078 12 0.030 13 -0.1244 0.047 14-0.011 18 Vascular diseases0.048 14 0.043 20 -0.1732 -0.101 3 -0.1055 -0.102 2 -0.089 2 Heart disease -0.0848 -0.115 7 0.067 140.006 22 0.130 2 0.072 8 0.052 11 Lung disease 0.291 1 -0.345 1 -0.1077 -0.093 5 -0.2631 0.064 11-0.011 19 Diabetes -0.1732 0.082 12 -0.09410-0.151 2 0.067 9 0.019 210.006 21 Obesity -0.06411 -0.017 25 -0.2291 -0.039 12 -0.052 11 -0.014 230.092 1 Cancer 0.063 12 0.099 10 0.097 9 -0.090 6 0.082 7 0.129 1 0.078 5 Alcohol (yes/no) 0.007 24 -0.087 11 0.163 3 0.076 8 0.059 10 0.023 20-0.055 10 Smoking (yes/no)0.003 25 0.155 3 -0.1185 -0.228 1 -0.040 15 -0.038 160.017 17 Urban apartment living 0.041 15 -0.102 9 0.028 20-0.049 10 -0.0808 -0.069 9 -0.063 7 Live in apartment housing 0.001 26 0.050 18 0.163 3 -0.082 7 -0.001 26 -0.007 240.004 25 Family house living-0.023 19 0.051 17 -0.006 240.025 14 0.034 160.089 5 0.005 22 Concrete wall of the housing-0.1424 0.063 15 -0.0998 0.012 20 0.004 23 -0.051 130.000 26 Brick wall of the housing 0.072 9 -0.107 8 0.088 110.015 18 0.026 18 0.028 190.005 23 Adobe walls of the housing 0.030 17 0.116 6 0.032 18-0.005 23 -0.004240.047 15-0.056 9 State of the housing walls (dry, wet) 0.067 10 -0.178 2 -0.041 17-0.023 15 -0.00922-0.028 180.087 3 Parquet flooring in the house0.018 22 -0.076 13 -0.027 210.000 26 0.025 19-0.068 10-0.085 4 The flat floor carpet-0.0967 0.074 14 0.076 13-0.003 25 0.021 21 0.006 250.047 12 The flat floor stone0.033 16 0.026 22 0.006 25-0.015 17 0.047 13-0.014 220.027 16 The bedding material (feather, non-feather)0.151 3 -0.059 16 -0.045160.020 16 -0.1036 0.036 17-0.038 14 dog -0.1075 0.148 4 -0.031 190.013 19 0.129 3 0.000 26-0.009 20 cat -0.02818 -0.024 23 -0.1186 -0.096 4 0.023 20-0.089 6 0.004 24 chicken 0.009 23 0.004 26 -0.006 230.006 21 0.026 17-0.075 7 0.057 8 pig 0.022 20 0.022 24 -0.012 22-0.042 11 0.048 12-0.058 120.046 13 cattle 0.020 21 0.048 19 0.000 26-0.069 9 0.001 250.090 4 -0.071 6
with negative sign have an opposite effect. The development of pollen allergy is substantially influenced by 14 explanatory variables. They are (here and in all further specifications) in decreasing order of importance and with their sign, as follows: lung disease (+), the state of the housing walls (+), smoking (−), dog (−), breastfeeding (−), adobe walls of the housing (−), heart disease (+), brick wall of the housing (+), urban apartment living (+), cancer (−), alcohol (+), diabetes (−), parquet floor in the house (+), as well as the flat floor carpet (−). Food allergy is significantly influenced by 13 explanatory variables, namely: obesity (+), vascular disease (+), alcohol (−), live in apartment housing (−), smoking (+), cat (+), lung disease (+), concrete wall of the housing (+), cancer (−), diabetes (+), brick wall of the housing (−), high blood pressure (−), the flat floor carpet (−).
Skin allergy is a function of only 8 explanatory variables, namely: smoking (+), diabetes (+), vascular disease (+), cat (+), lung disease (+), cancer (+), live in apartment housing (+) and alcohol (−). Pet allergy can be substantially explained by 7 explanatory variables. They are as follows: lung disease (+), heart disease (−), dog (−), high blood pressure (+), vascular disease (+), the bedding material (feather, non-feather) (+) and cancer (−). Medicine allergy is significantly influenced by 8 explanatory variables, namely: obesity (+), vascular disease (−), breastfeeding (−), cattle (+), family house living (+), cat (−), chicken (−) and heart disease +). Insect byte allergy is a function of 6 explanatory allergies. They are as follows:
obesity (+), vascular disease (−), the state of the housing walls (dry, wet) (+), parquet flooring in the house (−), cancer (+) and cattle (−) (Table 7).
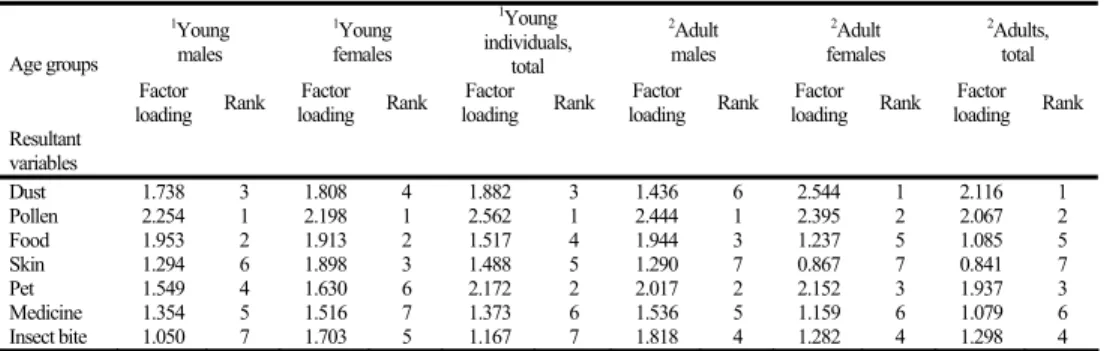
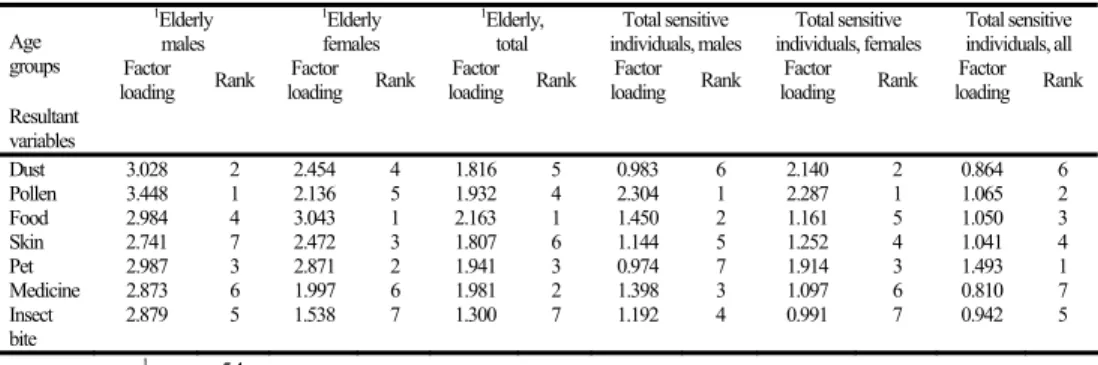
At the same time, the total factor loadings and their rank of importance for the explanatory and the resultant variables describe much more precisely the effect of environmental factors on allergic diseases (Tables 8a-b). Note that in this case the absolute values of the factor loadings are summarized; namely, their absolute effect (involving both their positive and negative effects) on the resultant variable is considered. Summing up factor loadings of each explanatory variable for the individual age categories according to the 7 resultant variables, will result in how they influence the developing of the different allergic diseases (Tables 8a-b). Based on this, the joint effect of the 26 explanatory variables for the three age groups of young individuals as well as for adult males influence mostly developing pollen allergy; while, for the remaining age groups of adults it operates principally in evolving dust allergy (Table 8a). The joint effect of all explanatory variables for elderly males provokes pollen allergy, for elderly females and all elderly food allergy, for all sensitive males and females pollen allergy, while for the total sensitive individuals all cases pet allergy (Table 8b).
4. DISCUSSION AND CONCLUSIONS
Several studies have analysed socio-demographic, environmental and genetic conditions of asthma and allergic rhinitis (e.g. du Prel et al., 2006, Mattei et al., 2007, Stallberg et al. 2007, Navarro et al. 2009, Batlles-Garrido et al. 2010).
Allergic diseases may have several socio-demographic, environmental and genetic components. Health effects of social inequalities can be demonstrated globally and it is an important public health problem (du Prel et al. 2006). Pollen (Mattei et al. 2007, Stallberg et al. 2007, Navarro et al. 2009). Dust mite (El-Sharif et al. 2003, Mattei et al. 2007, Navarro et al. 2009) and smoking parents (Mattei et al. 2007) belong to the most frequent
environmental risk factors. Furthermore, the smoking of adolescents shows a significant association with wheeze (Mattei et al. 2007). In China, for those suffering from asthma and/or rhinitis the most frequent allergen is house dust mite (Li et al. 2009). For females living in the countryside and having lower education (Laforest et al. (2005), as well as for those belonging to lower income categories (Breton et al. 2006) there is a higher chance of allergic rhinitis. Several authors have demonstrated that explanatory variables analysed in this study are potential components of asthma and allergic rhinitis. For those living in the countryside and contact with farm animals (Waser et al. 2005, Batlles-Garrido et al. 2010), or have pets (Chen et al. 2008), allergic diseases develop rarely. At the same time, pet allergy can occur for sensitive individuals (Stallberg et al. 2007). Furthermore, females are exposed more intensely to asthma (Stallberg et al. 2007) and allergic rhinitis (Mattei et al.
2007, Todo-Bom et al. 2007), furthermore age, smoking (Stallberg et al. 2007), in addition wet housing walls and damp apartment are also risk factors for them (du Prel et al. 2006).
Farm milk consumption ever in life showed a statistical inverse relationship with asthma. In this way the consumption of farm milk may offer protection against asthma and allergy (Waser et al. 2005). Fruit and fish consumption may reduce and fast food consumption may increase the risk for asthma (Norback et al. 2007). Wjst et al. (2005) found that overall allergic rhinitis decreased with geographical latitude. At the same time, no altered risk by birth month was found. They excluded major birth month effects and confirmed the independent effect of language grouping, reflecting genetic or cultural risk factors (Wjst et al. 2005).
Table 8a Total sum of the factor loadings of the explanatory variables for each age category, according to the resultant variables and their rank of importance in developing
the individual effect of the 7 allergens
1Young males
1Young females
1Young individuals,
total
2Adult males
2Adult females
2Adults, total Age groups
Factor
loading Rank Factor
loading Rank Factor
loading Rank Factor
loading Rank Factor
loading Rank Factor loading Rank Resultant
variables
Dust 1.738 3 1.808 4 1.882 3 1.436 6 2.544 1 2.116 1 Pollen 2.254 1 2.198 1 2.562 1 2.444 1 2.395 2 2.067 2 Food 1.953 2 1.913 2 1.517 4 1.944 3 1.237 5 1.085 5 Skin 1.294 6 1.898 3 1.488 5 1.290 7 0.867 7 0.841 7 Pet 1.549 4 1.630 6 2.172 2 2.017 2 2.152 3 1.937 3 Medicine 1.354 5 1.516 7 1.373 6 1.536 5 1.159 6 1.079 6 Insect bite 1.050 7 1.703 5 1.167 7 1.818 4 1.282 4 1.298 4
1: 15 yr < age ≤ 24 yr; 2: 25 yr < age ≤ 54 yr
Though the above risk factors do not cover totally the scope of the selected 26 factors potentially facilitating asthma and allergic rhinitis, they indicate the diversity of the potential effects.
Summing up our results, those suffering from lung disease are significantly more sensitive to at least one allergen, while among those living in family house or contact with chickens or pigs, the number of sensitive individuals is substantially smaller. In the case of young individuals, the ratio of females suffering from any kind of allergy is remarkably higher compared to males. In the same way, elderly females are more sensitive to any allergen compared to elderly males.
Table 8b Total sum of the factor loadings of the explanatory variables for each age category, according to the resultant variables and their rank of importance in developing
the individual effect of the 7 allergens
1Elderly males
1Elderly females
1Elderly,
total Total sensitive
individuals, males Total sensitive
individuals, females Total sensitive individuals, all Age
groups Factor
loading Rank Factor
loading Rank Factor
loading Rank Factor
loading Rank Factor
loading Rank Factor loading Rank Resultant
variables
Dust 3.028 2 2.454 4 1.816 5 0.983 6 2.140 2 0.864 6 Pollen 3.448 1 2.136 5 1.932 4 2.304 1 2.287 1 1.065 2 Food 2.984 4 3.043 1 2.163 1 1.450 2 1.161 5 1.050 3 Skin 2.741 7 2.472 3 1.807 6 1.144 5 1.252 4 1.041 4 Pet 2.987 3 2.871 2 1.941 3 0.974 7 1.914 3 1.493 1 Medicine 2.873 6 1.997 6 1.981 2 1.398 3 1.097 6 0.810 7 Insect
bite
2.879 5 1.538 7 1.300 7 1.192 4 0.991 7 0.942 5
1: age > 54 yr
Applying canonical correlation we found that for sensitive males the most important explanatory variables are lung disease and the bedding material (feather, non-feather) substantially contributes to developing pollen-, dust- and pet allergy. For sensitive females vascular disease and urban apartment living are the most relevant risk factors, mostly provoking dust allergy. Regarding all sensitive individuals, the role of the bedding material (feather, non-feather) and lung disease are the most remarkable; mostly they generate pollen-, dust- and pet allergy.
Using factor analysis and special transformation it was established that for young males the explanatory variables are substantially more efficient in developing pollen- and food allergy than in provoking insect byte allergy. Furthermore, the explanatory variables are remarkably more efficient in developing dust allergy for adult females than for adult males. In addition, both for adult males and females the explanatory variables affect skin allergy to a significantly smaller degree than pet allergy. The most evident result is that the explanatory variables affect each type of allergy for the elderly to a remarkably smaller degree compared to those of the remaining age groups.
It was found that for young individuals vascular and lung diseases are especially effective reasons of allergic diseases; however, heart disease, obesity, alcohol, smoking, the bedding material (feather, non-feather) and dog are also important influencing factors. For adults, high blood pressure, smoking, type and state of the housing walls are the dominant parameters. For the elderly, the environmental factors affect developing allergic diseases much less compared to the remaining two age groups. For elderly females cancer and alcohol are the most relevant risk factors.
The joint effect of the 26 explanatory variables for all three age groups of young individuals and for adult males explains mostly developing pollen allergy, while for the remaining age groups of adults it basically operates through provoking dust allergy. The joint effect of all explanatory variables for elderly males influences fundamentally pollen allergy, for elderly females and all the elderly food allergy, for all sensitive males and females pollen allergy, while for the total sensitive individuals all cases pet allergy.
When summing up factor loadings of each explanatory variables for the individual age categories according to the 7 resultant variables, the most important components of allergic diseases are as follows: for young males heart and lung disease, for young females
lung disease and cattle, while for all young individuals lung disease and smoking. For adult males, females and all adults lung disease is ranked first,whereas heart disease, the bedding material (feather, non-feather) and the state of the housing walls (dry, wet) are the second most important component. For elderly males family house living and urban apartment living are the most relevant risk factors. For elderly females the role of alcohol and cancer is the most substantial, while for all the elderly alcohol and diabetes are the most important explanatory variables. For total sensitive males, females and all cases lung disease is the most dominant factor, while smoking, the bedding material (feather, non-feather) and cattle are the second most relevant components of allergic diseases, respectively.
If sensitivity is detected at an individual to any socio-demographic or environmental factor, then by its conscious modification and/or a changing the way of life one can take decisive steps for preventing allergic diseases or for handling a developed sensitivity.
Acknowledgements: The authors would like to thank those individuals who participated in data collection. The European Union and the European Social Fund provided financial support for the project under the grant agreement nos. TAMOP 4.2.1/B-09/1/KMR-2010-0003, TAMOP-4.2.1/B-09/1/KONV-2010-0005 and TAMOP- 4.2.2/B-10/1-2010-0012).
REFERENCES
Anyo G, Brunekreef B, de Meer G, Aarts F, Janssen NAH, van Vliet P (2002) Early, current and past pet ownership: associations with sensitization, bronchial responsiveness and allergic symptoms in school children. Clin Exp Allergy 32:361-366
Bartra J, Mullol J, del Cuvillo A, Dávila I, Ferrer M, Jáuregui I, Montoro J, Sastre J, Valero A (2007) Air pollution and allergens. J Investig Allergol Clin Immunol 17:3-8
Batlles-Garrido J, Torres-Borrego J, Rubi-Ruiz T, Bonillo-Perales A, Gonzalez-Jimenez Y, De Cabo JM, Aguirre- Rodriguez J, Losillas-Maldonado A, Torres-Daza M (2010) Prevalence and factors linked to atopy in 10-and 11-year-old children in Almeria, Spain. Allergol Immunopath 38:13-19.
Bolla M, Krámli A (2005) A statisztikai következtetések elmélete. [Theory of statistical conclusions. (in Hungarian)] Typotex Kft, Budapest
Bozó L, Szlávik J, Vaskövi Béláné Váraljai I (2003) Az 1990-2003 közötti időszak levegőminőségének értékelése.
Készült Várkonyi T (szerk) „A levegőminőség alakulása Magyarországon az 1990-2003 közötti időszakban” című tanulmánya alapján. [Evaluation of air quality in the period 1990-2003. Based on the study of Várkonyi T (ed) “Air quality in Hungary in the period 1990-2003. (in Hungarian)]
Breton MC, Garneau M, Fortier I, Guay F, Louis J (2006) Relationship between climate, pollen concentrations of Ambrosia and medical consultations for allergic rhinitis in Montreal, 1994-2002. Sci Total Environ 370:39-50
Canonica GW, Bousquet J, Mullol J, Scadding GK, Virchow JC (2008) A survey of the burden of allergic rhinitis in Europe. Allergy, 62(Suppl 85):17-25
Chen CM, Morgenstern V, Bischof W, Herbarth O, Borte M, Behrendt H, Kraemer U, von Berg A, Berdel D, Bauer CP, Koletzko S, Wichmann HE, Heinrich J (2008) Dog ownership and contact during childhood and later allergy development. Eur Respir J 31:963-973
Custovic A, Simpson BM, Simpson A, Hallam CL, Marolia H, Walsh D, Campbell J, Woodcock A (2003) Current mite, cat, and dog allergen exposure, pet ownership, and sensitization to inhalant allergens in adults. J Allergy Clin Immun 111:402-407
D'Amato G, Liccardi G, D'Amato M, Holgate S. (2005) Environmental risk factors and allergic bronchial asthma.
Clin Exp Allergy 35:1113-1124
du Prel X, Kramer U, Behrendt H, Ring J, Oppermann H, Schikowski T, Ranft U (2006) Preschool children's health and its association with parental education and individual living conditions in East and West Germany. BMC Public Health 6, Article No. 312, DOI: 10.1186/1471-2458-6-312
Dullaers M, De Bruyne R, Ramadani F, Gould HJ, Gevaert P, Lambrecht BN (2012) The who, where, and when of IgE in allergic airway disease. J Allergy Clin Immun 129:635-645