CALCULATION OF THE REQUIRED TRANSFUSION VOLUME IN ANAEMIC HOLSTEIN CALVES
Vasile-Ioan MUNTEAN*, Orsolya SÁRPATAKI, Adrian-Valentin POTÂRNICHE, Hemza MEGHZILI, Bogdan SEVASTRE and Ioan MARCUS
Department of Pathophysiology, Faculty of Veterinary Medicine, University of Agricultural Sciences and Veterinary Medicine Cluj-Napoca,
Calea Manastur, No. 3-5, 400372 Cluj-Napoca, Romania (Received 17 January 2018; accepted 25 July 2018)
In bovine medicine, blood transfusion practice represents an emergency therapy where time is critical. The aim of this study was to develop a mathemati- cal model to calculate the required blood for transfusion, using parameters which could be easily determined on the spot. Twenty Holstein calves were assigned to two groups depending on body weight (100.1 ± 3.1 kg and 151.1 ± 3.0 kg, respec- tively). All animals were subjected to an anaemia induction protocol in isovolae- mic conditions in order to reduce the packed cell volume (PCV) by more than one third. Twenty-four hours later, each group received an auto-transfusion therapy.
In order to find a valid constant for specific weight categories with high confi- dence interval in cattle, we calculated the value of constant ‘CC’ for each individ- ual, using a formula described for carnivores as a basis. The value of the constant for the 100.1 ± 3.1 kg and 151.1 ± 3.0 kg groups was 80.6315 ± 1.1069 and 76.5294 ± 2.5640, respectively. The comparison between the two groups demon- strated significantly different mean values (P = 0.0002, by t-test) and, further- more, significantly different values of the constant distributions (P = 0.0001, by the Kolmogorov–Smirnov test).
Key words: Blood transfusion, haematology, anaemia, cattle
Blood transfusion represents an emergency therapy which consists of ad- ministering blood or any of its products to an animal (Brown and Vap, 2004). In calves, the indications of transfusion are very similar to those in human medicine and other animals, and include all types of severe anaemia, haemostasis disor- ders, restoration of plasma protein level, and failure of passive colostral immu- noglobulin transfer in calves (Bell, 2006; Drieu, 2009). In cattle, anaemia may have various aetiologies including parasites such as Babesia spp. and Mycoplas- ma spp., viruses (e.g. bovine viral diarrhoea virus) and bacteria like E. coli (Nagy et al., 2001; Hornok et al., 2006; Kővágó et al., 2015; Dudek et al., 2015; Ben
*Corresponding author; E-mail: dr.muntean.vasile@gmail.com; Phone: 0040-743-867641;
Fax: 0040-264-593792
Dhaou et al., 2016). In contrast to adult cattle, the blood volume used for transfu- sions in calves needs to be calculated more accurately, depending on the body weight and the packed cell volume (PCV), due to the increased risks of circulato- ry overload, resource use, and costs.
In cattle, blood transfusion is an emergency procedure and, in order to de- termine the blood volume required for transfusion using the calculation model described by Hubans-Belkilani (2001) and Drieu (2009), the blood samples need to be sent to the laboratory to determine the haemoglobin levels of both donor and recipient. In the practice, most veterinarians make only approximate estima- tions that a transfused blood volume of 5–7 litres and 0.5–1 litre is sufficient for adult cows and calves, respectively, which is a limitation to the success of therapy.
Other authors consider that approximately 10 ml of transfused blood per kg of body weight is sufficient in most cases (Soldan, 1999; Hubans-Belkilani, 2001;
Drieu, 2009; Mudge, 2010).
The aim of this study was to obtain a formula for calculating the necessary volume of transfused blood in calves using the donor’s PCV, the patient’s body weight and PCV as variables and a constant (CC) characteristic of each species.
Materials and methods
Twenty clinically healthy male Holstein calves, aged between 3 and 5 months, were divided into two groups depending on their body weight (BW) (Group 1 = 100.1 ± 3.1 kg and Group 2 = 151.1 ± 3.0 kg). At the beginning of the experiment a complete clinical examination and a complete blood count (CBC) were performed in order to identify and replace animals presenting an in- flammatory leukogram or any haematological abnormality. The study was per- formed with the approval of the Bioethics and Research Ethics Committee of the University of Agricultural Sciences and Veterinary Medicine Cluj-Napoca and with the consent of the farm owner.
On the second day, the animals were subjected to the Anaemia Induction Protocol (AIP) under isovolaemic conditions, adapting a model used for rabbits (Dunne et al., 2006). The AIP consisted of the extraction of approximately 38%
of the total circulating blood volume of each calf, maintaining a constant blood circulating volume in order to obtain a moderate anaemia and avoiding the ef- fects of secondary hypovolaemia. The animals were sedated with 0.1 mg/kg body weight xylazine (Xylazin Bio 2%, Bioveta A.S., Ivanovice na Hané, Czech Re- public) administered intramuscularly, restrained in lateral recumbency on a rich straw layer and the mid-jugular area was surgically prepared for blood collection.
For local anaesthesia 60 mg procaine (Procamidor 20 mg/ml, Richter Pharma, Wels, Austria) was injected subcutaneously over the jugular vein, then a 12- gauge 80-mm catheter (Vygon, Ecouen, France) was inserted in the jugular vein,
heparinised (Heparine Sodique Panpharma, Laboratoires Panpharma, Fougères, France) and sutured in place. An 18-gauge 60-mm catheter (Lars Medicare, Sul- tanpur, India) was placed on the saphenous vein, after surgically preparing the insertion area, fastened with bandage and heparinised. No incision was neces- sary. A three-way perfusion switch was attached to the saphenous catheter. Sa- line solution 0.9% (Helvetica Profarm S.A., Timisoara, Romania) and a mixture of Duphalyte (Pfizer, Kent, United Kingdom) and calcium borogluconate 30%
(S.C. Pasteur, Filipesti, Romania) were attached to the switch. During the blood collection the animals were restrained in a cage with limited movement, in order to reduce the contention stress and to facilitate the subsequent procedures. Blood was collected in 450-ml blood transfusion bags (CPDA-1 Whole Blood Bag, Lo- tus Global, London, United Kingdom). The total collected blood volume for Group 1 (100.1 ± 3.1 kg) was 2800 ml, in two stages: 1600 ml (20% of the total circulating blood) was extracted without any fluid compensation (Mudge, 2010) and the remaining 1200 ml was collected by simultaneously administering intra- venous fluids through the saphenous catheter, in the same quantities (Dunne et al., 2006).
For the second group (151.1 ± 3.0 kg), the procedure was similar, with a total quantity of collected blood of 4200 ml (2400 ml in the first part and 1800 ml in the second part), with the administration of the same intravenous flu- id volume. At the end of the procedure, the saphenous catheters were removed.
The blood was preserved in transfusion bags for 24 h at 4 °C and then used for auto-transfusion. Each blood bag was gently homogenised and brought to 36–
37 °C in a warm water-bath before administration. The bags were connected to the jugular catheter through a disposable transfusion set with a filter. The first group received 1800 ml and the second group received 2700 ml of blood, at a rate of 20–40 ml/kg/h, without exceeding one litre per hour (Hubans-Belkilani, 2001). In order to increase the PCV by maximum 10% and to avoid circulatory overload after blood transfusion (Brown and Vap, 2004; Drieu, 2009; Mudge, 2010), each subject received a total blood quantity of 18 ml/kg. During the entire protocol, each calf was carefully monitored by checking heart rate, respiration and general attitude. At the end of the study the jugular catheters were removed.
After the experiment, all animals were reintroduced into the normal farm system.
Blood was sampled from all individuals on day 1 to create the experi- mental groups, on day 2 (before AIP) to determine the packed cell volume (PCV), on day 3 (before auto-transfusion) to evaluate the PCV and the severity of anae- mia, and on day 4 to determine the transfusion efficiency and the final PCV. Al- so, blood samples were taken from all blood bags in order to determine the ‘donor’
PCV. The samples were obtained using EDTA vacuum tubes (BD Vacutainer K2 EDTA, Kruuse, Langeskov, Denmark), kept at 4 °C and processed within maxi- mum 8 h after sampling. The PCV was determined on the spot using an ultracen- trifuge (Hettich Universal 320 Bench Centrifuge, Andreas Hettich GmbH and
Co. KG, Tuttlingen, Germany). The CBC was investigated using an Abacus Jun- ior 5 Diff automatic haematology analyser (Diatron Messtechnik, Budapest, Hungary).
In transfusion medicine of domestic carnivores, the blood volume neces- sary for transfusion is calculated using the following formula:
= × × ,
where: V (mL) is the transfused blood volume, BW (kg) is the patient’s body weight, and the constant (CC) is 88 for dogs and 66 for cats according to Godinho-Cunha et al. (2011), while Helm (2014) proposed different CC values:
90 for dogs and 60 for cats. The value of the constant used in the formula is dif- ferent depending on the species, but it also varies within certain limits for the same species according to different authors.
Starting from the formula described above, to calculate the CC value for cattle of specific weight ranges, we replaced all variables normally used in the formulae with known values: body weight, transfused blood volume, donor PCV, desired PCV (PCV_Fin) and patient PCV (PCV_ini), the constant (CC) remain- ing the only unknown parameter in the equation, resulting in the formula:
= × ,
where: V (mL) = transfused blood volume, BW = the patient’s body weight (in kg).
In order to find a valid constant for specific weight ranges with a high con- fidence interval, we calculated the value of constant (CC) for each individual.
The transfused blood volumes were constant for each weight group. The body weight (BW), the donor PCV (PCV_don), the initial PCV of anaemic calves (PCV_ini), the final PCV after transfusion (PCV_fin) and the CC were tested for normal distribution (Shapiro–Wilk, Anderson–Darling, Lilliefors, Jarque–Bera tests, XLStat 2014.5.03, Addin Soft).
The CC was calculated for each calf in each weight group (n = 10). For each animal weight group, statistical validation of the average CC value was tested from a ‘flat’ functional dependence of ordinal series of CC with the BW variable. Linear regression of CC ordinal series with animal weight (BW) as in- dependent variable was done, in order to assess the ‘flatness’ of the CC series (GraphPad Prism 5.3) (Purcarea et al., 2016; Mierlita et al., 2017).
The comparisons between the CC series slopes of the 100.1 ± 3.1 kg and 151.1 ± 3.0 kg groups were done by the analysis of covariance ANCOVA (P = 0.05) test and between the mean values by the t-test (P = 0.05) (PAST 3.12).
This clinical study was performed following the widely accepted veteri- nary practice guidelines, and all animals received the adequate therapy provided by qualified veterinarians. All subjects were fully recovered at the end of the
study and returned into the normal farm system. The research project was per- formed on a dairy cattle farm from Alba County, Romania.
Results
Descriptive statistical results for Group 1 (100.1 ± 3.1 kg) and Group 2 (151.0 ± 3.0 kg) are presented in Tables 1 and 3, respectively. The mean weight of calves from this group has a small variation coefficient, as do all other param- eters.
Table 1
Descriptive statistics of transfusion parameters for the 100.1 ± 3.1 kg group 100.1 ± 3.1 kg group BW
(kg)
PCV_don (%)
PCV_ini (%)
PCV_fin (%)
ΔPCV
(%) CC No. of observations 10. 10. 10. 10. 10. 10.
Minimum 95.0 29.50 19.00 26.00 7.00 79.2233 Maximum 105.0 35.00 21.50 29.00 7.50 82.3856 Mean 100.1000 31.8500 19.9500 27.0500 7.1000 80.6315 Standard deviation 3.1429 1.7488 0.9560 1.1168 0.2108 1.1069 Variation coefficient 0.0298 0.0521 0.0455 0.0392 0.0282 0.0130 Standard error of the mean 0.9939 0.5530 0.3023 0.3532 0.0667 0.3500 Lower limit of the mean
(95%) 97.8517 30.5990 19.2661 26.2511 6.9492 79.8397 Upper limit of the mean
(95%) 102.3483 33.1010 20.6339 27.8489 7.2508 81.4233
BW = body weight; PCV = packed cell volume; CC = constant
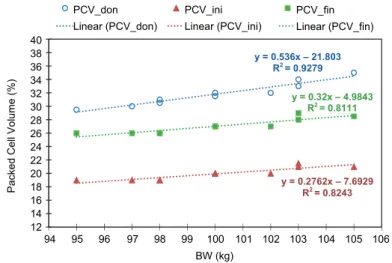
The linear regressions of PCV_don, PCV_ini and PCV_fin over BW (kg) parameters present high values for the determination coefficient R2 (0.8111–
0.9279) (Fig. 1), thus the parameters data series have a significant functional as- sociation with the weight parameter. The higher the determination coefficient (R2), the stronger is the functional association of the two variables. This means that the selected individuals in the animal weight group present PCV_don, PCV_ini and PCV_fin consistency with respect to the BW parameter, and the values are consistent for the group. Furthermore, the slope values of the above- mentioned linear regressions are under the unity value, thus the selected calves form a consistent experimental group with the same BW value (i.e. 100 kg and 150 kg, respectively). The results of statistical analysis for the regression coeffi- cients are presented in Table 2 and Fig. 2. All the linear regressions show signifi- cant deviations from linearity and a non-significant deviation from the null value of the slopes, except the CC parameter. The CC is expected to behave in this way, as the goal of the experiment was to establish a constant value for CC (i.e. a
‘flat’ linear regression) that assumes a slope value non-significantly deviating
from zero (see also Fig. 2). The result is even more consistent as the CC linear regression was performed with the CC mean value (0; 80.6315) as fixed point.
Fig. 1. Linear regressions of transfusion parameters for the 100.1 ± 3.1 kg group
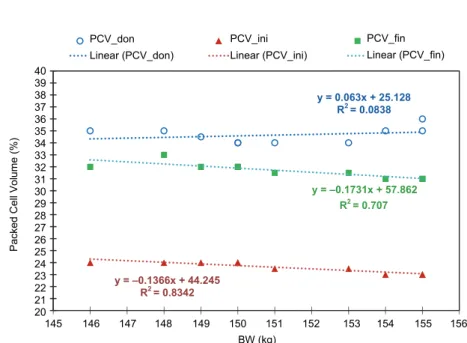
For Group 2 (151.1 ± 3.0 kg), the linear regressions of PCV_don, PCV_ini, PCV_fin over the BW (kg) parameter present average-high values for the deter- mination coefficient R2 (0.7070–0.8342) (Fig. 3), thus the parameters data series have a significant functional association with the weight parameter.
The results of statistical analysis for the regression coefficients are pre- sented in Table 4 and Fig. 4. The parameters have non-significant deviations from linearity and a non-significant deviation from the null value of the slopes. Thus, CC has a quasi-constant value (i.e. a ‘flat’ linear regression, see also Fig. 2). The result is even more consistent as the CC linear regression was performed with the CC mean value (0; 74.6952) as fixed point.
The average CC value is 80.6315 ± 1.1069 and 76.5294 ± 2.5640 for the 100.1 ± 3.1 kg and the 151.1 ± 3.0 kg animal weight group, respectively. The CC (BW) ordinal series linear regressions generated non-significant slope deviations with P = 0.6626 for the 100.1 ± 3.1 kg weight group and P = 0.8547 for the 151.1 ± 3.0 kg weight group. The comparison between the CC series slopes of the two groups demonstrates a statistically non-significant slope difference (P = 0.6052).
The comparison between the 100.1 ± 3.1 kg and 151.1 ± 3.0 kg groups shows significantly different mean values (P = 0.0002, t-test), significantly different CC value distributions (P = 0.0001, Kolmogorov–Smirnov test) and non-signifi- cantly different CC coefficients of variation (P = 0.2975, Fligner–Killeen test).
y = 0.536x - 21.803 R² = 0.9279
y = 0.2762x - 7.6929 R² = 0.8243 y = 0.32x - 4.9843
R² = 0.8111
12.0 14.0 16.0 18.0 20.0 22.0 24.0 26.0 28.0 30.0 32.0 34.0 36.0 38.0 40.0
94 95 96 97 98 99 100 101 102 103 104 105 106
BW(kg)
PCV_don PCV_ini PCV_fin
Linear (PCV_don) Linear (PCV_ini) Linear (PCV_fin)
BW (kg) 40
38 36 34 32 30 28 26 24 22 20 18 16 14 12
94 95 96 97 98 99 100 101 102 103 104 105 106 PCV_don
Linear (PCV_don)
PCV_ini Linear (PCV_ini)
PCV_fin Linear (PCV_fin)
Packed Cell Volume (%)
y = 0.536x – 21.803 R2 = 0.9279
y = 0.32x – 4.9843 R2 = 0.8111
y = 0.2762x – 7.6929 R2 = 0.8243
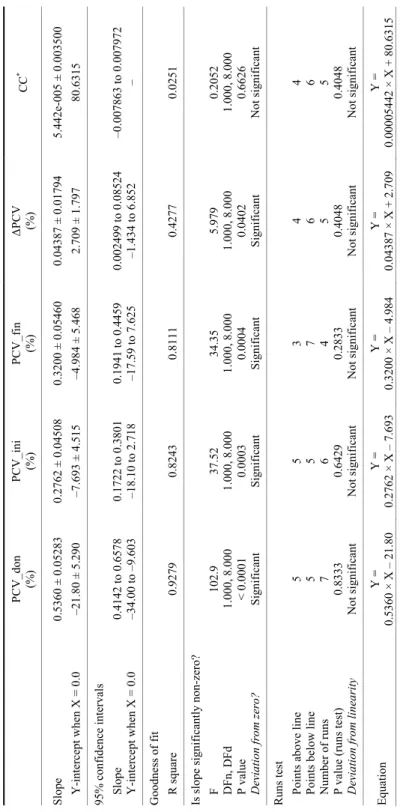
Table 2 Best-fit values of coefficients from the linear regressions of transfusion parameters for the 100.1 ± 3.1 kg group PCV_don (%)PCV_ini (%)PCV_fin (%)ΔPCV (%)CC* Slope 0.5360 ± 0.052830.2762 ± 0.045080.3200 ± 0.054600.04387 ± 0.01794 5.442e-005 ± 0.003500 Y-intercept when X = 0.0 –21.80 ± 5.290 –7.693 ± 4.515 –4.984 ± 5.468 2.709 ± 1.79780.6315 95% confidence intervals Slope 0.4142 to 0.65780.1722 to 0.38010.1941 to 0.44590.002499 to 0.08524 –0.007863 to 0.007972 Y-intercept when X = 0.0 –34.00 to –9.603–18.10 to 2.718 –17.59 to 7.625 –1.434 to 6.852 – Goodness of fit R square 0.92790.82430.81110.42770.0251 Is slope significantly non-zero? F 102.9 37.5234.355.9790.2052 DFn, DFd1.000, 8.0001.000, 8.0001.000, 8.0001.000, 8.0001.000, 8.000 P value < 0.00010.00030.00040.04020.6626 Deviation from zero? SignificantSignificantSignificantSignificantNot significant Runs test Points above line5 5 3 4 4 Points below line 5 5 7 6 6 Number of runs 7 6 4 5 5 P value (runs test) 0.83330.64290.28330.40480.4048 Deviation from linearityNot significantNot significantNot significantNot significantNot significant EquationY = 0.5360 × X – 21.80Y = 0.2762 × X – 7.693 Y = 0.3200 × X – 4.984 Y = 0.04387 × X + 2.709 Y = 0.00005442 × X + 80.6315 * Note: For this parameter fixed-point linear regression was performed
Fig. 2. Fixed-point linear regression of CC data series for the 100.1 ± 3.1 kg group; the fixed point was 0; 80.6315)
Table 3
Descriptive statistics of transfusion parameters for the 151.1 ± 3.0 kg group 151.0 ± 3.0 kg group BW
(kg) PCV_don
(%) PCV_ini
(%) PCV_fin
(%) ΔPCV
(%) CC
No. of observations 10 10 10 10 10 10 Minimum 146.0000 34.0000 23.0000 31.0000 8.0000 70.9459 Maximum 155.0000 36.0000 24.0000 33.0000 9.0000 80.9075 Mean 151.1000 34.6500 23.6000 31.7000 8.1000 76.5294 Standard deviation 3.0714 0.6687 0.4595 0.6325 0.3162 2.5640 Variation coefficient 0.0193 0.0183 0.0185 0.0189 0.0370 0.0318 Standard error of the mean 0.9713 0.2115 0.1453 0.2000 0.1000 0.8108 Lower limit of the mean
(95%) 148.9029 34.1716 23.2713 31.2476 7.8738 74.6952 Upper limit of the mean
(95%) 153.2971 35.1284 23.9287 32.1524 8.3262 78.3636
Discussion
In blood transfusion medicine, there are different methods for calculating the necessary blood volume for transfusion, which depends on many factors in- cluding the species. Davies et al. (2007) described a traditional method used in the UK for paediatric transfusion as being weight (kg) × aimed haemoglobin concentration increment (Hb; g/dl) × transfusion factor usually quoted 3 or 4, and they recommended the use of another formula: weight (kg) × increment in Hb (g/dl) × 3/[haematocrit (Hct) level of RBCs].
77 78 79 80 81 82 83 84
93 94 95 96 97 98 99 100 101 102 103 104 105 106 107
CC
BW (kg)
Active Model
Conf. interval (Mean 95%) Conf. interval (Obs. 95%) BW (kg)
84 83 82 81 80 79 78 77
93 94 95 96 97 98 99 100 101 102 103 104 105 106 107
Active
Conf. interval (Mean 95%)
CC
Model
Conf. interval (Obs. 95%)
Fig. 3. Linear regressions of transfusion parameters for the 151.1 ± 3.0 kg group
In veterinary medicine, blood transfusion therapy is well studied for do- mestic carnivores, while in cattle and other species only few data are available.
Reed et al. (2014) performed a retrospective study in order to identify the most accurate formulae for estimating the PCV increase after whole blood transfusion in cats, as the literature reported several formulae but none of them was validat- ed. None of the formulae was highly accurate in predicting the PCV in cats after whole blood transfusions and, due to the wide confidence interval, the authors recommended that these formulae should be used judiciously in the clinical set- ting. Similar studies were performed for dogs (Short et al., 2012). The few meth- ods currently used in bovine transfusion medicine allow veterinarians to predict the post-transfusion PCV only with a wide error interval (Hubans-Belkilani, 2001; Bell, 2006; Drieu, 2009; Mudge, 2010).
In this study, we have analysed how the volume and PCV of transfused blood affect the PCV of anaemic calves across two different weight groups and different PCV levels. This should help veterinarians to practice evidence-based medicine in the clinical practice by allowing them to predict the PCV obtained after whole blood transfusion. The experiment assessed the CC values: 80.6 for the 100.1 ± 3.1 kg group and 76.5 for the 151.1 ± 3.0 kg group, and statistically validated (by fix-point linear regression) the calculated CC mean values by prov- ing the ‘flatness’ of the ordinal series according to the BW values. Also, it can be stated (based on the ANCOVA test, P = 0.05) that these two weight groups have different CC mean values, with different value distributions and the same coeffi- cients of variations.
y = 0.063x + 25.128 R² = 0.0838
y = -0.1366x + 44.245 R² = 0.8342
y = -0.1731x + 57.862 R² = 0.707
20.0 21.0 22.0 23.0 24.0 25.0 26.0 27.0 28.0 29.0 30.0 31.0 32.0 33.0 34.0 35.0 36.0 37.0 38.0 39.0 40.0
145 146 147 148 149 150 151 152 153 154 155 156
Packed Cell Volume (%)
BW (kg)
PCV_don PCV_ini PCV_fin
Linear (PCV_don) Linear (PCV_ini) Linear (PCV_fin) 40
39 38 37 36 35 34 33 32 31 30 29 28 27 26 25 24 23 22 21
20 145 146 147 148 149 150 151 152 153 154 155 156 PCV_don
Linear (PCV_don)
PCV_ini Linear (PCV_ini)
PCV_fin Linear (PCV_fin)
Packed Cell Volume (%)
BW (kg)
y = 0.063x + 25.128 R2 = 0.0838
y = –0.1731x + 57.862 R2 = 0.707
y = –0.1366x + 44.245 R2 = 0.8342
The experiment analysed only two separate weight groups, 100.1 ± 3.1 kg and 151.1 ± 3.0 kg, and generated two statistically different values of CC. The BW difference between the analysed groups can be considered to be high but it does not cover the entire weight range encountered in the clinical practice. The proposed method is applicable to two specific weight categories and, in order to alleviate this experimental limitation, future work should consider a wider weight range and larger groups.
References
Bell, G. (2006): Blood transfusion in cattle. UK Vet. 11, 1–4.
Ben Dhaou, S., Sailleau, C., Babay, B., Viarouge, C., Sghaier, S., Zientara, S., Hammami, S. and Bréard, E. (2016): Molecular characterisation of epizootic haemorrhagic disease virus as- sociated with a Tunisian outbreak among cattle in 2006. Acta Vet. Hung. 64, 250–262.
Brown, D. and Vap, L. (2004): Principles of blood transfusion and cross-matching. In: Thrall, M.
A., Baker, D. C., Campbell, T. W., DeNicola, D., Fettman, M. J., Lassen, D. E., Rebar, A.
and Weiser, G. (eds) Veterinary Hematology and Clinical Chemistry. Lippincott Williams
& Wilkins, Philadelphia. pp. 197–211.
Davies, P., Robertson, S., Hegde, S., Greenwood, R., Massey, E. and Davis, P. (2007): Calculating the required transfusion volume in children. Transfusion 47, 212–216.
Drieu, C. (2009): Hématologie en Médecine Bovine et Application à la Réalisation d’une Transfusion.
École Nationale Vétérinaire d’Alfort, Maisons-Alfort, France. pp. 109–111.
Dudek, K., Bednarek, D., Szacawa, E., Rosales, R. S. and Ayling, R. D. (2015): Flow cytometry follow-up analysis of peripheral blood leukocyte subpopulations in calves experimentally infected with field isolates of Mycoplasma bovis. Acta Vet. Hung. 63, 167–178.
Dunne, J., Caron, A., Menu, P., Alayash, A. I., Buehler, P. W., Wilson, M. T., Silaghi-Dumitrescu, R., Faivre, B. and Cooper, C. E. (2006): Ascorbate removes key precursors to oxidative damage by cell-free haemoglobin in vitro and in vivo. Biochem. J. 399, 513–524.
Godinho-Cunha, L. F., Ferreira, R. M. R. F. and Silvestre-Ferreira, A. C. (2011): Whole blood transfusion in small animals: indications and effects. Anais da Academia Brasileira de Ciências 83, 611–617.
Helm, J. (2014): Canine and feline blood transfusions in practice. Vet. Ireland J. 4, 525–529.
Hornok, S., Edelhofer, R., Szotáczky, I. and Hajtós, I. (2006): Babesia divergens becoming extinct in cattle of Northeast Hungary: new data on the past and present situation. Acta Vet. Hung.
54, 493–501.
Hubans-Belkilani, V. J. (2001): La transfusion sanguine chez les bovins. École Nationale Vétérinaire D’Alfort, Maisons-Alfort, France. pp. 34–37.
Kővágó, C., Forgách, P., Szabára, Á., Mándoki, M., Hornyák, Á., Duignan, C., Gere, E. P. and Rusvai, M. (2015): Seroprevalence of bovine viral diarrhoea virus in Hungary – situation before launching an eradication campaign. Acta Vet. Hung. 63, 255–263.
Mierlita, D., Pop, I. M., Teusdea, A., Lup, F., Daraban, S., Georgescu, B., Boaru, A. and Rahman, G. (2017): Effect of forage preservation method on fatty acid composition and oxidative stability of organic sheep milk. Landbauforschung 67, 43–51.
Mudge, M. C. (2010): Blood transfusion in large animals. In: Weiss, D. J. and Wardrop, K. J. (eds) Schalm’s Veterinary Hematology. Blackwell Publishing Ltd., Ames, Iowa, USA. pp. 757–762.
Nagy, O., Kováć, G., Seidel, H. and Weissová, T. (2001): The effect of arterial blood sampling sites on blood gases and acid-base balance parameters in calves. Acta Vet. Hung. 49, 331–340.
Purcarea, C., Teusdea, A. C. and Chis, A. M. (2016): Chemometric analysis of selected honey samples from western part of Romania. Revista de Chimie 67, 2129–2133.
Reed, N., Espadas, I., Lalor, S. and Kisielewicz, C. (2014): Assessment of five formulae to predict post transfusion packed cell volume in cats. J. Feline Med. Surg. 16, 651–656.
Short, L. J., Diehl, S., Seshari, R. and Serrano, S. (2012): Accuracy of formulas used to predict post-transfusion packed cell volume rise in anemic dogs. J. Vet. Emerg. Crit. Care (San Antonio) 22, 428–434.
Soldan, A. (1999): Blood transfusions in cattle. In Practice 21, 590–595.