ORIGINAL PAPER
Association of allergic rhinitis or asthma with pollen and chemical pollutants in Szeged, Hungary, 1999 – 2007
László Makra&István Matyasovszky&Beatrix Bálint&
Zoltán Csépe
Received: 6 September 2012 / Revised: 26 February 2013 / Accepted: 26 February 2013
#ISB 2013
Abstract The effect of biological (pollen) and chemical air pollutants on respiratory hospital admissions for the Szeged region in Southern Hungary is analysed. A 9-year (1999–
2007) database includes—besides daily number of respiratory hospital admissions—daily mean concentrations of CO, PM10, NO, NO2, O3and SO2. Two pollen variables (Ambrosia and total pollen excludingAmbrosia) are also included. The analysis was performed for patients with chronic respiratory complaints (allergic rhinitis or asthma bronchiale) for two age categories (adults and the elderly) of males and females.
Factor analysis was performed to clarify the relative impor- tance of the pollutant variables affecting respiratory com- plaints. Using selected low and high quantiles corresponding to probability distributions of respiratory hospital admissions, averages of two data sets of each air pollutant variable were evaluated. Elements of these data sets were chosen according to whether actual daily patient numbers were below or above their quantile value. A nonparametric regression technique was applied to discriminate between extreme and non- extreme numbers of respiratory admissions using pollen and
chemical pollutants as explanatory variables. The strongest correlations between extreme patient numbers and pollutants can be observed during the pollen season ofAmbrosia, while the pollen-free period exhibits the weakest relationships. The elderly group with asthma bronchiale is characterised by lower correlations between extreme patient numbers and pol- lutants compared to adults and allergic rhinitis, respectively.
The ratio of the number of correct decisions on the exceedance of a quantile resulted in similar conclusions as those obtained by using multiple correlations.
Keywords Air pollution . Allergenic pollen . Respiratory hospital admissions . Patient number . Allergic rhinitis . Asthma bronchiale
Introduction
Air pollution—a major and constantly rising hazard in the environment associated with large increases in medical ex- penses and morbidity—is estimated to cause about 800,000 premature deaths annually worldwide (Cohen et al. 2005).
Considering respiratory diseases, asthma is a global health problem affecting around 300 million patients in all countries around the world (Kupczyk and Wenzel2012). Clinical evi- dence reveals a substantial increase in both incidence and prevalence of respiratory diseases such as allergic rhinitis and asthma (Albertini et al. 2012; Ziello et al. 2012). This increase may be related not only to climate change, chemical air pollution and changes in lifestyle (Kiss and Béres2006;
Cecchi et al. 2010), but also to an increase in the actual airborne concentrations of allergenic pollen (Ziello et al.
2012). Global warming is recognised increasingly as a major risk to human health. The continuing increase in atmospheric CO2 levels, as a major component of climate change L. Makra (*)
:
Z. CsépeDepartment of Climatology and Landscape Ecology, University of Szeged, POB 653, 6701 Szeged, Hungary
e-mail: makra@geo.u-szeged.hu Z. Csépe
e-mail: csepe.zoltan@gmail.com I. Matyasovszky
Department of Meteorology, Eötvös Loránd University, Pázmány Péter st. 1/A,
1117 Budapest, Hungary e-mail: matya@ludens.elte.hu B. Bálint
Hospital of Chest Diseases, Alkotmány u. 36, Csongrád County, 6772 Deszk, Hungary e-mail: balint@deszkikorhaz.hu DOI 10.1007/s00484-013-0656-9
associated with urbanisation (Ziska et al.2007), can influence public health directly by stimulating the growth and pollen production of allergy-inducing species such as ragweed (Ziska and Caulfield2000; Rogers et al.2006; Ziska et al.2007).
Allergic rhinitis (AR) is a common inflammatory condition of the nasal mucosa characterised by nasal pruritus, sneezing, rhinorrhoea, and nasal congestion. AR is mediated by an IgE- associated response to ubiquitous indoor and/or outdoor envi- ronmental allergens (Dullaers et al.2012).
Asthma is defined as a chronic inflammatory disorder, where chronic inflammation is associated with airway hyper- responsiveness that leads to recurrent episodes of wheezing, breathlessness, chest tightness and coughing, particularly at night or in the early morning (Global Strategy for Asthma Management and Prevention 2010). Asthma is caused by environmental and genetic factors (Martinez 2007), which influence the severity of asthma. The interaction of these factors is complex and not fully understood (Miller and Ho 2008).
Many patients with asthma, particularly those with allergic asthma, also have AR. The mucosa of the upper and lower airways is continuous, and the type of inflammation in AR and asthma is very similar, involving T helper type 2 cells, mast cells, and eosinophils (Jeffery and Haahtela2006). Both dis- eases have characteristic symptoms and are influenced strongly by environmental factors.
A number of characteristics that can lead to an increased risk of pollutant-related respiratory diseases have been identi- fied, including sex, age (i.e. children, adults and the elderly), pre-existing respiratory disease and low socio-economic status (Sacks et al.2011).
The harmful effects of ozone (O3), nitrogen dioxide (NO2) and particulate matter (PM) on respiratory symptoms and functions are well documented (Chung et al.2011; Nuvolone et al.2011; Zhang et al.2011). Recent studies, particularly in urban areas, have suggested a role of pollutants in the devel- opment of respiratory diseases (Chiusolo et al.2011; Darrow et al. 2011; Namdeo et al. 2011). Evidence is emerging that traffic-related pollutants may contribute to the development of allergy (Kelly and Fussell 2011; Koppen et al. 2011).
Furthermore, numerous epidemiological and experimental studies suggest an association between exposure to ambient NO2, O3and PM and an increased susceptibility to respiratory morbidity (Giovannini et al.2010; Kim et al.2011; Tramuto et al.2011).
The substantial increase in respiratory diseases in industrialised countries is attributable partly to a combination of chemical air pollutants and allergenic pollen existing in the air of big cities (Gowers et al.2012). Several papers have analysed separately the effects of either chemical air pollutants (Chiu et al.2009; Alves et al.2010) or allergenic pollen (Díaz et al.2007; Hanigan and Johnston2007; Carracedo-Martínez et al. 2008) on the frequency of hospital admissions for
respiratory diseases; however, only very few studies have yet examined the effect of both these variables together (e.g.
Andersen et al.2007; Magas et al.2007). Such studies revealed a significant effect between partly the pollen and chemical compounds and partly health for admitted respiratory patients, and this effect was higher than that detected separately for either the chemical air pollutants or pollen.
Air pollution in Hungary is one of the highest in Europe. An estimated 16,000 annual premature deaths in the country are attributable to exposure to ambient PM10 concentrations (Barrett et al.2008; Ågren2010). Furthermore, airborne pollen levels are also high. The Carpathian basin involving Hungary (Fig.1) is characterized by the highest airborne ragweed (Am- brosia) pollen concentrations in Europe. The ratio of captured Ambrosiapollen in Hungary in relation to the captured total pollen in the late summer period is around 60–71 % (Makra et al.2005). The sensitivity of patients to ragweed in Szeged is 83.7 % (Makra et al. 2005). About 30 % of the Hungarian population has some type of allergy, 65 % of them have pollen- sensitivity, and at least 60 % of this pollen-sensitivity is caused byAmbrosia (Járai-Komlódi1998). The number of patients with registered allergic illnesses has doubled and the number of cases of allergic asthma in Southern Hungary has quadru- pled over the last 40 years (Járai-Komlódi1998).
The purpose of this study was to analyse the effect of biological (pollen) and chemical air pollutants on daily respi- ratory hospital and outpatient admissions with AR and asthma bronchiale (AB) for both adult and elderly patients of both genders over three different seasons in the Szeged region of Southern Hungary.
Materials and methods
Study area
Szeged (46.25°N; 20.10°E) is the largest settlement in South- eastern Hungary (Fig. 1). The area is characterised by the extensive flat landscape of the Great Hungarian Plain with an elevation of 79 m above mean sea level. The built-up area covers a region of about 46 km2. The city is the centre of the Szeged region and has 203,000 inhabitants.
Pollen data
The pollen content of the air was measured using a 7-day recording “Hirst-type”volumetric trap (Hirst1952). The air sampler is located about 20 m above the ground (Fig.1, lower panel). After sampling, in order to determine pollen type and counts, a light microscope was applied at a magnification of × 400. Five horizontal sweeps were analysed on each slide. The accuracy of the measurement was proportional to the number of sweeps and the concentration of particles. Counting was
performed using a standard sampling procedure (Käpylä and Penttinen 1981; Peternel et al. 2006). Two pollen variables were formed for our analysis: special emphasis was places on the daily pollen counts ofAmbrosia, due to its extremely high concentrations during its short pollen season, and the daily total pollen count (the pollen counts of each of the 24 taxa examined) excluding the pollen ofAmbrosia. Pollen data were expressed as daily mean pollen concentration (pollen grains/m3).
The analysis was performed for a 9-year (1999–2007) dataset. Three periods were considered: the first is theAmbro- siapollen season (15 July–16 October ); the second period lasts from 14 January (the start date of the pollination of Corylus) to 14 July and corresponds to the period when most pollen is captured; the third is the pollen-free period (17 October–13 January) in which the amount of airborne pollen is very low or zero.Ambrosiapollen and total pollen excluding Ambrosiapollen were the pollen variables applied during the first period (15 July–16 October), total pollen excluding
Ambrosia pollen was considered during the second period and any pollen variable was taken into account in the third period.
The pollen season is defined by its start and end dates. For the start (end) of theAmbrosiapollen season we used the 1st (last) day of the first (last) 6-day period, each day of which shows 1 or more pollen grains m−3air (Galán et al. 2001).
Evidently, the pollen season varies from year to year. The atmospheric pollen season was defined for each year and the longest observed over the 9-year period was taken into account to determine the three given periods. This definition was considered even if the remaining years involved substantially different pollen seasons with either markedly later start or notably earlier end of pollen release.
Chemical air pollutant data
Chemical air pollutants were collected in a monitoring station located in downtown Szeged at a distance of about 10 m from Fig. 1 Upper panelLocation
of Hungary within Europe.
Lower panelUrban web of Szeged with the positions of the data sources:1monitoring station,2aerobiological station, 3Hospital of Chest Diseases in Deszk
the busiest main road (Fig.1). They included the daily average mass concentrations of CO (mg m−3), NO, NO2, SO2, O3and PM10(μg m−3) (Alves et al.2010). Mean daily concentrations of the chemical air pollutants for the three periods are presented in Table1.
Patient data
The daily number of hospital admissions registered with respi- ratory diseases came from the Hospital of Chest Diseases, Deszk, Csongrád County, located about 10 km from the mon- itoring station in downtown Szeged (Fig.1, lower panel). The patients were admitted to the outpatient clinic and the hospital accepts patients directly from the ER without delay. Most of the patients were treated as out-patients. The diagnosis of allergy was defined according to the presence of appropriate clinical symptoms and signs associated with the evidence of IgE antibodies directed towards relevant allergens determined by a skin-prick test. If the result of the skin-prick test was not suitable for identifying the allergen, total IgE and specific IgE were measured from blood. Data on the age, sex, date of admission and disease type were all available for each patient.
Respiratory diseases were categorised using the Internation- al Classification of Diseases, Tenth Revision (ICD-10) (WHO 1999). All patients registered with the diagnosis of AR and asthma bronchiale—either as inpatients or outpatients during the study period—were included. More precisely, AR due to pollen (J3010), seasonal allergic rhinitis (J3020), other allergic rhinitis (J3030), non-specific allergic rhinitis (J3040), as well as allergic asthma (J4500), non-allergic asthma (J4510) and mixed asthma (J4580) were considered.
Two age groups were considered in the research: adult patients (15–64 years) and the elderly patients (≥65 years).
The younger age group (0–14 years), was not analysed due to the very small patient numbers. Hence male and female pa- tients for the adult and elderly age groups were considered.
The population consisted of 133,464 hospital admissions of subjects resident in Szeged. The number of hospital admis- sions registered with respiratory diseases is summarised for different groups of patients and periods (Table2). Note, that, as days without admission to the outpatient department, Sat- urdays, Sundays and holidays were excluded from the analysis.
The data set applied is unique in the sense that it includes both categories of air pollutants as influencing variables.
The study analyzes one of the largest data sets used in the literature on respiratory hospital admissions.
Statistical analysis
First, a factor analysis with special transformation was performed on the air pollutant and respiratory admission data in order to determine the strength and direction of the association of air pollutant and respiratory admission vari- ables. Then, using selected low and high quantiles corre- sponding to probability distributions of AR and asthma, daily mean concentrations of pollen and chemical air pol- lutants were compared and evaluated. From here on, we refer to extreme patient number whenever the daily patient number is larger than the chosen high quantile of patients.
Finally, two techniques were applied to discriminate be- tween extreme and non-extreme respiratory admission vari- ables using pollen and chemical air pollutants.
Optimal time lags
It is reasonable to allow time lags between pollutants concen- trations and number of hospital admissions. A wide range of candidate time lags is applied in the literature to find the optimal time delay (e.g. Orazzo et al.2009). Although there are examples of time lags of up to 5 days (Ko et al.2007) and even 8 days (Nascimento et al.2006), the literature generally shows delays of up to 3 days in patient response to pollution exposure (WHO1992; Alves et al.2010). It is likely that the explanatory variables express their effects until the formation of the respiratory problems within 3 days (Knight et al.1991).
Our optimal time lags were selected with the help of the t- values of regression coefficients. Namely, a time lag accom- panied with the highest absolutet-value was chosen as optimal for each explanatory variable separately.
Factor analysis and special transformation
Factor analysis identifies any linear relationships among sub- sets of examined variables and this helps to reduce the dimen- sionality of the initial database without substantial loss of information. First, a factor analysis was applied to the initial dataset consisting of nine variables (eight explanatory vari- ables and one resultant variable defined by the number of daily hospital and outpatient admissions with AR and asthma) Table 1 Mean daily concentrations of the chemical air pollutants for the three periods examined
Period: CO (mg m−3) PM10(μg m−3) NO (μg m−3) NO2(μg m−3) O3(μg m−3) SO2(μg m−3)
14 January–14 July 464.2 39.6 13.3 28.4 39.7 6.2
15 July–16 October 425.4 36.7 13.1 26.6 37.3 4.7
17 October–13 January 627.8 48.3 25.6 27.2 15.0 7.9
in order to transform the original variables to fewer variables.
These new variables (called factors) can be viewed as latent variables that explain the behaviour of pollutant-hospital ad- mission variables. The optimum number of retained factors can be determined by applying different statistical criteria (Jolliffe1993). The most common and widely accepted crite- rion is to specify a least percentage (80 %) of the total variance in the original variables that has to be achieved (Liu2009).
After performing the factor analysis, a special transforma- tion of the retained factors was made in order to discover to what degree the above-mentioned explanatory variables affect the resultant variable, and to rank their influence (Fischer and Roppert 1965; Jahn and Vahle 1968). When performing a factor analysis on the standardised variables, the factor load- ings obtained are correlation coefficients between the original variables and, after rotation, the coordinate values belonging to the rotated axes (namely, factor values). Consequently, if the resultant variable is correlated strongly with the factor; that is to say, if the factor has a high factor loading at the place of the resultant variable, and within the same factor an influenc- ing variable is highly correlated with the factor, then the influencing variable is also highly correlated with the resultant variable. Accordingly, it is advisable to combine all the weights of the factors, together with the resultant variable, into one factor. Namely, it is effective to rotate such that only one factor has a big load with the resultant variable. The remaining factors are uncorrelated with the resultant variable;
that is to say, they have zero weight (Fischer and Roppert 1965; Jahn and Vahle1968). This latter procedure is called a special transformation.
t-test
Quantiles corresponding to probabilities 0.9, 0.8 and 0.7 were determined first. Note that a P-quantile (0<P<1) qp
is the value below which the daily number of patients occurs with relative frequency P. The above-mentioned chronic respiratory diseases were then assigned to two categories according to whether the actual daily number of admissions due to respiratory diseases was below the actual quantile or
not. Values of daily chemical air pollutant and pollen vari- ables corresponding to the number of respiratory hospital admissions below and above the quantiles 0.9, 0.8, 0.7 were analysed. Specifically, the t-test (Zimmerman 1997) was used to decide whether the means of each chemical air pollutant and pollen variable differ significantly under each above mentioned quantiles.
Nonparametric regression
Let Y be an indicator variable that takes the values 1 or 0 according to whether the daily patient number exceeds or does not exceed a quantile of patients. Our goal was to estimate the quantile exceedance probability conditioned on the explaining variablesX=(X1,…,Xm). In order to avoid misspecification of the analytical form of the relationship betweenXandYa nonparametric regression technique was applied. Because every variable has an annual cycle, the estimator uses data from only a time interval (time window) of the actual timet. Having a data set ðx1;y1Þ;. . .;ðxn;ynÞ available at instances t1;. . .;tn we extend the classical Nadaraya-Watson estimator to the time-varying case as b
yð Þ¼x;t Xn
i¼1
yiKðkxixk=hÞK tððitÞ=bÞ Xn
i¼1
Kðkxixk=hÞ ,
K tððitÞ=bÞ
ð1Þ whereK(u) is a kernel function evaluated atu, andbis the time window. Thus, the estimated probability is a weighted sum of the indicator valuesyiaccompanied with explanatory variables xi. The weights are controlled by the distance
xix
k k via the kernel K, which is chosen here as the Epanechnikov kernel. Specifically, when xi is close to x the weight of yi is large, while anxifar from xprovides a small weight for yi. The so-called bandwidth h plays a similar role to that of b; it controls the neighbourhood of the explaining variablexwherexi, and thusyi, are taken into account. The distance mentioned above is the Euclidean distance with a slight modification. Namely, in order to ensure the same potential importance of every explanatory Table 2 Number of hospital admissions registered with respiratory diseases for different groups of patients and periods.ARAllergic rhinitis;AB asthma bronchiale
Period: Adults (15–64 years) Elderly (≥65 years) Total
Male Female Subtotal Male Female Subtotal
AR AB AR AB AR AB AR AB
15 July–16 October 1,996 5,846 1,711 10,124 19,677 428 4,420 713 5,133 10,694 30,371 17 October–13 January 2,994 8,270 1,141 10,837 23,242 1,283 6,417 1,711 5,704 15,115 38,357 14 January–14 July 2,424 13,974 4,278 18,964 39,640 2,281 12,263 1,426 9,126 25,096 64,736
Total 7,414 28,090 7,130 39,925 82,559 3,992 23,100 3,850 19,963 50,905 133,464
variable, the variables are divided first by their standard deviations. Hence,hhas no unit.
A rigorous mathematical background of nonparametric regression techniques including ideas to choose the kernel and estimatehandbcan be found, e.g. in Fan and Yao (2005).
The goodness-of-fit of estimating quantile exceedance probabilities conditioned on the explanatory variables is measured by R¼ð1MSE V= Þ1 2= , where MSE¼1=nPn
i¼1
byðxi;tiÞ yðxi;tiÞ
ð Þ2 and Vis the variance calculated from the indicator data ðy1;. . .;ynÞ. Because Ris identical with the multiple correlation for multivariate linear regressions, hereafter the quantityRwill be called multiple correlation.
Usually, a data set available is divided into a learning set and a validation set. The learning set is used to estimate parameters of the statistical model, and this model is then applied to the validation set. A general rule of thumb is to consider the learning set to be around 80 % of the total data and the validation set to be the remaining 20 %. In this case, however, such a choice of validation set would cover only a small number of cases. Note that the parameters to be estimated in the nonparametric technique include the time window and bandwidth. Therefore, the validation should include only the proper selection of these parameters. Hav- ingLyears of data, our validation makes it possible to use an L-year validation set with an (L−1)-year learning set. Taking the kth year from the entire data set, the parameters are estimated with data omitting thekth year, and estimates for thekth year are then obtained using these parameters. The procedure is applied fork=1,…L, and thus these estimates for the entire data set are validated directly. A simplification working with the mean of annually varying parameters can be made because the variability of the L number time
windows and bandwidths is very small. The section below describing“Conditional probabilities and events of exceed- ing quantities”will show these validated results.
Test for statistically significant correlation
Significance levels for multiple correlations between the explaining variables and the indicator variables defined by events of exceeding/not exceeding quantile values (see be- low) were determined by a Monte-Carlo simulation experi- ment. First, patient number data were reordered randomly.
The original observed values were then replaced by these reordered data and the nonparametric regression technique performed. Finally, the multiple correlation obtained from this procedure was calculated. These steps were repeated 1,000 times, and the appropriate quantiles of the empirical probability distribution function of these 1,000 simulated correlations yielded the critical value for checking the null- hypothesis of being the multiple correlation zero.
Results
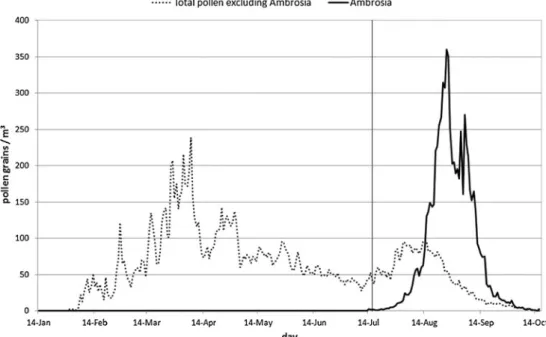
Although the total pollen excluding the pollen season ofAm- brosiacomprises several allergens, this separation permits the respiratory health effects of the two pollen variables to be studied separately as Ambrosiadominates the pollen counts during the main part of its pollen season (Fig.2).
Optimal time lags
The optimal time lags vary from 0 to 5 days. There is a tendency with increasing age for more non-zero lags. NO2
Fig. 2 Mean daily total pollen counts excludingAmbrosia pollen (14 January–14 July) and the mean daily pollen counts of Ambrosia(15 July–16 October), Szeged, 1999–2007
has the highest number of positive time shifts of all the air pollutants (typically 5 days for the pollen-free season and 5 days for the elderly in the pollination season excluding the pollen season ofAmbrosia, while it is generally 2 days for the remaining period and categories) followed by O3 and NO.
Among the chemical air pollutants, 0–3 days and 0–4 positive lags are associated with SO2and CO, respectively. At the same time, for PM10uniform 2-day time lags are typical. As regards the age groups, the time delay is longest for the elderly, and shortest for adults. For the two pollen variables, the optimal time lags are the same for both age groups, namely 2 and 5 days forAmbrosiapollen and the remaining pollen, respectively.
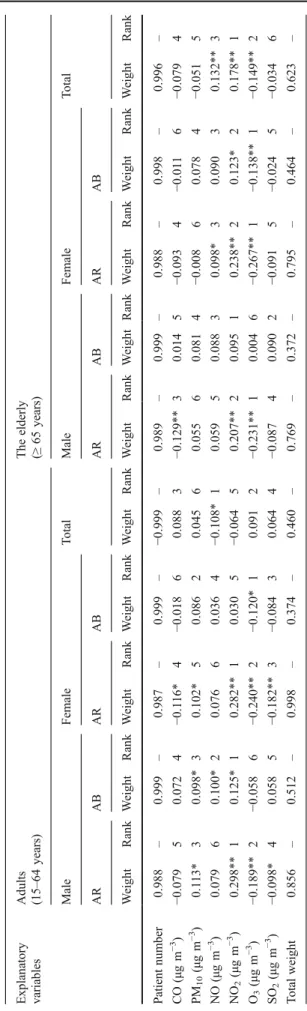
Factor analysis with special transformation andt-test After performing a factor analysis for adults and the elderly (for both categories male and female patients were consid- ered, diagnosed with AR and asthma) for the three seasons (altogether 2×2×2×3=24 factor analyses), five factors were retained for each category in the pollen season ofAmbrosia and in the pollen season of the total pollen excluding that of Ambrosia, respectively. At the same time, four factors were retained for each category in the pollen-free season. In order to calculate the rank of importance of the explanatory vari- ables for determining the resultant variable, loadings of the retained factors were projected onto Factor 1 for all 24 factor analyses with the special transformation (Tables3,4,5).
For the period 15 July–16 October, both diseases indicate substantially stronger pollutant-related associations for adults than for the elderly. For both age categories, AR shows stronger associations with the influencing variables than asthma. Furthermore, both adult male and adult female patients are practically equally endangered by chemical air pollutant-related asthma (Table3). For adult male and adult female subjects, both pollen variables are of key importance in influencing the prevalence of AR.Ambrosiapollen is the most important factor for both male and female asthmatic patients; however, the total pollen excludingAmbrosiapol- len has only a moderate-to-weak role. For the elderly, ozone (O3) is the most important variable in influencing respirato- ry hospital admissions with the exception of asthma among males (SO2), while the role of pollen variables decreased substantially (Table3). The total weight of the chemical and pollen variables was about the same for adult males and adult females with AR, while chemical pollutants represent- ed a higher total weight for asthma. Regarding elderly male and female patients with AR and asthma, chemical pollut- ants had a significantly higher total weight compared to that of the pollen variables (Table3). For all adults, the pollen variables were the most important factor influencing the number of respiratory hospital admissions, while for all the elderly, O3 had the highest weight, with the total pollen
excludingAmbrosiapollen as well asAmbrosiapollen were ranked 2 and 6, respectively. Both pollen variables were statistically significant for the two categories. As regards the chemical variables for all adults and all the elderly, O3, SO2, and PM10were the most relevant variables, while NO2
for adults and NO for the elderly were the least important pollutants (Table3).
For the period 17 October–13 January, the chemical air pollutants displayed stronger associations with AR and asth- ma in adults than in the elderly. Medical visits due to AR indicate a substantially stronger association with the chem- ical variables than visits due to asthma in each category (Table 4). For adult male and female AR subjects, NO2is the most important factor affecting respiratory admissions, while for adult females with asthma, O3 is the primary factor. Regarding elderly patients, NO2, O3and CO are the key factors for males with AR, while NO2and O3are key for females with AR, and O3 for females with asthma.
Besides this, based on the total weights, AR indicates the highest risk both for adult and elderly female patients (Table 4). The total weight of the explanatory variables is substantially higher for all elderly than for all adult patients.
For all adults, only NO is a relevant influencing variable.
While for all the elderly patients, NO2, O3 and NO (in decreasing order) are correlated significantly with the num- ber of respiratory admissions (Table4).
For the period 14 January–14 July, the prevalence of AR and asthma denoted notably stronger associations with the chemical and pollen variables for adults than for the elderly.
For both age groups, AR shows substantially stronger asso- ciations with both types of explanatory variables than does asthma. For adults of both sexes with AR, the CO level was the most important factor associated with hospital admis- sions, whereas with asthma it was NO concentration. In the case of the elderly, male and female patients with AR were influenced mostly by SO2. Asthma was strongly affected by the total pollen excluding Ambrosia in males while in fe- males it was influenced mostly by CO. With all patients during this period, the chemical variables had a substantially higher total weight for both age categories compared to that for the total pollen level excluding Ambrosia pollen. The weight of the pollen variable was ranked five for all adults and two for all the elderly. Note, that this influencing vari- able is relevant for both age categories. For all adults, the total weights of the explanatory variables were far higher than those for all the elderly. In the latter category, there were fewer significant associations among the explanatory variables and the number of respiratory diseases; further- more, the pollen variable has around half of the weight compared to the all adults category. The most relevant influencing variables, in decreasing order, were NO, SO2
and NO2 for all adults, while SO2, total pollen excluding Ambrosiapollen and NO for all the elderly (Table5).
Table3Effectofexplanatoryvariablesonrespiratorydiseasesasresultantvariables,andrankofimportanceofexplanatoryvariablesontheirfactorloadingstransformedtoFactor1todetermine theresultantvariable.Specialtransformation1:15July–16October.ARAllergicrhinitis,ABasthmabronchiale Explanatory variablesAdults (15–64years)Elderly (≥65years) MaleFemaleTotalMaleFemaleTotal ARABARABARABARAB WeightRankWeightRankWeightRankWeightRankWeightRankWeightRankWeightRankWeightRankWeightRankWeightRank Patient number−0.925–−0.997–−0.926–−0.998–−0.859–−0.967–0.998–−0.965–0.999–−0.980– CO (μgm−3 )0.144**5−0.02080.166**6−0.00680.04670.146**40.08520.09360.0705−0.0297 PM10 (μgm−3 )0.272**30.172**20.281**30.123*20.302**40.09360.03670.175**30.02180.140**4 NO (μgm−3)0.0688−0.05370.0877−0.01770.08060.06670.0755−0.00880.0854−0.0198 NO2 (μgm−3)−0.0977−0.0636−0.0858−0.113*40.0288−0.113*50.0784−0.143**40.126*2−0.111*5 O3 (μgm−3)0.262**40.08050.265**40.122*30.117*50.310**1−0.04660.369**1−0.136**10.265**1 SO2 (μgm−3 )0.136**60.09130.194**50.09450.354**30.0098−0.101*10.0707−0.09530.187**3 Total weight0.979–0.479–1.078–0.475–0.927–0.738–0.422–0.858–0.533–0.751– Ambrosia pollen (pollen m−3 day−1 )
−0.524**1−0.227**1−0.490**2−0.2651−0.729**1−0.170**30.0793−0.09750.0317−0.1046 Total pollen excluding Ambrosia pollen (pollen m−3 day−1)
−0.485**2−0.0814−0.498**1−0.0736−0.546**2−0.224**2−0.0238−0.175**2−0.0686−0.1902 Total weight1.008–0.309–0.988–0.338–1.275–0.394–0.103–0.271–0.100–0.294– *x0.05=0.101;**x0.01=0.133(thresholdsofsignificance)
Regarding the 6–8 explanatory variables that depend on the three periods under the three quantiles, two age groups, two categories of sex and two categories of types of diseases, altogether 504t-tests were performed to check whether the averages of two data groups of an explanatory variable differ sigificantly. Elements of these groups were defined according to whether the actual daily patient numbers are below or above their quantile value. The results showed that 21.1 %, 12.1 % and 6.2 % of average pairs differed significantly at 10 %, 5 % and 1 % levels, respectively, i.e. 21.1 % of all avearge pairs differed significantly at least at the 10 % level. The fewest (1.8 %) statistically significant different averages (at 5 % level) were in the pollen season of the total pollen excludingAmbro- sia, and the other two periods gave almost the same percentage values.
Conditional probabilities and events of exceeding quantiles The time windowband the bandwidthhvary from 7 to 39 days and from 1.1 to 5.1, respectively, depending on the quantiles and periods within the year. The pollination season ofAmbro- siahad the smallestbandh, while the season of the remaining pollen had the largest.
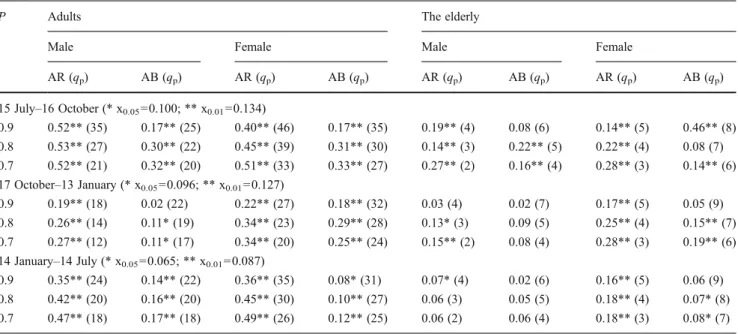
Table6summarises the multiple correlations between the explanatory variables and the indicator variables defined by events of exceeding/not exceeding theP-quantile values qp. The strongest relationships between extreme patient numbers and pollutants were observed during the pollination season of Ambrosia, while the pollen-free period exhibited the lowest correlations. Another important finding is that the elderly group is characterised by weaker relationships between ex- treme patient numbers and pollutants.
Estimates of the quantile exceedance probabilities condi- tioned on the explanatory variables made it possible to create a decision of whether the patient number exceeds a quantile under an individual formation of the explanatory variables.
Namely, when the estimated probability is higher (lower) than 1−p, the answer is yes (no) for the exceedance of thep-quantile qp. Such a decision is called correct when the decision on the event of exceeding—not exceeding the quantile value is iden- tical to the observed exceeding—not exceeding event. Table7 shows the ratios of the number of correct decisions to the number of decisions of these events forp=0.9, 0.8 and 0.7.
The lowest ratios were observed for the pollen-free season, while those for the two pollination seasons were quite similar.
Again, the weakest results appeared for the elderly group, while the best ratios of the correct decisions were seen for adults (partly, with the exception of the pollen-free season).
Note that percentage values of correct decisions are signifi- cantly higher for exceedance events than for events of no exceedance. The exceedance events are thus overrated, which is, however, a smaller problem than the reverse case of overrating the events of no exceedance.
Table4Effectofexplanatoryvariablesonrespiratorydiseasesasresultantvariables,andrankofimportanceofexplanatoryvariablesontheirfactorloadingstransformedtoFactor1todetermine theresultantvariable.Specialtransformation2:17October–13January Explanatory variablesAdults (15–64years)Theelderly (≥65years) MaleFemaleTotalMaleFemaleTotal ARABARABARABARAB WeightRankWeightRankWeightRankWeightRankWeightRankWeightRankWeightRankWeightRankWeightRankWeightRank Patientnumber0.988–0.999–0.987–0.999–−0.999–0.989–0.999–0.988–0.998–0.996– CO(μgm−3 )−0.07950.0724−0.116*4−0.01860.0883−0.129**30.0145−0.0934−0.0116−0.0794 PM10(μgm−3 )0.113*30.098*30.102*50.08620.04560.05560.0814−0.00860.0784−0.0515 NO(μgm−3 )0.07960.100*20.07660.0364−0.108*10.05950.08830.098*30.09030.132**3 NO2(μgm−3 )0.298**10.125*10.282**10.0305−0.06450.207**20.09510.238**20.123*20.178**1 O3(μgm−3)−0.189**2−0.0586−0.240**2−0.120*10.0912−0.231**10.0046−0.267**1−0.138**1−0.149**2 SO2(μgm−3)−0.098*40.0585−0.182**3−0.08430.0644−0.08740.0902−0.0915−0.0245−0.0346 Totalweight0.856–0.512–0.998–0.374–0.460–0.769–0.372–0.795–0.464–0.623– *x0.05=0.096;**x0.01=0.125(thresholdsofsignificance)
Table5Effectofexplanatoryvariablesonrespiratorydiseasesasresultantvariables,andrankofimportanceofexplanatoryvariablesontheirfactorloadingstransformedtoFactor1todetermine theresultantvariable.Specialtransformation3:14January–14July Explanatory variablesAdults (15–64years)Elderly (≥65years) MaleFemaleTotalMaleFemaleTotal ARABARABARABARAB WeightRankWeightRankWeightRankWeightRankWeightRankWeightRankWeightRankWeightRankWeightRankWeightRank Patient number−0.996–−0.995–−0.997–−0.993–−0.936–−1.000–−0.999–−1.000–0.997–−0.984– CO(μgm−3 )0.382**10.02670.358**1−0.02170.224**60.149**3−0.04020.125**20.079*1−0.0086 PM10 (μgm−3 )0.263**40.06050.248**40.02360.262**40.141**40.00660.089**40.01870.0374 NO(μgm−3 )0.368**20.145**10.321**30.132**10.473**10.153**20.00170.108**3−0.04440.105**3 NO2(μgm−3 )0.162**60.113**20.137**60.05950.290**30.069*50.03330.0506−0.02960.0125 O3(μgm−3 )−0.202**50.0296−0.167**50.108**40.0367−0.064*60.0165−0.0417−0.0633−0.0047 SO2(μgm−3 )0.339**30.104**30.339**20.108**30.303**20.163**10.02340.215**10.03150.235**1 Totalweight1.716–0.478–1.570–0.452–1.588–0.739–0.120–0.628–0.264–0.401– Totalpollen excluding Ambrosia pollen (pollen- m−3 ·day−1 )
−0.134**7−0.101**4−0.1037−0.124**2−0.241**5−0.0507−0.071*1−0.06050.078*2−0.135**2 Totalweight0.134–0.101–0.103–0.124–0.241–0.050–0.071–0.060–0.078–0.135– *x0.05=0.064;**x0.01=0.084(thresholdsofsignificance)
Discussion
Analysis of hospital admissions due to chronic respiratory diseases associated with air pollutant concentrations is a very important issue in public health. The present study analysed one of the largest databases in the field. Our study can be considered specific in the sense that it simultaneously
includes two age categories, gender, as well as AR and asthma as resultant variables, along with two categories of influencing variables with six chemical and two biological (pollen) parameters; all these associations were examined for three seasons. Besides the research team of Makra et al.
(2012), we know of no study that describes such a compre- hensive analysis in the field or applies these statistical Table 6 Multiple correlation between the explanatory variables and the indicator variable defined by the events of exceeding/not exceeding theP- quantile valueqpfor the three periods examined
P Adults The elderly
Male Female Male Female
AR (qp) AB (qp) AR (qp) AB (qp) AR (qp) AB (qp) AR (qp) AB (qp) 15 July–16 October (* x0.05=0.100; ** x0.01=0.134)
0.9 0.52** (35) 0.17** (25) 0.40** (46) 0.17** (35) 0.19** (4) 0.08 (6) 0.14** (5) 0.46** (8) 0.8 0.53** (27) 0.30** (22) 0.45** (39) 0.31** (30) 0.14** (3) 0.22** (5) 0.22** (4) 0.08 (7) 0.7 0.52** (21) 0.32** (20) 0.51** (33) 0.33** (27) 0.27** (2) 0.16** (4) 0.28** (3) 0.14** (6) 17 October–13 January (* x0.05=0.096; ** x0.01=0.127)
0.9 0.19** (18) 0.02 (22) 0.22** (27) 0.18** (32) 0.03 (4) 0.02 (7) 0.17** (5) 0.05 (9) 0.8 0.26** (14) 0.11* (19) 0.34** (23) 0.29** (28) 0.13* (3) 0.09 (5) 0.25** (4) 0.15** (7) 0.7 0.27** (12) 0.11* (17) 0.34** (20) 0.25** (24) 0.15** (2) 0.08 (4) 0.28** (3) 0.19** (6) 14 January–14 July (* x0.05=0.065; ** x0.01=0.087)
0.9 0.35** (24) 0.14** (22) 0.36** (35) 0.08* (31) 0.07* (4) 0.02 (6) 0.16** (5) 0.06 (9) 0.8 0.42** (20) 0.16** (20) 0.45** (30) 0.10** (27) 0.06 (3) 0.05 (5) 0.18** (4) 0.07* (8) 0.7 0.47** (18) 0.17** (18) 0.49** (26) 0.12** (25) 0.06 (2) 0.06 (4) 0.18** (3) 0.08* (7)
* x0.05; ** x0.01(thresholds of significance)
Table 7 Ratio (%) of the number of correct decisions for events 0 and 1 to the number of observed events 0 and 1 for the three periods examined.
Events 1 and 0 refer to the case when the number of patients exceeds and does not exceed thep-quantile value of the patients’number, respectively
p Adults The elderly
Male Female Male Female
AR AB AR AB AR AB AR AB
0 1 0 1 0 1 0 1 0 1 0 1 0 1 0 1
15 July–16 October
0.9 81.5 80.0a 64.6 73.5a 67.7 85.7a 65.9 66.7a 78.2 54.5a 85.6 19.0a 59.5 54.3a 82.2 29.6a 0.8 71.0 82.6a 65.8 68.2a 62.8 88.9a 63.0 71.2a 97.0a 7.0 82.6 50.0a 73.8 52.4a 98.5a 4.1 0.7 68.8 78.2a 71.1 57.6a 68.4 79.4a 63.5 65.5a 84.2a 38.0a 81.7a 27.2 74.8a 54.1a 98.3a 1.3 17 October–13 January
0.9 68.1 54.1a 80.0 30.0a 65.3 62.5a 74.9 48.5a 83.8 12.0a 89.6 25.0a 75.4 51.7a 81.0 30.0a 0.8 60.9 64.9a 57.0 60.3a 62.8 69.6a 71.0 60.0a 76.2 38.8a 62.5 45.2a 86.1a 32.7a 48.7 65.8a 0.7 64.4 57.0a 59.6 47.8a 58.2 72.7a 56.2 60.2a 71.3a 39.1a 49.7 61.5a 68.8 56.0a 48.7 69.7a 14 January–14 July
0.9 65.5 87.8a 63.1 56.3a 62.9 89.2a 63.1 47.8a 98.4a 0.0 95.8a 6.6 71.1 48.5a 92.1a 13.5a 0.8 64.7 81.9a 75.5 40.9a 62.6 86.2a 71.7 37.4a 100.0a 0.0 100.0a 0.0 94.4a 13.0 60.8 40.8a 0.7 68.1 81.4a 83.8a 25.5a 70.2a 76.8a 91.5a 17.0 100.0a 0.0 94.6a 5.4 88.7a 36.4a 60.1 42.3a
aValues higher than the reference percentage values defined in the article