ACTA CLIMATOLOGICA ET CHOROLOGICA Universitatis Szegediensis, Tomus 46, 2012, 73-81
ASSOCIATION BETWEEN EXTREME DAILY POLLEN CONCENTRATIONS FOR SZEGED, HUNGARY AND PREVIOUS-DAY METEOROLOGICAL
ELEMENTS
Z CSÉPE1, I MATYASOVSZKY2, L MAKRA1 and Z SÜMEGHY1
1Department of Climatology and Landscape Ecology, University of Szeged, P.O.Box 653, 6701 Szeged, Hungary E-mail: csepe.zoltan@gmail.com
2Department of Meteorology, Eötvös Loránd University, Pázmány Péter Street 1/A, 1117 Budapest, Hungary
Summary: The aim of this paper is to analyse how meteorological elements relate to extreme Ambrosia pollen load on the one hand and to extreme total pollen load excluding Ambrosia pollen on the other for Szeged, Southern Hungary. The data set comes from a 9-year period (1999-2007) and includes previous-day means of five meteorological variables and actual-day values of the two pollen variables. Factor analysis with special transformation was performed on the meteorological and pollen load data in order to find out the strength and direction of the association of the meteorological and pollen variables. Then, using selected low and high quantiles corresponding to probability distributions of Ambrosia pollen and the remaining pollen loads, the quantile and beyond-quantile averages of pollen loads were compared and evaluated. Finally, a nearest neighbour (NN) technique was applied to discriminate between extreme and non-extreme pollen events using meteorological elements as explaining variables. Using a nearest neighbour technique, explaining variables in decreasing order of their influence on Ambrosia pollen load are temperature, global solar flux, relative humidity, air pressure and wind speed, while on the load of the remaining pollen are temperature, relative humidity, global solar flux, air pressure and wind speed.
Key words: Ambrosia, extreme daily pollen load, meteorological elements, factor analysis including special transformation, t-test, nearest neighbour technique
1. INTRODUCTION
The connection of meteorological elements with pollen concentrations is widely studied in the literature. Finding a statistically significant association between daily pollen levels and daily meteorological elements is of great practical importance. These kinds of examinations concern all pollen types and include correlation analyses (Celenk et al. 2009, Kasprzyk and Walanus 2010), forecasting characteristics of the pollen season (García- Mozo et al. 2009, Kasprzyk 2009) and pollen concentration using regression models (Makra et al. 2004, Ocana-Peinado et al. 2008), neural and neuro-fuzzy models (Aznarte et al. 2007) or multivariate statistical methods (Makra et al. 2006, Hart et al. 2007).
However, the role of the values of meteorological elements in the occurrence of extreme daily pollen concentrations has received little attention so far. Frei (2004, 2006) studied the occurrences of extreme events (storms, floods or droughts) with extreme birch and grass pollen concentrations on the data set of Basel. The heat wave over Europe in summer 2003 with mean temperature exceeding the 1961-1990 mean by about 5°C in June, July and August substantially influenced pollen phenology and pollen production in
Switzerland (Gehrig 2006). The grass pollen season was most affected starting 1-2 weeks earlier and ending 7-33 days earlier than in general. Extremely high Chenopodium, Plantago and Poaceae daily pollen concentrations were measured in this pollen season.
Cariňanos et al. (2000) analyzed the yearly distribution and severity of Artemisia and Chenopodiaceae-Amaranthaceae pollen load, indicating the highest and very high pollen levels in a rural area with sub-desert climate and extreme dryness.
Due to the worldwide increasing trend and ever increasing frequency of extremely high temperatures the start of flowering occurs several days earlier, furthermore a trend towards higher annual pollen quantities and an increase of the highest daily mean pollen concentrations can also be observed (Frei 2008, Frei and Gassner 2008). The recent climate change, global warming, may facilitate the extension of the habitat region of herbaceous and arboreal plants contributing to the increase of pollen levels and an exacerbation of their adverse effects, hence to the rise of pollen sensitivity and respiratory admissions due to a pollen allergy.
The purpose of this paper is to analyse how meteorological elements relate to extreme Ambrosia pollen load on one hand and to extreme total pollen load excluding Ambrosia pollen on the other. For this aim, a factor analysis with special transformation was performed on the meteorological and pollen load data in order to find out the strength and direction of the association of the meteorological and pollen variables. Then, using selected low and high quantiles corresponding to probability distributions of Ambrosia pollen and the remaining pollen loads the quantile and beyond-quantile averages of pollen loads were compared and evaluated. Finally, a nearest neighbour (NN) technique was applied to discriminate between extreme and non-extreme pollen events using meteorological elements as explaining variables.
2. MATERIALS AND METHODS
2.1. Location and data
Szeged (46.25°N; 20.10°E), the largest settlement in South-eastern Hungary is located at the confluence of the rivers Tisza and Maros (Fig. 1). The area is characterised by an extensive flat landscape of the Great Hungarian Plain with an elevation of 79 m AMSL. The city is the centre of the Szeged region with 203,000 inhabitants. The climate of Szeged belongs to Köppen’s Ca type (warm temperate climate) with relatively mild and short winters and hot summers (Köppen 1931). The pollen content of the air was measured using a 7-day recording “Hirst-type” volumetric trap (Hirst 1952). The air sampler is located on top of the building of the Faculty of Arts at the University of Szeged some 20 m above the ground surface (Fig. 1) (Makra et al. 2008).
In order to determine the association between meteorological variables on one hand and Ambrosia pollen load as well as the total pollen load excluding Ambrosia pollen on the other, previous-day values of five meteorological variables (mean temperature, mean global solar flux, mean relative humidity, mean sea-level pressure and mean wind speed) and actual-day values of the two pollen variables were considered. A slight refinement of the methodology could involve not only previous-day meteorological variables as influencing variables but their two (or more) days earlier values as well. However, it was found that
earlier-days meteorological parameters deliver negligible further information on the actual- day pollen concentration (Makra and Matyasovszky 2011).
Fig. 1 Location of Europe including Hungary (upper panel) and the urban web of Szeged with the positions of the data sources (lower panel). 1: meteorological station; 2: aerobiological station.
The distance between the aerobiological and the meteorological station is 2 km.
Meteorological data were collected in the monitoring station (operated by the Environmental and Natural Protection and Water Conservancy Inspectorate of Lower-Tisza Region, Szeged) located in the downtown of Szeged at a distance of about 10 m from the busiest main road.
Besides the pollen of Ambrosia (ragweed), the pollen production of 23 other relevant taxa are taken into account. The taxa considered, with their Latin (English) names are as follows: Acer (maple), Alnus (alder), Artemisia (mugwort), Betula (birch), Cannabis (hemp), Carpinus (hornbeam), Chenopodiaceae (goosefoots), Corylus (hazel), Fraxinus (ash), Juglans (walnut), Morus (mulberry), Pinus (pine), Plantago (plantain), Platanus (plane), Poaceae (grasses), Populus (poplar), Quercus (oak), Rumex (dock), Salix (willow), Taxus (yew), Tilia (linden), Ulmus (elm) and Urtica (nettle).
The analysis was performed for the nine-year period 1999-2007 with two data sets according to the pollen season of Ambrosia (ragweed) (July 15 – October 16) and the pollen season of remaining pollen excluding that of Ambrosia (January 14 – October 16).
The pollen season is defined by its start and end dates. For the start (end) of the season we used the first (last) date on which 1 pollen grain m-3 of air is recorded and at least
5 consecutive (preceding) days also show 1 or more pollen grains m-3 (Galán et al. 2001).
The pollen season varies from year to year; here the longest observed pollen season during the nine-year period was considered for each year.
Note that we define pollen load as a number indicating to what extent the body is endangered by the pollens. When calculating pollen load, the allergenic effects of all actually blooming herbaceous and arboreal plants are considered. According to the degree of allergenicity pollen types can be sorted into four categories: 1) weakly, 2) moderately, 3) intensely and 4) severely allergenic pollen types. For example, the allergenicity of Ambrosia is severe indicated by the scale value 4, while that of Juglans is weak denoted by the value 1. Hence, pollen load is the sum of the pollen concentrations multiplied by their degrees of allergenicity (www.pollenindex.hu/).
2.2. Methods
2.2.1. Factor analysis with special transformation
Factor analysis identifies linear relationships among subsets of examined variables and this helps to reduce the dimensionality of the initial database without substantial loss of information. First, a factor analysis was applied to the initial dataset consisting of 5 meteorological parameters as explaining variables on one hand and Ambrosia pollen load and that of the remaining pollen on the other. The procedure was performed for the two pollen variables as resultant variables separately in order to transform the original variables to fewer variables. These new variables (called factors) can be viewed as latent variables explaining the joint behaviour of weather-pollen variables. The optimum number of retained factors is determined by different statistical criteria (Jolliffe 1993). The most common and widely accepted method is to specify a least percentage (80%) of the total variance in the original variables that has to be achieved (Liu 2009). After performing the factor analysis, a special transformation of the retained factors was made to discover to what degree the above-mentioned explaining variables affect the resultant variable, and to give a rank and sign of their influence (Jahn and Vahle 1968).
2.2.2. t-test
Quantiles corresponding to probabilities 10%, 20% and 30%, furthermore 90%, 80%
and 70% were determined first. Note that a p-quantile (0<p<100%) qp is the value below which the pollen load occurs with relative frequency p. The pollen loads were then assigned to two categories according to whether the actual pollen load is below or not the actual quantile. Values of daily meteorological variables corresponding to the next-day pollen load below its quantiles 10%, 20% and 30% and above the quantiles 90%, 80% and 70%
were analysed. The t-test (Zimmerman 1997) was used to decide whether pollen category related means of each meteorological variable differ significantly under each quantile both for Ambrosia pollen and the remaining pollen.
2.2.3. Nearest neighbour (NN) technique
An NN technique was developed and applied in order to decide which of the two categories of the next-day pollen load occurs under actual values of the 5 meteorological variables. A nearest neighbour of the actual daily meteorological variables is identified with
the day where the explaining variables are the most similar to the actual explaining variables. Then the decision on the pollen load category for this case is the category being present on the selected day.
The procedure was used for every day available. The similarity is measured with the Euclidean distance defined with the standardised explaining variables. Standardization is necessary to ensure the same magnitude of each explaining variable and thus to ensure their equal importance. It was performed for every explaining variable separately by dividing the difference between the data and their mean by the standard deviation. Due to the annual trends in both the pollen loads and the meteorological variables a time window h was defined around each actual day and the nearest neighbours were searched within the time period defined by this window. Additionally, not only the unique nearest neighbour but the first k nearest neighbours were selected and the final decision on the category was defined as the majority decision of the k number individual decisions. Parameters h and k were determined from the first eight years (learning set) as to provide a best ratio of good decisions to all decisions, and the procedure was verified using the data of the last year.
3. RESULTS AND DISCUSSION
3.1. Factor analysis with special transformation and t-test
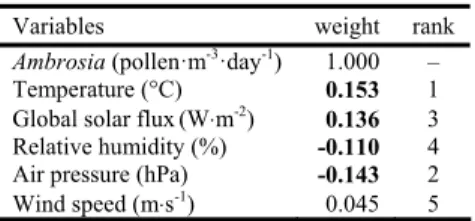
After performing a factor analysis (altogether 2 factor analyses), 4 factors were retained both for the pollen season of Ambrosia and the pollen season of remaining pollen excluding that of Ambrosia. In order to calculate the rank of importance of the explaining variables (meteorological parameters) in determining the resultant variable (pollen variables), loadings of the retained factors were projected onto Factor 1 (with a special transformation) (Tables 1a-b) (Jahn and Vahle 1968).
Table 1a Special transformation. Effect of the explanatory variables on Ambrosia pollen load and the rank of importance of the explanatory variables on their factor loadings transformed to Factor 1 for determining the resultant variable (thresholds of significance: italic: x0.05 = 0.068; bold: x0.01 = 0.090)
Variables weight rank
Ambrosia (pollen·m-3·day-1) 1.000 – Temperature (°C) 0.153 1 Global solar flux(W⋅m-2) 0.136 3 Relative humidity (%) -0.110 4 Air pressure (hPa) -0.143 2
Wind speed (m⋅s-1) 0.045 5
It is found that except for wind speed, the remaining four meteorological variables display significant associations with the Ambrosia pollen load. Temperature and global solar flux show proportional, while air pressure and relative humidity inversely proportional associations with Ambrosia pollen loads. Explaining variables in decreasing order of their influence on Ambrosia pollen load are temperature, air pressure, global solar flux, relative humidity and wind speed (Table 1a).
The remaining pollen load excluding that of Ambrosia shows notable association with all five meteorological variables (Table 1b). The signs of the connections between the
meteorological parameters and the remaining pollen are the same as they are between the meteorological parameters and the Ambrosia pollen (Tables 1a-b). The meteorological variables thus affect the two pollen variables similarly despite the different pollen seasons.
Explaining variables in decreasing order of their influence are relative humidity, global solar flux, temperature, wind speed and air pressure. The importance of the individual meteorological parameters based on their factor loadings differ in determining the two pollen variables due to their different phenological characteristics including different length of pollen seasons and different climate requirements (Tables 1a-b).
Table 1b Special transformation. Effect of the explanatory variables on total pollen load excluding Ambrosia pollen and the rank of importance of the explanatory variables on their factor loadings
transformed to Factor 1 for determining the resultant variable(thresholds of significance:
italic: x0.05 = 0.041; bold: x0.01 = 0.054)
Variables weight rank
Total pollen excluding Ambrosia (pollen·m-3·day-1) 1.000 –
Temperature (°C) 0.188 3
Global solar flux(W⋅m-2) 0.237 2
Relative humidity (%) -0.276 1
Air pressure (hPa) -0.068 5
Wind speed (m⋅s-1) 0.121 4
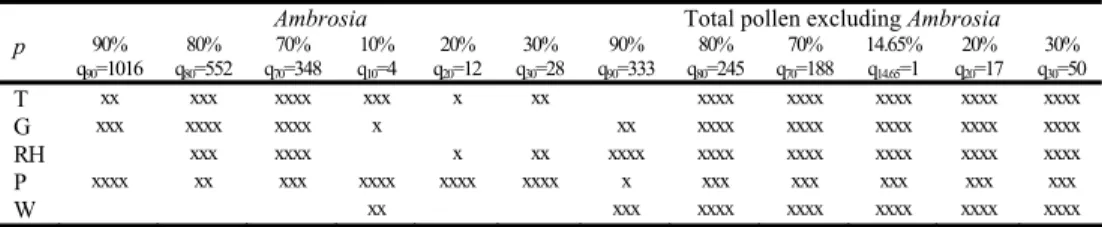
Table 2 Significance levels for differences between means of meteorological variables corresponding to below and above the p quantiles of pollen loads. Symbols x, xx, xxx and xxxx refer to the 10%, 5%, 1% and 0.1% probability levels, respectively. T - temperature, G - global solar flux, RH - relative
humidity, P - air pressure, W - wind speed
Ambrosia Total pollen excluding Ambrosia
p 90%
q90=1016 80%
q80=552 70%
q70=348 10%
q10=4 20%
q20=12 30%
q30=28 90%
q90=333 80%
q80=245 70%
q70=188 14.65%
q14.65=1 20%
q20=17 30%
q30=50 T xx xxx xxxx xxx x xx xxxx xxxx xxxx xxxx xxxx G xxx xxxx xxxx x xx xxxx xxxx xxxx xxxx xxxx RH xxx xxxx x xx xxxx xxxx xxxx xxxx xxxx xxxx P xxxx xx xxx xxxx xxxx xxxx x xxx xxx xxx xxx xxx W xx xxx xxxx xxxx xxxx xxxx xxxx
The t-test shows rather significant differences between the means of meteorological variables corresponding to below and above the quantiles of pollen loads excluding Ambrosia (Table 2) potentially due to the annual trends in both the meteorological elements and the pollen load. Here 14.65% is used instead of 10% as the relative frequency of zero loads is 14.65%. However, similar differences are less significant for the load of Ambrosia pollen mainly for wind speed and partially for low quantiles (Table 2). This may partly be due to the fact that annual trends are not so characteristic during the relatively short pollen season of Ambrosia. One may suspect, therefore, that these highly significant differences are found only due to the annual cycles inherent in both the meteorological variables and pollen concentrations.
3.2. NN technique
In order to clarify whether the 5 meteorological elements as explaining variables are informative to discriminate between extreme and non-extreme pollen events an NN technique outlined in Section 2.2.3 was applied. The optimal time window h is 3 days and 5
days for Ambrosia pollen load and total pollen load excluding Ambrosia pollen, respectively. The choice of such a small window for Ambrosia pollen is reasonable because the pollen load varies in a very wide range (from 0 to 5540 in the 8 years) during a relatively short pollen season. In contrast, the load of the remaining pollen varies in a narrower range (from 0 to 3020 in the 8 years) during a three times longer period. The optimal number k of nearest neighbours is 7 for Ambrosia pollen and 5 for the remaining of pollen, respectively. The larger value of k for Ambrosia seems to balance the narrower time window. Values of h and k were determined as to minimise the number of false decisions only for events exceeding or not exceeding the quantiles corresponding to pM =max{p,1–p} or pm =min{p,1 –p}, respectively, as there is a tendency to underestimate these events and overestimate the complementary events.
Table 3 Contingency table for above and below the quantiles of Ambrosia pollen load.
Values in rows/columns include the observed/estimated number of cases.
Quantile
Set 80% 70% 20% 30%
Learning Above Below Above Below Above Below Above Below
Above 112 33 189 28 570 34 495 27
Below 42 543 38 475 35 91 35 173
Verification Above Below Above Below Above Below Above Below
Above 14 5 24 4 74 4 64 3
Below 5 70 5 61 5 11 5 22
Table 4 Contingency table for above and below the quantiles of the total pollen load except for Ambrosia pollen. Values in rows/columns include the observed/estimated number of cases.
Quantile
Set 80% 70% 20% 30%
Learning Above Below Above Below Above Below Above Below
Above 216 181 408 190 1528 75 1345 56
Below 193 1412 178 1226 61 338 78 523
Verification Above Below Above Below Above Below Above Below
Above 26 22 49 23 184 8 161 7
Below 22 170 22 146 8 40 9 63
Tables 3 and 4 compare the observed below or above quantile events to events obtained from NN decisions. Quantiles p=10% and 90% are not included here because the number of events exceeding the quantile of 90% and not exceeding that of 10% is strongly underestimated even with the optimal time window and the number of nearest neighbours.
The percentage of good decisions is slightly over 30% for this case, while the similar percentage for complementary events (not exceeding the quantile of 90% and exceeding that of 10%) is around 97-99%. The procedure, however, works quite well for quantiles of 20% and 80%, and even better for those of 30% and 70%. The question is whether pollen loads corresponding to their quantiles of 20-30% and 70-80% can be labelled extremes. The answer is yes when taking into account the clinical threshold of pollen load. Specifically, the clinical threshold for Ambrosia pollen concentration is 30 pollen grains m-3 in Hungary (Makra et al. 2005) corresponding to a pollen load of 120 considering its severe allergenicity, but for other countries this threshold is only 10 or even just a mere 5 pollen grains m-3 (Banken and Comtois 1992) corresponding to pollen loads of 40 and 20, respectively. Thus, the quantiles of 30% (see Table 2) are around the clinical thresholds of
pollen loads and characterise a lower limit of the pollen load that would be be critical for sensitive people. In contrast, the quantiles of 80% accompanied with pollen loads 552 and 245 for Ambrosia and the remaining of pollen (Table 2) respectively are well above the clinical threshold of pollen load and hence these values indicate serious adverse effects for those being sensitive to respiratory ailments.
The relative frequency of the number of decisions for exceeding the quantiles of 80%, 70%, 20% and 30% is 21.1%, 31.1%, 82.2% and 72.6% respectively in the learning set, and 20.2%, 30.1%, 84% and 73.4% respectively in the test set for Ambrosia. Similar relative frequencies for the remaining pollen are 20.4%, 29.3%, 79.4% and 71.1% for the learning set and 20.4%, 29.6%, 80.0% and 70.8% for the test set, respectively. These numbers show that the NN procedure avoids substantial under- or overestimation of event frequencies defined by the above quantiles. For the test set, the relative frequency of good decisions for exceeding the quantiles of 80%, 70%, 20%, 30% is 73.7%, 85.7%, 94.9% and 95.5%, while for not exceeding these quantiles is 93.3%, 92.4%, 68.8% and 81.5% for Ambrosia. Similar values for total pollen excluding Ambrosia are 64.2%, 68.1%, 95.8% and 95.8%, as well as 88.5%, 86.9%, 83.3% and 87.5%. These percentages show that the five meteorological elements as explaining variables are informative to discriminate between extreme and non-extreme pollen events.
Explaining variables in decreasing order of their influence on Ambrosia pollen load are temperature, global solar flux, relative humidity, air pressure and wind speed, while on the load of the remaining pollen these are temperature, relative humidity, global solar flux, air pressure and wind speed. These orders were determined with the help of the numbers of good decisions for events of exceeding or not exceeding the quantiles corresponding to pM or pm when neglecting different explaining variables from all of the five variables. Note that the rank of importance of the meteorological elements determining the two pollen variables partly differ from the above orders when using factor analysis with special transformation. Its reason is that factor analysis explores linear relationships among variables coming from two sources. Namely, the relationship between two variables is partly due to the similarity (or dissimilarity) of their annual cycles but partly due to the correlation between variations around these annual cycles. Hence, factor analysis shows an overall picture, while the NN technique reflects the relationship between the daily variations of explaining variables and pollen loads excluding the annual cycles when using time windows. Additionally, the application of the NN procedure allows a non-linear relationship between explaining variables and pollen loads.
Acknowledgements: The authors would like to thank Miklós Juhász for providing pollen data of Szeged. The European Union and the European Social Fund provided financial support for the project under the grant agreement nos. TAMOP 4.2.1/B-09/1/KMR-2010-0003, TAMOP-4.2.1/B-09/1/KONV-2010-0005 and TAMOP- 4.2.2/B-10/1-2010-0012).
REFERENCES
Aznarte L, Sánchez JMB, Lugilde DN, Fernández CDL, de la Guardia CD, Sánchez FA (2007) Forecasting airborne pollen concentration time series with neural and neuro-fuzzy models. Expert Syst Appl 32:1218-1225
Banken R, Comtois P (1992) Concentration du pollen de l’herbe á poux et prévalence de la rhinite allergique dans deux municipalités des Laurentides. Allergie et Immunologie 24:91-94
Cariňanos P, Galán C, Alcázar P, Domínguez E (2000) Allergenic pollen in the subdesert areas of the Iberian peninsula. J Invest Allerg Clin 10:242-247
Celenk S, Canitez Y, Bicakci A, Sapan N, Malyer H (2009) An aerobiological study on pollen grains in the atmosphere of North-West Turkey. Environ Monit Assess 158:365-380
Frei T (2004) Frequency of extreme events with airborne pollen. Allergologie 27:1-10 Frei T (2006) Extreme events concerning airborne pollen. Allergologie 29:349-353
Frei T (2008) Climate change and its impact on airborne pollen in Basel, Switzerland 1969-2007. Allergologie 31:165-169
Frei T, Gassner E (2008) Climate change and its impact on birch pollen quantities and the start of the pollen season an example from Switzerland for the period 1969-2006. Int J Biometeorol 52:667-674 Galán C, Cariňanos P, García-Mozo H, Alcázar P, Domínguez-Vilches E (2001) Model for forecasting Olea
europaea L. airborne pollen in South-West Andalusia, Spain. Int J Biometeorol 45:59-63 García-Mozo H, Galán C, Belmonte J, Bermejo D, Candau P, de la Guardia CD, Elvira B, Gutiérrez M, Jato .,
Silva I, Trigo MM, Valencia R, Chuin I (2009) Predicting the start and peak dates of the Poaceae pollen season in Spain using process-based models. Agr Forest Meteorol 149:256-262
Gehrig R (2006) The influence of the hot and dry summer 2003 on the pollen season in Switzerland. Aerobiologia 22:27-34
Hart MA, de Dear R, Beggs PJ (2007) A synoptic climatology of pollen concentrations during the six warmest months in Sydney, Australia. Int J Biometeorol 51:209-220
Hirst JM (1952) An automatic volumetric spore trap. Ann Appl Biol 39:257-265
Jahn W, Vahle H (1968) Die Faktoranalyse und ihre Anwendung. Verlag die Wirtschaft, Berlin
Jolliffe IT (1993) Principal component analysis: A beginner’s guide – II. Pitfalls, myths and extensions. Weather 48:246-253
Kasprzyk I (2009) Forecasting the start of Quercus pollen season using several methods - the evaluation of their efficiency. Int J Biometeorol 53:345-353
Kasprzyk I, Walanus A (2010) Description of the main Poaceae pollen season using bi-Gaussian curves, and forecasting methods for the start and peak dates for this type of season in Rzeszow and Ostrowiec Sw.
(SE Poland). J Environ Monitor 12:906-916
Köppen W (1931) Grundriss Der Klimakunde. Walter De Gruyter & Co, Berlin
Liu PWG (2009) Simulation of the daily average PM10 concentrations at Ta-Liao with Box-Jenkins time series models and multivariate analysis. Atmos Environ 43:2104-2113
Makra L, Matyasovszky I (2011) Assessment of the Daily Ragweed Pollen Concentration with Previous-Day Meteorological Variables Using Regression and Quantile Regression Analysis for Szeged, Hungary.
Aerobiologia 27:247-259
Makra L, Juhász M, Borsos E, Béczi R (2004) Meteorological variables connected with airborne ragweed pollen in Southern Hungary. Int J Biometeorol 49:37-47
Makra L, Juhász M, Béczi R, Borsos E (2005) The history and impacts of airborne Ambrosia (Asteraceae) pollen in Hungary. Grana 44:57-64
Makra L, Juhász M, Mika J, Bartzokas A, Béczi R, Sümeghy Z (2006) An objective classification system of air mass types for Szeged, Hungary with special attention to plant pollen levels. Int J Biometeorol 50:403- 421
Makra L, Tombácz S, Bálint B, Sümeghy Z, Sánta T, Hirsch T (2008) Influences of meteorological parameters and biological and chemical air pollutants to the incidence of asthma and rhinitis. Clim Res 37:99-119 Ocana-Peinado F, Valderrama MJ, Aguilera AM (2008) A dynamic regression model for air pollen concentration.
Stoch Env Res Risk A 22:S59-S63
Zimmerman DW (1997) A note on interpretation of the paired-samples t test. J Educ Behav Stat 22:349-360 www.pollenindex.hu/