Universitatis Szegediensis, Tomus 46, 2012, 83-105
CLIMATE SENSITIVITY ANALYSIS OF ALLERGENIC TAXA IN CENTRAL EUROPE WITH NEW ECOLOGICAL INDICATORS
JÁ DEÁK1, L MAKRA2, I MATYASOVSZKY3, Z CSÉPE2 and B MULADI1
1Department of Physical Geography and Geoinformatics, University of Szeged, P.O.Box 653, 6701 Szeged, Hungary E-mail: aron@geo.u-szeged.hu
2Department of Climatology and Landscape Ecology, University of Szeged, P.O.Box 653, 6701 Szeged, Hungary
3Department of Meteorology, Eötvös Loránd University, Pázmány Péter Street 1/A, 1117 Budapest, Hungary
Summary: The aim of the study is to analyse trends of the pollination season with its duration, start and end dates, as well as trends of the annual total pollen count and annual peak pollen concentration for the Szeged agglomeration in Southern Hungary. The data set covers an 11-year period (1997-2007) including 19 taxa and seven daily climate variables. Trend analysis is performed on both annual and daily bases. Trend analysis on daily bases is a new approach providing information on the annual cycles of trends. For quantifying the strength of the relationship between the annual cycle of the slope of daily trends of the pollen concentrations and the annual cycles of slopes of daily trends of the climate variables an association measure and a multiple association measure are introduced. Individual taxa are sorted into three categories according to their climate sensitivities. These are compared with two novel climate change related indicators, namely risk potential and expansion potential due to the climate change. A novel procedure was applied to separate the effect of the past and current weather conditions in influencing current Ambrosia pollen concentration. The potential effect of land use changes on the pollen release of the taxa considered is also discussed using CORINE Land Cover Database.
Key words: pollen, pollen season, trend, ecological indicator, climate change, respiratory allergy
1. INTRODUCTION
Recently, the Earth’s ecosystem is experiencing a global warming. Climate change is responsible for the observed northward and uphill distribution shifts of many European plant species. By the late 21st century, distributions of European plant species are projected to have shifted several hundred kilometres to the north (Emanuel et al. 1985, Pearson 2006, Parry et al. 2007, Lindner et al. 2010); forests are likely to have contracted in the south (Penuelas and Boada 2003) and expanded in the north (Leemans et al. 1996, Pearson 2006, Lindner et al. 2010). The rate of change will exceed the ability of many species to adapt.
Concerning plant phenology, the timing of seasonal events in plants is changing across Europe due to changes in climate conditions. Between 1971 and 2000, the average advance of spring and summer was 2.5 days per decade. The pollen season starts on average 10 days earlier and is longer than 50 years ago (Feehan et al. 2009).
A recent warming is associated with an earlier onset (Frei 2008, Rodríguez-Rajo et al. 2011), an earlier end date (Stach et al. 2007, Recio et al. 2010), a longer pollen season (Stach et al. 2007, Ariano et al. 2010), an increase in the total annual pollen load (Ariano et
al. 2010, Cristofori et al. 2010), furthermore an increase of patient number sensitized to pollen throughout the year (Ariano et al. 2010).
The scope of the studies is generally limited to only one taxon (Peternel et al. 2006, Alcázar et al. 2011), or a very small number of taxa (García-Mozo et al. 2010, Kaminski and Glod 2011, Rodríguez-Rajo et al. 2011). A comprehensive spectrum of the regional pollen flora was only analysed in three studies, namely in Clot (2003, 25 plant taxa), Damialis et al. (2007, 16 plant taxa) and Cristofori et al. (2010, 63 plant taxa). An overall analysis of the pollen season characteristics for a given source area provides a more reliable picture of the climate sensitivity for each taxon studied based on their different optimum environmental conditions.
Precognition of pollen season characteristics is important for those people suffering from pollen-induced respiratory diseases, who can prepare in due time for days of extreme high pollen load. At the same time, climate change can affect pollen characteristics of different taxa diversely. The object of this paper is to study an extended spectrum of airborne pollen characteristics (19 plant taxa) for the Szeged region in Southern Hungary.
Trends of both quantity-related and phenological pollen season characteristics are calculated for each taxon. A multiple association measure (MAM) is introduced that describes how well the annual cycle of daily pollen concentration trends can be represented by a linear combination of annual cycles of climate variable trends. Two novel climate change related indicators, namely risk potential (RP) and expansion potential (EP) due to the climate change are also introduced and these indicators are evaluated for each taxon.
Additionally, a novel procedure was applied to separate the effect of the past and current weather conditions in influencing current Ambrosia pollen concentration. The potential effect of land use change on Ambrosia pollen concentration is also discussed using CORINE Land Cover Database.
2. MATERIALS AND METHODS
2.1. Location and data
Szeged (46.25°N; 20.10°E), the largest settlement in South-eastern Hungary is located at the confluence of the Rivers Tisza and Maros. The area is characterised by an extensive flat landscape of the Great Hungarian Plain with an elevation of 79 m above sea level. The city is the centre of the Szeged region with 203,000 inhabitants. The climate of Szeged belongs to Köppen’s Ca type (warm temperate climate) with relatively mild and short winters and hot summers (Köppen 1931).
The pollen content of the air was measured using a 7-day recording “Hirst-type”
volumetric trap (Hirst 1952). The air sampler is located on top of the building of the Faculty of Arts at the University of Szeged approximately 20 m above the ground surface (Makra et al. 2010). Meteorological variables include daily values of minimum (Tmin, °C), maximum (Tmax, °C) and mean temperature (T, °C), total solar radiation (TR, W·m-2), relative humidity (RH, %), wind speed (WS, m·s-1) and rainfall (R, mm). They were recorded in a meteorological station located in the inner city area of Szeged. The data set consists of daily pollen counts (per m3 of air) of 19 taxa taken over the period 1997-2007. With their Latin (English) names they are: Alnus (alder), Ambrosia (ragweed), Artemisia (mugwort), Betula
(birch), Cannabis (hemp), Chenopodiaceae (goosefoots), Juglans (walnut), Morus (mulberry), Pinus (pine), Plantago (plantain), Platanus (plane), Poaceae (grasses), Populus (poplar), Quercus (oak), Rumex (dock), Taxus (yew), Tilia (linden), Ulmus (elm) and Urtica (nettle). The 19 taxa studied produce 93.2% of the total pollen amount for the given period. Taxa with the highest pollen levels include Ambrosia (32.3%), Poaceae (10.5%), Populus (9.6%) and Urtica (9.1%), which together account for 61.5% of the total pollen production.
As regards the taxa with the highest pollen concentrations, the Ambrosia genus has only one species, namely Ambrosia artemisiifolia (Common Ragweed) in the Szeged region that appears both in the urban environment and in the countryside. Ragweed occurs especially frequently west of the city. The ruling north-western winds can easily transport pollen into the city. Since in the sandy region, northwest of Szeged, stubble stripping is not necessary for ground-clearance due to the mechanical properties of sandy soils, Ambrosia can spread unchecked. Owing to newly-built motorways around Szeged, several farmland areas have been left untouched for a long time that also favour the expansion of Ambrosia.
Several species of the Poaceae family occur in the Szeged area, namely Agropyron repens (Common Couch), Poa trivialis (Rough Meadow-grass), as well as Poa bulbosa (Bulbous Meadow-grass) over untouched areas, furthermore Poa angustifolia (Narrow-leaved Meadow-grass) and Alopecurus pratensis (Meadow Foxtail) in the floodplain, and along the dyke surrounding Szeged. Along the urban lakesides Phragmites australis (Common Reed) is the most frequent Poaceae. Furthermore, on short grass steppes of sand, loess and saline areas Festuca pseudovina and Festuca rupicola also occur. For Populus genus, natural species of Populus alba (White Poplar) and Populus canescens (Grey Poplar) are the most frequent in the city and are characteristic in the floodplain forests along the Tisza and Maros Rivers. In addition, cultivated poplars such as I-273 Poplar and Populus x euroamericana (Canadian Poplar) and its variants are frequently planted in urban parklands, public places, as well as along roads in peripheries. At the same time, the Urtica genus with its only species of Urtica dioica (Common Nettle) has a high frequency in the floodplain forest underwood of the Tisza and Maros Rivers, road-, and channel-sides and in locust-tree plantations around the city. Urtica also occurs in the neglected grassy areas of the city.
The remaining species are rare. Alnus species are only found in the Botanical Garden of Szeged. The pollen of Artemisia, Cannabis, Chenopodiaceae and Rumex can come from neglected areas of both the city and its surroundings, as well as from stubble pastures. Betula, Juglans, Pinus, Platanus, Taxus and Tilia species have been planted exclusively in public places and gardens; they have no natural habitats in the Szeged region.
However, since the 1960s Pinus (Pinus sylvestris and Pinus nigra) species have been extensively planted in the sandy regions north-west of Szeged within the framework of an afforestation programme. Their pollen can easily reach Szeged via the north-western winds.
Morus is planted along avenues and in public places. Plantago species occur in natural grassy areas of both the city and its surroundings. Quercus species are planted along the embankment surrounding the city, as well as north of the city. Ulmus is planted in the city too; however it is not very common. At the same time, Ulmus minor is quite frequent in all landscape types around Szeged on boundaries, road-sides and channel-sides. Its scattered monodominant plantations can appear in loess landscapes and beyond the dykes (saved- side) floodplains, as well as rarely in sand landscapes. In the above-mentioned places the formerly planted Ulmus pumila, as an adventive species, also occurs, but its spread is not
characteristic. Large natural stands of Ulmus minor together with Ulmus laevis live in the oak-elm-ash alluvial forests alongside the River Maros, where both planted and spontaneous stands appear. These species can be found spontaneously even in the willow- poplar alluvial forests, thanks to the mature stands of the Pécska forest on the Romanian side (Deák 2010).
The pollen season is defined by its start and end dates. For the start (end) of the season we used the first (last) date on which 1 pollen grain m-3 of air is recorded and at least 5 consecutive (preceding) days also show 1 or more pollen grains m-3 (Galán et al. 2001).
For a given pollen type, the longest pollen season during the 11-year period was considered for each year.
2.2. Methods
2.2.1. Trend analysis
A common way of estimating trends in data is linear trend analysis. The existence of trends is examined generally by the t-test based on the estimated slopes and their variances.
This test, however, may only be used for normally distributed data. Data having probability distributions far from the normal one can be tested against monotone trends by the Mann- Kendall (MK) test (Önöz and Bayazit 2003). Therefore, this method is used here, although the slopes have also been calculated.
It may happen that some trends might have overly complex forms to be well approximated by global linear fits, so nonparametric methods are preferable.
Nonparametric methods assume some smoothness of the trends to be estimated. Each version of these techniques results in linear combinations of observations lying within an interval around the points where the trends are estimated. The size of this interval is controlled by a parameter called the bandwidth. There are several versions of such estimators, but local linear fittings have useful properties (Fan 1993). When estimating the trends, the choice of the bandwidths has a crucial role in the overall accuracy. A large bandwidth provides small variances with large biases of the estimates, while a small bandwidth results in large variances with small biases. Thus, an optimal bandwidth producing relatively small variances and small biases has to be found. A technique proposed by Francisco-Fernández and Vilar-Fernández (2004) is used here for the purpose.
Note that the local linear fits become globally linear with infinite bandwidths.
2.2.2. Taxon-specific ecological indicators as a basis for introducing new climate change related indicators
In order to evaluate the response of plants to climate change, two indicators were introduced: risk potential due to the climate change (RP) and expansion potential due to the climate change (EP). RP describes the endangerment of the species of different taxa in their present habitats indicating survival potential on their present places. EP shows the capability of the species to move in the landscape, so this term measures the landscape- scale rescue effect. Both indicators were determined for a specific taxonomic group (genus, family) of the most allergenic plants. The species-pool of the Hungarian vegetation was collected according to the Flora Database of Hungary (Horváth et al. 1995). The above- mentioned two new terms were determined on the basis of four main ecological indicators
of the taxa examined. The selected indicators were: temperature requirement due to Zólyomi (TZ-value) (Zólyomi and Précsényi 1964), temperature requirement due to Soó (TS-value) (Soó 1964-1980), heat supply of species interpreted with the climate of the vegetation belts due to Borhidi (TB-value) (Borhidi 1995), as well as the degree of continentality and climate extremity tolerance according to the distribution of species due to Borhidi (CB-value) (Borhidi 1995). Substitution of species within a taxon and habitat shifts were also considered using the Hungarian National Flora Database (Horváth et al.
1995) and field knowledge (Deák 2010) detecting the effect of different climate extremities on the vegetation (Deák 2011a) (Table 1). In order to calculate the new climate change related indicators, besides the above-mentioned ecological indicators, local effects of the prospective changes predicted by recent climate models were also considered. These models count with a 2-4°C increase in annual mean temperature, lower rainfall total in the summer season, annual precipitation decreasing by 150-200 mm and a more extreme rainfall distribution throughout the year for a 100-year time scale until the end of the century (Láng et al. 2007, Czúcz 2009, Faragó et al. 2010).
Table 1 The values of the ecological indicators and the climate change related indicators for the most common allergenic taxa for Hungary
Taxa
2TZ- value
3TS- value
4TB- value
5CB-
value Risk potential due to
climate change (RP) Expansion potential due to climate change (EP)
Alnus 2, 3, 6 1, 2 3, 4, 5 4 *** -2
1Ambrosia 0 0 8 6 * 2
Artemisia
5, 6, 7,
2, 3, 4, 5
6, 7, 8, 9
5, 6, 7,
8, 9 * 2
Betula 3 1, 2 3, 4 3, 4 *** -2
Cannabis 5 0 7 7 * 0
Chenopodiaceae 0, 5, 6, 7
0, 2, 3, 4, 5
5, 6, 7, 8, 9
0, 2, 3, 4, 5, 6, 7, 8, 9
*
**(few taxa) 1
Juglans 5 4 8 2, 5 * 2
Morus – – 7 5 ** -1
Pinus 3 1, 2, 4 4, 8 4, 7 ** -1
Plantago
5, 6, 7 0, 2, 3, 4
5, 6, 7, 8
0, 1, 3, 6, 7, 8
*
**(few taxa) 1
Platanus 5, 6, 7 4 6, 7, 8, 9
6 * 2
1Poaceae
0, 3, 4, 5, 6, 7
0, 2, 3, 4, 5
3, 4, 5, 6, 7, 8, 9
2, 3, 4, 5, 6, 7, 8, 9
*
**(few taxa)
***(few taxa)
1
1Populus 3, 5 3, 4 5, 7, 8 5, 6, 7 *
**(few taxa) 1
Quercus 5, 6 3, 4 6, 7, 8 4, 5, 6, 7
*
**(few taxa) 1
Rumex 0, 5 0, 2,
3, 4
4, 5, 6, 7, 8
2, 3, 5, 6, 7, 8
*
**(few taxa) 1
Taxus 5 2 5 2 *** -2
Tilia 5, 6 3, 4 5, 7 2, 4, 7 *
**(few taxa) 1
Ulmus 5 2, 3, 4 5, 6, 7 3, 5, 6 *
**(few taxa) 1
1Urtica 5, 6 0, 4 6, 7 4, 6 *
**(few taxa) 1
1Bold: taxa with the highest pollen levels;
2TZ-value: temperature requirement due to Zólyomi (Zólyomi and Précsényi 1964, Horváth et al. 1995):
–: no value is determined; 0: not characteristic; 2: in accordance with woody tundra belt; 3: in accordance with taiga belt; 4: in accordance with broad-leaved/needle-leaved mixed forest belt; 5: in accordance with broad- leaved forest belt; 6: in accordance with sub-Mediterranean forest belt; 7: in accordance with Mediterranean, Atlantic evergreen belt; (Taxa with TZ-value of 1 does not occur.)
3TS-value: temperature requirement due to Soó (Soó 1964-1980, Horváth et al. 1995):
–: no value is determined; 0: indifferent species to temperature; 1: highly cold-tolerant, arctic or alpine species;
2: cold-tolerant species; 3: slightly cold-tolerant species; 4: cold-sensitive, warm-needed species; 5: highly warm-needed species
4TB-value: heat supply of species interpreted with the climate of the vegetation belts due to Borhidi (Borhidi 1995, Horváth et al. 1995):
3: in accordance with sub-alpine or sub-boreal belt; 4: in accordance with montane needle-leaved forests or tajga belt; 5: in accordance with montane broad-leaved forest belt; 6: in accordance with sub-montane broad-leaved forest belt; 7: in accordance with thermophilous forest belt; 8: in accordance with the belts of sub-Mediterranean woodlands and continental steppes; 9: in accordance with Mediterranean evergreen belt; (Taxa with TB-values of 0, 1 and 2 do not occur.)
5CB-value: degree of continentality and climate extremity tolerance in association to the distribution of species due to Borhidi (Borhidi 1995, Horváth et al. 1995):
0: indifferent species; 1: eu-oceanic species (Atlantic species occurring just exceptionally on continental climate);
2: oceanic species (living mainly in Western-Europe and Western-Central Europe); 3: oceanic-sub-oceanic species (distribution focus on Central Europe); 4: sub-oceanic species (distribution focus on Central Europe, but rarely expanding to East); 5: sub-oceanic - sub-continental intermediate species; 6: sub-continental species (distribution focus on Eastern Central Europe); 7: continental-sub-continental species (distribution focus on Eastern Europe, but occurring in Central Europe, as well); 8: continental species (distribution focus on Eastern Europe reaching only Eastern Central Europe); 9: eu-continental species (Eastern European and Asian steppe species occurring just exceptionally in Central Europe)
2.2.3. Risk potential (RP) and expansion potential (EP) as new indicators due to climate change
RP describes the endangerment of the species of different taxa in their present habitats indicating survival potential of the species with 3 categories. Non-endangered taxa (*) can survive climate change since they contain species for warmer and drier conditions, whereas the climatically endangered taxa (***) have no species in the present flora for future changed conditions. In the first case, change of species within a taxon in a certain landscape could help the adaptation of the taxon to global warming, whereas in the latter case the lack of heat tolerant species can lead to the disappearance of a given taxon. The wider tolerance range (the more ecological indicator values, i.e. TZ-, TS-, TB-, or CB- values) (Table 1) and the more species (especially heat and drought tolerant species) a taxon has, the less exposure to climate change it has. Moderately endangered taxa (**) could survive partly in their places, but populations of some species may decrease regionally.
Three variables must be considered for a given taxon: (1) the number of species within a taxon, (2) the value range of the ecological indicators of the species within a taxon and (3) the number of heat and drought tolerant species within a taxon (this is the most important factor). For example, grasses (Poaceae) have a lot of species [see: (1)] with a wide value range of the ecological indicators of their species [see: (2)], and many of them are heat tolerant [see: (3)], so they will have enough species to adapt to the changes.
However, the answers of species can be different to the climate change (all three categories of RP can occur for Poaceae) (Table 1). If a taxon contains mainly warm- and drought tolerant species (e.g. Ambrosia, Juglans and Platanus) less species need adaptation, so they
are less endangered taxa. If a taxon has only a few species and neither of them favours warmer and drier conditions the chance for its extinction is significantly high (***) (e.g.
Betula and Alnus) (Table 1).
EP shows the capability of the species to move in the landscape thus characterizing the rescue effect. If a taxon belongs to several categories of RP, these categories can be grouped into different classes on the basis of field experiments (Horváth et al. 1995, Deák 2010, 2011b, Bölöni et al. 2011). This feature is described with 5 classes as a wide range of responses are expected due to the different climate-tolerance of the species-pool of taxa.
These classes are as follows. (0): Taxa not influenced by global warming. They could survive and their distribution area will remain about the same. (+1): Taxa not influenced by global warming, but for some species area-increase and for some others area-decrease is possible. They can survive the changes through moving in the landscape, but their expansion is limited. (+2): Taxa significantly influenced by global warming. For some species area-increase is expected. They show the best adaptation to the climate change as they will not just survive but can spread well in the landscape. For example, potential spread of species with (*) (e.g. Ambrosia, Juglans and Platanus) is expected in the landscape, so +2 value is given for them showing that their significant area increase is expected as a response for the awaited climate change. (-1): For some species regional area- decrease is possible. They can survive in a few places, their spread in the landscape is limited and area-decrease is expected. (-2): Taxa significantly influenced by global warming. For the majority of species area-decrease is expected. They have the smallest adaptation capability; they will gradually disappear and even the rescue effect in some refuges is doubtful (Table 1). For instance, Betula and Alnus are endangered taxa indicated with (***) in the RP system, so their EP value is the lowest meaning that area-decrease is expected as a result of climate change. These five categories can be useful not only to evaluate the future distribution of allergenic species groups, but they can also help to reveal the possible changes in endangered plant groups and invasive species (nature conservation aspect), as well as the spread of weeds (agricultural aspect).
On the whole, RP concentrates on the local survival specifying what will happen with the species in their present habitats, while EP concentrates on the landscape-level response. The scale of the two indicators is thus different. Note that this work is the first attempt to reveal the climate sensitivity of the main species groups of vegetation since the database applied has not been available before and sufficient field-knowledge has now been collected by several botanists.
2.2.4. Multiple association measure (MAM) and its association with RP and EP We examined whether there were any associations between the annual cycles of daily slopes of pollen concentration trends and the annual cycles of daily slopes of climate variables trends. Here an association measure (AM) is used to characterize these relationships by calculating the correlations between the annual cycles of slopes obtained by the nonparametric trend estimation procedure of Section 2.2.1. This quantity will not be referred to as a correlation because correlation is defined for random variables, but in this case similarities between deterministic functions (annual cycles) have to be quantified. In addition, an overall measure called multiple association measure (MAM) characterizing how well the annual cycle of the slope of a pollen concentration trend can be represented by a linear combination of annual cycles of slopes of climate variable trends was also introduced. MAM varies between zero and unit approaching the unit under increasing
accuracy of this above mentioned representation. Technically, MAM is calculated as a multiple correlation between a random variable and a number of other random variables, but again it should not be considered as correlation. AM and MAM are based on elementary considerations of linear algebra (see e.g. chapter 5.15 in Meyer 2001) because an annual cycle of slopes of daily trends covering an n-day period can be considered an n- dimensional vector. AM and MAM relate to angle between the vector corresponding to the annual cycle of the slope of a pollen concentration trend and the hyperplane defined by vectors corresponding to the annual cycles of slopes of climate variable trends.
MAMs do not necessarily harmonize with RP and EP for the given taxa. EPs were determined using RPs based on the ecological indicators of the species-pool; hence, these indicators are in strong association. These latter two plant associated indicators count (a) with the intra-taxonic species change, (b) with a higher range of species (species in and around the Carpathian basin), (c) with the transformation of the abiotic features of habitats, (d) with the moving capability of the species and (e) with the rescue effect of habitats due to special microclimates. At the same time, MAMs consider only the climate sensitivity of the taxa for a given time period, area and their species-pool. Furthermore, RP and EP are suitable to detect regional changes for longer (centuries, millennia) time periods, whereas MAMs can be used for observing local changes for shorter (decades) periods (Tables 1, 3, 4).
2.2.5. Factor analysis and special transformation
Factor analysis identifies any linear relationships among subsets of examined variables and this helps to reduce the dimensionality of the initial database without substantial loss of information. First, a factor analysis was applied to the initial datasets consisting of 9 variables (8 explanatory variables and 1 resultant variable defined by the daily Ambrosia pollen concentration) in order to transform the original variables to fewer variables. These new variables (called factors) can be viewed as latent variables explaining the joint behaviour of past and current meteorological elements – current Ambrosia pollen concentration variables. The optimum number of retained factors can be determined by different statistical criteria (Jolliffe 1993). The most common and widely accepted one is to specify a least percentage (80%) of the total variance in the original variables that has to be achieved (Liu 2009). After performing the factor analysis, a special transformation of the retained factors was made to discover to what degree the above-mentioned explanatory variables (4 climatic variables in the past and the same 4 climatic variables on the actual day) affect the resultant variable (daily Ambrosia pollen concentration), and to give a rank of their influence (Jahn and Vahle 1968). When performing factor analysis on the standardized variables the factor loadings received are correlation coefficients between the original variables and, after rotation, the coordinate values belonging to the turned axes (namely, factor values). If the resultant variable is strongly correlated with the factor and an influencing variable is highly correlated with the same factor, then the influencing variable is also highly correlated with the resultant variable. Accordingly, it is advisable to combine all the weights of the factors, together with the resultant variable, into one factor. Namely, it is effective to rotate so that only one factor has great load with the resultant variable. The remaining factors are uncorrelated with the resultant variable; that is to say, are of 0 weight (Jahn and Vahle 1968). This latter procedure is called special transformation.
3. RESULTS
3.1. Trend analysis
Only a few trends have been clearly identified compared to the total number of annual MK tests performed (Table 2). It is not surprising as the inter-annual variability of the characteristics studied is quite high, while the size of the data set is quite small.
Therefore, MK tests are performed and linear trends are estimated for each particular day of each pollen season of all 19 taxa considered using 11-element pollen concentration data sets corresponding to the 11-year study period. This kind of trend analysis provides information on the annual cycles of trends. In the absence of a trend for each day of the pollen season, the MK test values are distributed normally with zero expectation and unit variance.
Therefore, deciding on the existence of a trend is identical with the problem of deciding whether the annual mean of daily MK test values corresponds to the expectation zero. The classical t-test has been simplified for the purpose as the variance is known (unit), but modified based on the autocorrelations among the consecutive MK test values. First order autoregressive (AR(1)) models are used to describe these autocorrelations. Averaging values of daily slopes of linear trends over the pollen seasons gives rates of change of the total annual pollen counts (TAPC). Note that the trend analysis carried out on a daily basis detects much more significant trends of TAPC than the trend analysis on an annual basis (Table 2).
Table 2 Change in the total annual pollen count (TAPC) (pollen grains·m-3 / 10 years), annual peak pollen concentration (APP) (pollen grains·m-3 / 10 years), start, end and duration of the pollen season
(days / 10 years) calculated by using linear trends. Significant values on annual basis are denoted by
*** (1%), ** (5%) and * (10%). Significant values on daily basis are denoted by +++ (1%), ++ (5%) and + (10%).
Pollen season
Taxa Mean total
annual pollen counts
TAPC APP
Start End Duration
Alnus 505 -214 -59* 18 16 -2
1Ambrosia 7826 -1170 230 14* -9 -22
Artemisia 772 -61 -133 -4 15 19
Betula 901 -60 0 -1 2 3
Cannabis 432 47 + -4 8 36** 28
Chenopodiaceae 854 -175 ++ -9 -2 3 5
Juglans 284 253 +++ 30* -8 -7 1
Morus 667 400 +++ 44 -7 -4 3
Pinus 500 -194 +++ -20 -2 -1 0
Plantago 409 91 ++ 3 -23** -19 4
Platanus 400 271 ++ 48 -7 -3 4
1Poaceae 2552 176 43 -10 17* 27***
1Populus 2322 2981** +++ 610** -2 3 4
Quercus 423 236 + 25 4 9 5
Rumex 462 -505 +++ -45 -11** 3 15
Taxus 572 697* +++ 59 -4 29*** 32
Tilia 225 -65 + -1 -4 -1 3
Ulmus 260 -160 +++ -12 5 -13 -18
1Urtica 2200 1183* +++ 25 -13** 18** 31***
1Bold: taxa with the highest pollen levels
Needless to say, the daily MK test statistics have a big variability. Therefore, daily MK test values are smoothed with the nonparametric regression technique outlined in Section 2.2.1. In the absence of a trend for each day the estimated bandwidth is extremely large (practically infinite) producing a line close to zero because the local linear approximation to the annual cycle of the daily trends becomes globally linear. Hence, well- defined finite bandwidths obtained for every taxon indicate trends even for Alnus, Ambrosia, Artemisia, Betula and Poaceae, the 5 taxa not exhibiting overall trends on yearly basis at even 10% significance level. The nonparametric regression technique was used also to estimate annual cycles of the slopes of daily trends.
Trends of taxa (Table 2) related to trends of climatic variables (Fig. 1) can be explained as follows. Alnus and Betula occur around Szeged with very little populations (especially Alnus). Due to the tolerance range of these taxa increasing temperature and drying climate do not favour them, so their decreasing pollen trend would not be surprising as Alnus glutinosa – the only representative of this taxon appearing just in few bogs in the Great Hungarian Plain and parks in Szeged – and Betula pendula (planted in parks) like a wetter, more humid, balanced climate. Due to their low occurrences the decrease of their TAPC cannot be significant in the trends. However, we are now in a preliminary period of the climate change (Parry et al. 2007) to which they could have been already adapted.
Furthermore, the trend back-shots (e.g. individual years with extreme high precipitation in the decreasing trend) could ensure enough water for their survival and adaptation, but it is questionable whether these back-shots will be enough if the trends continue in the future.
Pinus show a clear decreasing trend as a result of non-suitable choice of species because foresters and gardeners plant non-heat tolerant Pinus species in many cases. In the forest plantations of Kiskunság sand-ridge the co-plantation of Pinus sylvestris favouring a wetter, cooler climate and the more heat tolerant sub-Mediterranean Pinus nigra is common. The increasing temperature and the lack of water, especially in summer does not suit Pinus sylvestris and a substantial decrease of TAPC for Pinus can only be partially compensated by the increase of pollen counts of Pinus nigra.
TAPC for Tilia show a slight decreasing tendency. This taxon is not widely represented in the forests of the Great Hungarian Plain, but it is quite common in the parks and gardens of Szeged city. Of the Tilia species Tilia platyphyllos is often planted, which tolerates the warmer and drier climate less compared to Tilia cordata and Tilia tomentosa, which are more heat tolerant, especially the latter. Tilia tomentosa is represented along the Illyrian-Dacical pincer which is a route for sub-Mediterranean species approaching the Carpathian basin from the south. Note that the Tilia species can be found as ornamental vegetation mainly around Szeged, but they also occur within a 100-150 km range in natural forests in the surroundings of Szeged (Mecsek Mountain and South Transdanubian Hills west from Szeged, Banatian and Partiumian Mountains east of Szeged in Romania and Fruska Gora Mountains in Serbia, south of Szeged).
The lack of humidity and the increasing temperatures can be a limiting factor also for Ulmus as a notable decrease in its TAPC was observed. Stocks of its most common species Ulmus minor grow in dry places without shading trees like oak; they appear several times alone alongside roads and channels. This species together with Ulmus laevis can be found in the hard-wood floodplain forests as well. These taxa can also occur in parks where Ulmus glabra is sometimes planted. Ulmus is a spring pollinating species. A warming may involve higher spring temperatures and maximum temperatures. Its pollination season therefore can begin earlier and can last longer during this season mainly because in
springtime no limitation of available groundwater can be detected. From the melted snow, from the springtime rainfall and even from the floods enough water is available for this genus. However, in dry places the lack of shading trees, while in floodplains the absence of floods and the lower level of the summer groundwater can limit their pollination.
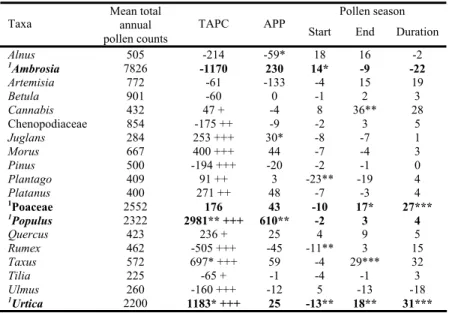
Fig. 1 Annual cycles of the slopes of daily linear trends for maximum temperature (Tmax), mean temperature (T), rainfall total (R), relative humidity (RH) and wind speed (WS) for Ambrosia (solid),
Poaceae (dash), Populus (dot) and Urtica (dash dot)
Change of TAPC for Artemisia, Chenopodiaceae and Rumex calculated on yearly basis is not significant. However, Chenopodiaceae and Rumex show decreasing trends when calculating on daily basis. These plants are typical species of young fallows, which appeared after the change of political system at the beginning of 1990s, especially in sand landscapes. However, due to spontaneous regeneration facilitated by grazing and mowing these new stocks began to disappear as these sand fallows turned into sand steppe grasslands (Deák 2010) and only the populations associated with natural habitats or settlements remained. At the same time, the abandonment of arable lands have decreased during the last 10 years as the extension of fallows was reduced by in-buildings and forest plantations, respectively. The strong decrease of Rumex can be explained by the fact that Rumex (especially Rumex crispus) often appears in the summer in depressions covered with inland water in springtime, which were transformed into arable lands. The lack of rainfall can hence reduce their stocks. However, wetter years do not favour the pollination of this genus since the plants’ anther is not dry enough to open, furthermore rainfall can wash out its pollen from the air.
In contrast, TAPC of Plantago shows a clear increase, which can also be explained by the above-mentioned regeneration processes of fallows. Plantago species (especially P.
media and P. lanceolata) are typical plants of old fallows regenerating into sand steppe grasslands, but also occur frequently in urban grasslands. It is typical that weeds of Artemisia, Chenopodiaceae and Rumex disappear in the later stages of fallow-succession, while steppe species like Plantago appear especially in the treated (mown, grazed) fallows.
The fallows of the sand-ridge around Szeged have apparently reached the stage when Plantago became more frequent.
The duration of the pollen season of Poaceae is significantly increasing due to the warming climate, but TAPC exhibits no significant trend, which can also be in association with the regenerating fallows. The older fallows are all characterized by a huge coverage of grasses, so fallow regeneration led to a slight extension of grasslands during the last 10 years. In warmer years the pollination season of Poaceae can be substantially longer (Makra et al. 2012), but without higher pollen concentrations due to decreasing summer rainfall amounts.
Populus indicates a substantial increase of TAPC. This can be the result of its wide climate tolerance as both wet- (e.g. P. nigra and P. canescens) and drought tolerant species are represented in the landscape. Especially Populus alba living in floodplains, sand lands and parks shows a great adaptation potential. Populus (both wild and cultivated types) were planted widely in the sand lands west from Szeged and in the floodplains. Plantation of these species has not yet stopped during the last 10 years. Besides the locust-tree (Robinia pseudo-acacia) they are the most favoured trees for the plantation of forests. The stands planted in the last decades are in mature state, so they can pollinate on a high level.
Quercus (mainly Quercus robur) was not planted so widely during the last 10 years, but mainly in the 1960s and partly in the 1970-1980s significant oak plantations appeared southeast from Szeged in the saved-side floodplains and in the active floodplain of river Maros. The stands became more and more mature during the last decades, so they are on the level of their full pollination potential. As Quercus robur is a continental species with wide climate tolerance the increasing temperature can help its generative processes limited by the available water. These forests produce the average pollen count of this habitat-type.
It must also be considered that these forests are managed. In a young forest there are smaller trees producing a certain amount of pollen. Some of them are then cut off in order
to enhance the growth of the healthier individuals. They grow higher but the number of trees decreases significantly and so no major pollen count increase is expected due to their growing age. This is the reason why only a weakly significant increase in their pollen release occurs. Climate variables and pathogens can have a more important role in controlling the pollen counts from these stands and these two factors are also associated.
Surprisingly, the TAPC of Taxus showed a remarkable increase during the last 10 years. This species does not appear in natural communities around Szeged, only in parks and gardens. Taxus baccata – as a representative of this taxon in Szeged – is a Western European species favouring a more humid, balanced oceanic climate, which is warmer in the winter and springtime compared to the continental climate of Hungary. However, this trend is influenced by the city since the spring begins earlier and a longer pollination period with more pollen grains is expected due to the urban heat island. In this way, freezing temperatures can occur beyond the city, while inside above-zero temperatures are more typical.
Highly significant increase was observed for TAPC and the duration of the pollen season of Urtica. Urtica dioica, the only representative of this species around Szeged, has a wide climate tolerance. It can be found both in dry and wet habitats. The under-use of urban habitats, the frequent plantation of locust-tree (Robinia pseudo-acacia) and the increasing area of fallows also contributed to the expansion of their population. Their pollination is also promoted by increasing maximum temperatures facilitating an earlier start and later end of its pollen season.
Growing trends were observed for all heat tolerant, non-endemic taxa. TAPC of Cannabis (originated from South Asia) shows just a slight increase, but stronger increase was observed for Juglans, Platanus (originating from the Mediterranean) and Morus (originating from East Asia).
Ambrosia (represented only with one species) shows no significant trend as a moderate warming is favourable for this taxon, but the lack of available water during the hottest summer period can limit its pollination as the plant concentrates on preserving water and maintaining its vegetative life functions instead of the generative. Ambrosia appears year by year in stubble fields, especially in sand landscapes and in abandoned places around settlements. The populations of young fallows represent just a smaller part of their population in the landscape.
3.2. Analysis of the individual taxa based on MAM, RP and EP
Possible future change of taxa due to the anticipated climate change based on RP, EP (Table 3) and MAM (Table 4) can be explained as follows. Alnus, Betula and Taxus are endangered species in their existence according to their RP (***), as well as they are highly sensitive according to their MAM values (+++). This is because they live on the edge of their distribution area in Hungary. Hence, global warming can affect them negatively since they cannot tolerate warm and dry climate for a longer time and they can become extinct in several habitats and other competitors can be more successful. Especially Alnus is sensitive to the lack of water but the urban heat island can help its pollination as the pollen season can start earlier. Betula favours a much cooler climate according to its distribution area and climate tolerance indicators. Therefore, Betula adapted to cooler springs does not tolerate earlier springs with higher temperatures. The anticipated warmer climate may thus reduce its pollen release. Increased temperatures can be more severe limiting factors for Betula than the lack of water considering its existence.
Ambrosia is unaffected according to its MAM value. However, its higher potential increase is expected due to its ecological indicator values and high climate-tolerance.
Namely, this genus can adapt well to dry and hot conditions, but is highly influenced by future land use.
Artemisia species are heat tolerant, so their EP is high; even Mediterranean and more continental species could appear in the Carpathian basin. The EP of agricultural weeds can be high on fallows that appear fast in all landscapes in unfavourable weather conditions for farming. Artemisia pollen is partly released by Artemisia santonicum, a natural dominant species of Artemisia short grass alkali steppes – main habitats of saline grasslands formed on loess (Deák 2010). These habitats and this species are proved to be very climate-sensitive – in contrast with Artemisia weeds. Its reason is the leaching out of their solonetz soils, due to the drainage of saline grasslands and the decrease of rainfall resulting in the decrease of salty groundwater-table.
Table 3 Association measure (aAM) between the annual cycles of the daily slopes of pollen concentration trends and the annual cycles of the daily slopes of climate variables trends
Taxa Tmin Tmax T R TR RH WS bMAM
Alnus 0.718* 0.775* 0.742* 0.313 -0.028 -0.620* -0.455 0.992
1Ambrosia 0.100 0.207 -0.641* 0.398 0.049 0.087 0.223 0.827 Artemisia -0.249 0.676* -0.486 0.140 -0.004 -0.230 -0.049 0.998 Betula -0.689* -0.192 -0.544* -0.663* -0.006 0.542* 0.070 0.973 Cannabis 0.602* -0.559* 0.763* -0.531* -0.152 0.106 -0.147 0.993 Chenopodiaceae 0.071 0.306 -0.869* 0.644* 0.047 0.112 0.307 0.965
Juglans 0.271 -0.392 -0.466 0.613* -0.129 -0.726* 0.452 0.925
Morus 0.329 -0.668* -0.874* 0.821* -0.216 -0.893* 0.684* 0.978
Pinus 0.093 0.144 0.241 -0.269 -0.160 -0.294 -0.079 0.963
Plantago 0.183 -0.642* -0.093 0.337 -0.131 0.371 0.490 0.947
Platanus 0.308 -0.265 -0.354 0.368 -0.020 -0.576* 0.328 0.948
1Poaceae -0.088 -0.649* -0.816* 0.826* -0.057 0.309 0.643* 0.959
1Populus 0.361 0.358 0.395 0.407 -0.093 -0.378 -0.349 0.869
Quercus -0.046 0.165 0.360 0.616* -0.076 -0.640* -0.062 0.911
Rumex -0.093 -0.026 0.450 -0.244 -0.060 -0.365 -0.087 0.979
Taxus 0.618* 0.305 0.428 0.446 0.010 0.009 -0.264 0.985
Tilia 0.284 -0.378 -0.171 0.327 0.062 -0.106 0.428 0.973
Ulmus 0.381 0.565* 0.462 0.063 -0.069 -0.766* -0.256 0.934
1Urtica -0.467 0.612* 0.451 -0.396 0.076 -0.580* -0.705* 0.827
1Bold: taxa with the highest pollen levels;
Tmin: minimum temperature (°C), Tmax: maximum temperature (°C), T: mean temperature (°C), R: rainfall (mm), TR: total radiation (W·m-2), RH: relative humidity (%), WS: wind speed (m·s-1);
aAM (association measure): reflects the strength of the relationship between the annual cycle of the daily slopes of pollen concentration trends and the annual cycles of the daily slopes of climate variables trends for each individual taxon;
bMAM (multiple association measure): describes how well the annual cycle of the slope of the daily pollen concentrations can be represented by a linear combination of the annual cycles of the slopes of the daily climate variable trends. MAM varies between zero and one, approaching one with increasing accuracy of this above-mentioned representation (Meyer 2001);
*AM >|0.5| indicates a strong association
Cannabis is a heat tolerant species but too high maximum temperatures can be a limit for its pollen production due to water shortage. Future drier conditions are expected during its pollen season, though the June rainfall peak (Medard-day rainfall) overlaps it.
The MAM of Chenopodiaceae indicates high sensitivity, but its response to climate change varies according to its species as it has a wide range of species-pool. Both increase
and decrease of its species-pool are expected. These plants frequently appear in areas affected by inland water around Szeged that can disappear due to a drying climate.
Juglans being heat tolerant shows a potential increase due to warming, and according to its MAM, has medium climate sensitivity. Rainfall is a major limiting factor.
Warming can help this species as it happened in interglacial times, but a certain minimum rainfall is required. This species cannot be seen over the driest areas of the Mediterranean, but still has a relatively large EP in Hungary.
Table 4 Climate change related indicators and significance of the different pollen season characteristics for each individual taxon
5Pollen season
Taxa RP EP 2MAM
3TAPC by linear
trend
4APP
onset end duration
6TAPC via daily linear trend
Alnus *** -2 +++ (-10)
1Ambrosia * 2 + (+10)
Artemisia * 2 +++
Betula *** -2 +++
Cannabis * 0 +++ +5 (+10)
Chenopodiaceae *
**(few taxa) 1 +++ -5
Juglans * 2 ++ (+10) +1
Morus ** -1 +++ +1
Pinus ** -1 +++ -1
Plantago *
**(few taxa) 1 ++ -5 +5
Platanus * 2 ++ +5
1Poaceae *
**(few taxa)
***(few taxa)
1 +++ (+10) +1
1Populus *
**(few taxa) 1 + +5 +5 +1
Quercus *
**(few taxa) 1 ++ (+10)
Rumex *
**(few taxa) 1 +++ -5 -1
Taxus *** -2 +++ (+10) +1 +1
Tilia *
**(few taxa) 1 +++ (-10)
Ulmus *
**(few taxa) 1 ++ -1
1Urtica *
**(few taxa) 1 + (+10) -5 +5 +1 +1
1Bold: taxa with the highest pollen levels;
2 MAM (multiple association measure): + low sensitivity; ++ medium sensitivity; +++ high sensitivity;
3TAPC by linear trend: change in the total annual pollen count calculated by using linear trends;
4APP: change in the annual peak pollen concentration calculated by using linear trends;
5Pollen season: change of start, end and duration of the pollinations season calculated by using linear trends;
6TAPC via daily linear trend: change in the total annual pollen count calculated by using daily linear trends;
3, 4, 5, 6: ±1, ±5: a significant increasing/decreasing trend at the 1%, 5% probability levels; (±10): a tendency of trend at the 10% probability level
Morus is assigned to the moderately endangered category (**). Lack of rainfall and too high temperature are a barrier for their pollen production during their pollen season
(summer). Its AM and MAM values emphasize that decreasing rainfall can decrease their pollination intensely. On its original distribution area in China, high temperatures are accompanied with spring-time or monsoon rainfalls. This high precipitation amount is missing in Central Europe. Hence, Morus try to preserve as much water as possible in summer.
Pinus is endangered moderately according to its RP (**) but MAM shows much higher sensitivity (+++). This is because Pinus sylvestris representing a big portion of this species cannot tolerate warming climate. However, change in species composition, plantation and the appearance of Mediterranean species can make this genus more adaptive for the expected changes.
Plantago, Quercus and Ulmus have medium sensitivity (++) according to their MAM values and due to their diversified species-pool they can react well to climate change with intra-taxonic species changes. RP values show that they are moderately endangered or not endangered, and for heat tolerant, sub-Mediterranean or continental species further expansion can be awaited at the expense of present species. It can be expected mostly for genera Ulmus and Quercus, where more heat tolerant species also exist in the landscape or around the Carpathian-basin.
A medium sensitivity indicated by MAM (++) is observed for Platanus. It stands warm climate, but a shortage of water can be a limiting factor. This species appears mainly in mountain valleys alongside streams in the Mediterranean, where a certain amount of water is available. It has a potential for expansion in Hungary but not in every landscapes.
Poaceae show high sensitivity according to MAM (+++), since the available water and high temperature can mean limits for them. However, the species-pool of this family is the widest among the studied plant groups, so there will be species to substitute the actual grasses and even species from the Mediterranean and the more continental areas can reach the Carpathian-basin in the future. This means a high risk for the present species, but intra- taxonic re-assemblage could happen. Shortage of water and too high temperatures can cause lower pollen production in natural grasslands and also in crops produced in arable lands. Certain species in certain places and time periods can suffer from climate change, but the change in species composition will give good chance for the survival of this family.
Rumex is moderately endangered in the Szeged region as it can give a wide range of responses to climate change according to its species-pool. Since Rumex species around Szeged live rather in semi-humid conditions favouring inland water covered areas (see Rumex crispus, the most common Rumex species around Szeged) climate change could affect them intensely due to water shortage.
The Tilia genus can give a wide range of responses according to its species-pool.
Potential increase, especially for Tilia tomentosa, is expected in the Great Hungarian Plain, but this heat tolerant species currently occurs only in the parks of Szeged. The existing species-pool is not favourable for the expected climate change. Especially Tilia platyphyllos characterized by high sensitivity according to its MAM (+++) will not stand the warming. Tilia cordata could survive better, but its natural stock is very small.
Urtica and Populus have a wide climate-tolerance, so they are not climate-sensitive according to MAM. Both genera could increase their population in the future. They are not endangered or only certain species are moderately endangered by warming. Urtica dioica is not endangered according to its RP and even population increase is expected. For the extremely rare Urtica kioviensis living in boggy wetlands major decrease is expected in the
Carpathian basin. The better climate tolerance of Populus can be explained by the wide adaptation of its different species.
4. DISCUSSION AND CONCLUSIONS
Climate change can modify the pollen season characteristics of different allergenic taxa in diverse ways and can exert a substantial influence on habitat regions. In our best knowledge, only three previous studies (Clot 2003, Damialis et al. 2007, Cristofori et al.
2010) analysed comprehensive spectra of the regional pollen flora. The present study analyses one of the largest spectra with 19 taxa. Our study can be considered unique in the sense that trends of pollen concentration data for each taxon and those of all seven climate variables are calculated on a daily basis. This kind of trend analysis provides information on annual cycles of daily slopes of trends.
On a yearly basis only Populus, Taxus and Urtica show a significant increase of the total annual pollen count. Populus and Juglans display the most important increase, while Alnus exhibits the biggest decrease of the annual peak pollen counts. Poaceae and Urtica show a significant increase in the duration of the pollen season. Based on the 5% level, 11 of the 19 taxa indicated significant trends of the total annual pollen count, and 7 of these 11 trends is increasing on a daily basis (Table 2). Phenological characteristics (onset, end and duration of the pollen season) show changes only in 8 (10) out of 57 cases (19 taxa x 3 phenological characteristics) at 5% (10%) significance level. Here, Poaceae and Urtica are the most important with notable changes in at least two characteristics. Our conclusions are in good agreement with those of several previous researches. For Thessaloniki (Greece), the total annual pollen counts, as well as the daily peak pollen counts show significant increasing trends for the majority of taxa, but there are no important changes for the phenological characteristics (Damialis et al. 2007). Looking at a bigger region of Central Europe, for Zurich, Switzerland (Frei 2008, Betula), as well as for Vienna, Austria (Jäger et al. 1996, Alnus, Corylus, Betula, Pinus and Ulmus) the pollen concentrations for most of the pollen types have been increasing. Furthermore, for Zurich (Frei 2008, Betula), Poznaň, Poland (Stach et al. 2007, Artemisia) and Vienna (Jäger et al. 1996, Alnus, Corylus, Betula, Pinus and Ulmus) the pollen season starts earlier, the daily maximum pollen concentration has increased (Frei 2008, Betula) and the days of peak pollen counts occur earlier (Stach et al. 2007, Artemisia).
Note that all taxa examined in the study are families or genera involving a number of species. Accordingly, analysing pollen season and phenological characteristics of a family or genus instead of given species involves a high variability of pollen season data. An observed trend in the above characteristics incorporates the variability of a given parameter for all species belonging to a given taxon, but this variability is influenced by meteorological variables. The important role of sunshine hours is stressed here, since its high values enhance pollen production (Valencia-Barrera et al. 2001, Kasprzyk and Walanus 2010). We found increasing trends (at 5% significance level) in the total solar radiation, relative humidity and wind speed. Temperature and rainfall do not display overall significant trends, but the smoothing of daily MK test values shows stages of positive and negative trends within the year for these latter two variables as well (Fig. 1).
Based on an association measure (AM) – introduced to characterise the strength of the relationship between annual cycles of daily slopes of pollen concentration trends and
those of climate variables trends – the individual taxa were placed into three categories according to their climate sensitivity defined by a multiple AM (MAM). These are: (1) high sensitivity: MAM > 0.950, involving 11 taxa (Artemisia, Cannabis, Alnus, Taxus, Rumex, Morus, Betula, Tilia, Chenopodiaceae, Pinus and Poaceae); (2) medium sensitivity: 0.900 <
MAM ≤ 0.950, including 5 taxa (Platanus, Plantago, Ulmus, Juglans and Quercus); (3) low sensitivity: MAM ≤ 0.900, comprising 3 taxa (Populus, Ambrosia and Urtica) (Table 3).
Risk potential (RP) and expansion potential (EP) due to climate change are compared to the MAM for each taxon (Tables 3, 4). The association measure alone cannot contain or express the climate change related indicators. However, all taxa having the lowest climate sensitivity (+) are non-endangered (*) and, except for Ambrosia, are characterized by a moderate EP. At the same time, for all endangered taxa (***) (even if just one species is endangered within a given taxon) MAMs indicate high sensitivity (+++).
Accordingly, the association measures follow well the climate change related indicators indicating that climate parameters are important elements of the environment for the taxa examined.
However, airborne pollen concentration can be influenced not only by current values of meteorological elements but their past values as well. As it is hard to distinguish between the effect of current and past values of the meteorological variables no attempt has been made to determine the relative weight of these two components in influencing the measured current pollen concentration. The procedure proposed here was performed only for Ambrosia, the most allergenic of all taxa considered. Current meteorological elements were characterized by actual values, while past meteorological elements by cumulative values of daily mean temperature, daily relative humidity, daily total solar radiation and daily precipitation total, respectively. These four elements were considered since ragweed pollen concentration displays a significant positive correlation with the daily mean temperature (Bartková-Ščevková 2003, Štefanič et al. 2005, Peternel et al. 2006, Puc 2006, Kasprzyk 2008), but it shows a negative correlation with the daily relative humidity (Bartková- Ščevková 2003, Puc 2006, Kasprzyk 2008). Daily mean total solar radiation is also found to be an important predictor of local ragweed pollen levels (Laaidi et al. 2003, Štefanič et al.
2005, Oh 2009). Ambrosia pollen grains are negatively correlated with rainfall (Barnes et al. 2001, Kasprzyk 2008), furthermore Déchamp and Penel (2001) found that heavy rainfall reduced the risk of ragweed pollen allergy. In order to assess the effect of the antecedent and current meteorological conditions on the current pollen concentration, the 1st-day, 2nd- day, … , 93rd-day values of both the pollen concentration and the four meteorological elements of the current pollen season were taken. (The duration of the ragweed pollen season in Szeged lasts from July 15 until October 15, namely 93 days.) Association between pollen concentration and the four meteorological variables characterizes the role of current weather conditions. Values of these meteorological variables were then cumulated for 272-day, 271-day, …, 1-day periods starting 272 days, 271 days, …, 1 day before the actual day of the actual pollen season. This is because there are 272 days between the end of the previous-year pollination season and the beginning of the actual pollen season.
Hence, altogether 272 data sets were produced and factor analysis with special transformation was performed for each of them.
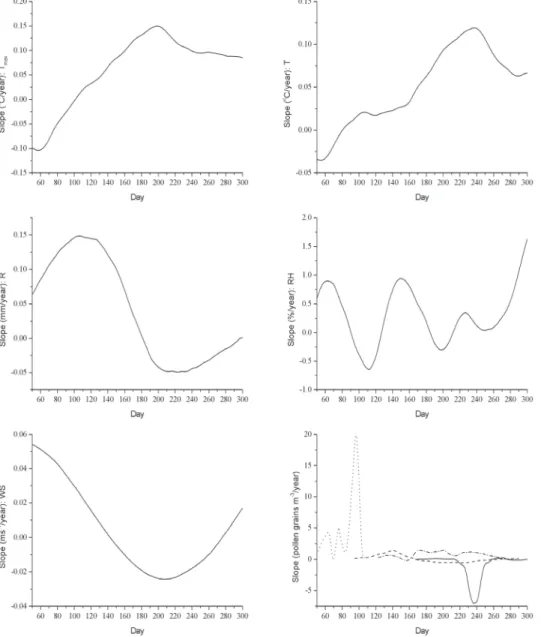
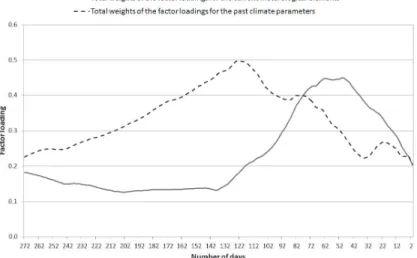
The main conclusions for Ambrosia as an example are as follows (Fig. 2). The total weights (summarized absolute values) of the factor loadings for the past meteorological variables (dashed line) are gradually increasing from day 272 until day 123 reaching a