DOI: 10.1556/606.2020.15.2.7 Vol. 15, No. 2, pp. 70–81 (2020) www.akademiai.com
TESTING OUTPUT VARIABLES FOR SENSITIVITY STUDY OF NONLINEAR VIBRATION SYSTEMS
1 Flóra HAJDU*, 2 Győző MOLNÁRKA
1 Department of Mechatronics and Machine Design
Faculty of Mechanical Engineering, Informatics and Electrical Engineering Széchenyi István University, Egyetem tér 1., H-9026 Győr, Hungary
e-mail: 1hajdfl@sze.hu, 2molnarka@sze.hu
Received 6 December 2019; accepted 17 January 2020
Abstract: In this study the detailed One-at-a-Time sensitivity analysis of nonlinear mass- spring-damper systems is carried out with numerical simulation. The degree of sensitivity was measured with a sensitivity index and based on its sensitivity Fuzzy-sets were established. The sensitivity of a parameter then can be expressed by the membership to the Fuzzy-sets. In this study the root mean square of acceleration, the maximum amplitude of acceleration and the peak frequency were chosen as output variables to measure sensitivity. With this research it was proven, that the root mean square of acceleration and the peak frequency can be used for sensitivity study of nonlinear vibration systems effectively.
Keywords: Sensitivity study, Numerical simulation, Nonlinear system modeling, Vibration
1. Introduction
One of the exciting areas in the study of nonlinear systems is the sensitivity analysis of parameters. It is used in numerous scientific fields like modeling of economic [1], chemical [2] and manufacturing processes [3], [4], examining environmental and agricultural engineering models [5]-[8]. It can be effectively used in medical research too [9]. Nowadays mechanical and vehicle engineering tasks can also be solved effectively with sensitivity study [10]-[16]. For example the comfort of a railway vehicle could be increased with sensitivity study of masses and damping coefficients [14].
* Corresponding Author
Its primarily aim is to examine how a system changes when its parameters are varied [17]. With detailed sensitivity study the behavior of the system can be understood better, especially in case of modeling new phenomena. A more effective design and development of products can be achieved, as the weak points of the system can be easily detected. A very smooth, optimal tuning of certain elements can also be achieved [16].
Sensitivity study can also be used for parameter identification [18] and inverse simulation [19] tasks and even the uncertainty of the system can be calculated [2]. H- infinity controllers are designed using sensitivity functions [20].
It can be seen that the applicability of sensitivity study is widespread, therefore there are several methods [21] (Fig. 1).
Fig. 1. Parameter sensitivity study methods (based on [20])
To begin with the research the One-at-a-Time (OaT) sensitivity study method was chosen. It is easy to implement and with fast computers a lot of parameter combinations can be examined really fast with numerical methods. However classical OaT sensitivity study is only used in a short examination range and only the most sensitive parameters with the highest sensitivity index are determined. To use the method in a higher examination range and to obtain the degree of parameter sensitivity more precisely Fuzzy-sets were established [22]. For effective study it is also important to select the proper variable or property to measure sensitivity. In this paper different output variables of nonlinear vibration systems are tested with a Fuzzy-set based OaT sensitivity study method developed in [23]. The aim of the research is to develop a widely and easily useable numerical examination method of nonlinear systems with special focus on mechanical and mechatronics applications and to make the design- development process more efficient.
2. Sensitivity analysis method
To begin sensitivity functions were created. Sensitivity functions show the change of a selected output variable versus the change in the examined parameter. The parameter
is sensitive, when a small change (1%) in a parameter changes the slope of the sensitivity function rapidly. Sensitivity is expressed with Sensitivity Index (SI), which can be calculated as the ratio between the relative change of the output variable (v) and the relative change of the examined parameter (p) [7]:
= [%]
[ %] . (1)
The following Fuzzy-sets and membership functions were established depending on the sensitivity index based on initial simulation results [23]:
1. not sensitive: ≤ 0.1 ∙ ;
2. moderately sensitive: 0.1 ∙ < ≤ 0.6 ∙ ; 3. sensitive: 0.6 ∙ < ≤ 2 ∙ ;
4. extremely sensitive: 2 ∙ < ,
where is the decimal place of the average values of the sensitivity function. The membership value of a selected parameter to the Fuzzy-sets is calculated as follows:
, (2)
where Ri is the length of the selected sensitivity Fuzzy set and R is the length of the entire examination range. After obtaining the membership value of each parameter to each Fuzzy-set the sensitivity of parameters can be compared easily. That parameter is the most sensitive, which has the largest membership value in Fuzzy-set 4.
In this research the sensitivity study of a simple Duffing-type vibration system was chosen as test case. Three different output variables were selected, which are the Root Mean Square (RMS) of acceleration, the maximum amplitude of acceleration and the peak frequency. These variables are widely used in vibration measurement and can be easily measured with acceleration sensors [24].
3. Sensitivity study of nonlinear vibration systems
3.1. Examined nonlinear vibration system
The examined nonlinear vibration system is shown in Fig. 2.
It was assumed that the spring has a Duffing-type restoration force, which can be expressed with the following equation:
= −!" − #"$. (3)
It was also assumed that the damping coefficient is a variable constant. The excitation signal was sinusoidal. The equation describing the system’s behavior can be expressed as follows:
%2
%&2"(&)' (
)
%
%&"(&)'*
)(−"(&) '1000 "(&)3)"(&)= ,sin(/&), (4) where m is the mass; c is the damping coefficient; k is the spring stiffness; A is the amplitude of the excitation signal and ω is angular velocity of the excitation signal. The
long-term aim of the research is the sensitivity study of vehicle suspension systems, therefore the initial parameters were selected according to a nonlinear suspension model
presented in [25]. The initial parameters are summarized in Table I.
Fig. 2. Examined Duffing-type vibration system
Table I
Initial parameter values
Parameter Name Value Unit
m mass 375 kg
k spring stiffness 35000 N/m
c damping coefficient 1000 Ns/m
A amplitude of the excitation signal 0.1 m
ω angular velocity of the excitation signal 10π/3.6 rad/s
The numerical simulations were carried out with Maple using ODE45 solver and 0.01 s interval [26], [27]. The simulation time was 50 s.
3.2. Using the RMS of acceleration
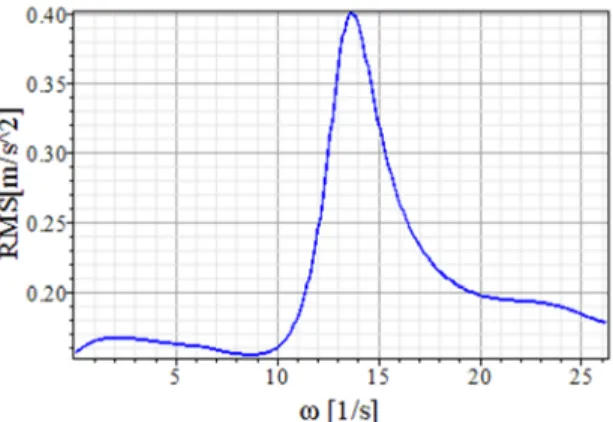
The detailed sensitivity study of a semi-active suspension system using the RMS of acceleration can be found in [23]. The parameters of the current study are based on that model, only the excitation signal was different. Therefore in this paper only the sensitivity function of the excitation signal is presented (Fig. 3).
It can be seen that the angular velocity in not sensitive in case of low (ω < 9 rad/s) and high (ω > 17 rad/s) values. If 9 rad/s < ω < 11 rad/s or 13.5 rad/s < ω < 17 rad/s it is moderately sensitive (SIavg=0.29). In case of 11 rad/s < ω < 13.5 it is sensitive with SI=0.76.
In [23] only the highest value of SI was examined and it determined the degree of sensitivity. In this study the method was extended with the membership to Fuzzy-sets (can be calculated using Eq. (2)), which is shown in Table II.
Fig. 3. Sensitivity of angular velocity of the excitation signal using the RMS of acceleration
Table II
Membership of parameters to sensitivity Fuzzy-sets (RMS of acceleration) Parameter SImax Fuzzy 1 Fuzzy 2 Fuzzy 3 Fuzzy 4
m 0.42 0.18 0.82 0 0
c 9 0.8333 0 0.1333 0.0333
k 0.53 0 1 0 0
ω 0.76 0.69 0.21 0.1 0
A 0.03 1 0 0 0
It can be seen that most parameters are not sensitive; their membership function to Fuzzy-set 1 is the highest. Only the damping coefficient has membership in Fuzzy-set 4 therefore it is the most sensitive parameter to the RMS of acceleration. However this value is small (0.0333), which means that the extremely sensitive range is small. This parameter has the highest value in Fuzzy-set 3 too. The angular velocity of the excitation signal is the other parameter, which has membership in Fuzzy-set 3, therefore it has a sensitive range. This is a parameter, which cannot be controlled, so particular attention should be paid to it. In [23] it was shown that the sensitivity of this parameter can be reduced by changing the value of the damping coefficient. The spring stiffness and the mass are moderately sensitive parameters; their membership value in Fuzzy-set 2 is the highest. The amplitude of the excitation signal is not sensitive at all; its membership value in Fuzzy-set 1 is 1.
3.3. Using the maximum amplitude of acceleration
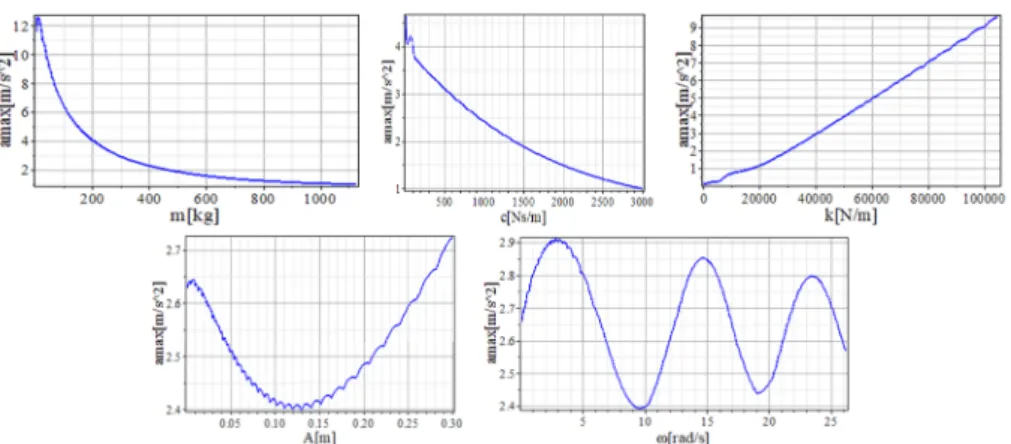
The sensitivity analysis results in using the maximum amplitude of acceleration as it is shown in Fig. 4.
It can be seen that the mass is extremely sensitive, when m < 7 kg with SI = 115.38.
It is the highest SI value of the examined parameters. The mass is sensitive when 7 kg < m < 200 kg (SI = 16.5) and moderately sensitive when 200 kg < m < 600 kg. In other cases this parameter is not sensitive.
Fig. 4. Sensitivity of parameters using the maximum amplitude of acceleration (mass, damping coefficient, spring stiffness, amplitude of excitation signal, angular velocity of excitation signal)
The damping coefficient is sensitive in case of low values (c < 40 Ns/m) with SI = 20. When 40 Ns/m < c < 120 Ns/m it is moderately sensitive with SIavg = 8.665. In other cases this parameter is not sensitive.
The spring stiffness is moderately sensitive in the entire examination range with SI = 3.17. The amplitude is not sensitive, SImax = 0.0286. The angular velocity of the excitation signal is not sensitive either, SImax = 0.79.
The membership to the Fuzzy-sets is summarized in Table III.
Table III
Membership of parameters to sensitivity Fuzzy-sets (maximum amplitude of acceleration) Parameter SImax Fuzzy 1 Fuzzy 2 Fuzzy 3 Fuzzy 4
m 115.38 0.468 0.3567 0.1721 0.0029
c 20 0.963 0 0.0368 0
k 3.17 0 1 0 0
ω 0.79 1 0 0 0
A 0.286 1 0 0 0
It can be seen that only the mass has membership in Fuzzy-set 4, therefore it is the most sensitive parameter. It has the highest SI value as well. However the value in Fuzzy-set 4 is low, it is only 0.0029, which means the extremely sensitive range is small. This parameter has a quite high membership value in Fuzzy-set 3 (0.17). This parameter therefore needs particular focus in design. It is the only parameter, which has membership value in all Fuzzy-sets. The damping coefficient has low membership value in Fuzzy-set 3 (0.037), which means the sensitive range is very small. The spring stiffness has a membership value 1 in Fuzzy-set 2, so it is moderately sensitive in the entire range. The parameters of the excitation signal (amplitude, angular velocity) are not sensitive at all; their membership value in Fuzzy-set 1 is 1.
3.4. Using the maximum peak frequency of acceleration
The sensitivity analysis results using the peak frequency of acceleration is shown in Fig. 5.
Fig. 5. Sensitivity of parameters using the peak frequency of acceleration (mass, damping coefficient, spring stiffness, amplitude of excitation signal, angular velocity of excitation signal)
It can be seen that the mass is extremely sensitive when it is low (m < 22 kg) or when 348 kg < m < 353 kg (SI = 22.6 and SI = 67.5). It is sensitive when 22 kg < m < 202 kg (SI = 7.92) and moderately sensitive when 232 kg < m < 348 kg (SI = 1.62). In all other cases this parameter is not sensitive.
The damping coefficient is extremely sensitive when 880 < c < 890 Ns/m with SI = 75. A sudden change in frequency can be observed in this case. This parameter is sensitive when 50 < c < 70 Ns/m (SI = 13.87) or 180 < c < 190 Ns/m (SI = 6.375). It is moderately sensitive in case of low values (c < 30 Ns/m), 100 Ns/m < c < 110 Ns/m or 380 < c < 390 Ns/m. In all other cases this parameter is not sensitive.
The spring stiffness is not sensitive, when it is low value (k < 36500 N/m).
Enlarging it there will be a sudden change in the peak frequency (36500 N/m <k < 36750 N/m) and the parameter becomes extremely sensitive with SI = 280. With further increase it becomes not sensitive almost the entire range except 2 short sensitive ranges, which are 57100 N/m < k < 57300 N/m (SI = 12.25) and 62600 N/m < k < 63000 N/m (SI = 8.75).
The amplitude of the excitation signal is not sensitive in the entire examination range, except a short range (0.088 m < A < 0.089 m), where it is extremely sensitive with SI = 7500. This is the highest SI value.
The angular velocity of the excitation signal is not sensitive till ω = 8.4 rad/s except short sensitive range (6.2 rad/s < ω < 6.4 rad/s with SI = 11.344) and moderately sensitive range (6.4 rad/s < ω < 7 rad/s with SIavg = 1.96) ranges. Increasing ω there will be a sudden frequency change when 8.4 rad/s < ω < 8.7 rad/s and the parameter becomes extremely sensitive (SI = 65.44). After that the peak frequency linearly increases as ω is increased and the parameter is moderately sensitive (SI = 1.39).
The membership to the Fuzzy-sets is summarized in Table IV.
Table IV
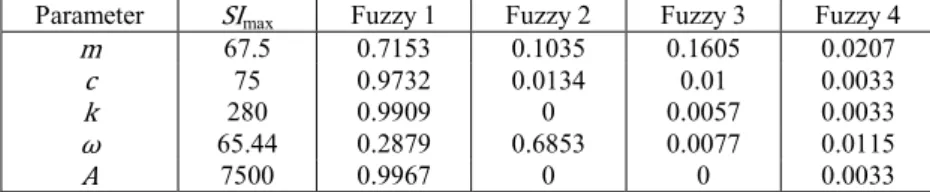
Membership of parameters to sensitivity Fuzzy-sets (peak frequency) Parameter SImax Fuzzy 1 Fuzzy 2 Fuzzy 3 Fuzzy 4
m 67.5 0.7153 0.1035 0.1605 0.0207
c 75 0.9732 0.0134 0.01 0.0033
k 280 0.9909 0 0.0057 0.0033
ω 65.44 0.2879 0.6853 0.0077 0.0115
A 7500 0.9967 0 0 0.0033
It can be seen that almost all parameters are not sensitive as the membership in Fuzzy-set 1 is the highest. However all parameters have membership in Fuzzy-set 4, therefore all parameters have extremely sensitive ranges. These ranges are small (membership value in Fuzzy-set 4 < 0.03) and are sudden changes in the frequency (see Fig. 5). Therefore this variable might be even be used for parameter identification tasks.
The mass, the damping coefficient and the angular frequency have membership in Fuzzy-set 3; therefore they have sensitive ranges as well. The sensitive range of the mass is relative high (0.16) and this parameter has the highest membership in Fuzzy-set 4 too, therefore it is the most sensitive parameter. The angular velocity of the excitation signal is moderately sensitive; it has the highest value in Fuzzy-set 2. Except a short extremely sensitive range the amplitude of the excitation signal and the spring stiffness are not sensitive. However the amplitude has the largest SI value, therefore that short extremely sensitive range should be paid special attention during design.
3.5. Comparison of results
Comparing the selected output variables in terms of their overall percentage to the Fuzzy-sets is shown in Table V. The overall percentage was calculated as follows:
:;=∑ =
>
?@
A 100%, (5)
where pi is the overall percentage to a Fuzzy-set, mi is the membership to a Fuzzy-set of a selected parameter and n is the number of parameters.
Table V
Variable membership dispersion
Variable Fuzzy 1 Fuzzy 2 Fuzzy 3 Fuzzy 4
RMS 54.066% 40.6% 4.666% 0.666%
Amax 68.629% 27.134% 4.178% 0.058%
fpeak 79.28% 16.042% 3.679% 0.845%
It can be seen that using the RMS of acceleration from the examined ranges 54.066% are not sensitive, 40.6% are moderately sensitive, 4.66% are sensitive and
0.666% are extremely sensitive. The parameters to this variable are either not sensitive or moderately sensitive. It has the highest percentage to moderately sensitive Fuzzy-set 2. This observation can be important in case of developing ultra-precision devices. It also has a relative high range to extremely sensitive Fuzzy-set 4, which is important to detect weak points.
Using the maximum amplitude has 68.629% to not sensitive range, 27.134% to moderately sensitive, 4.178% to sensitive and 0.058% to extremely sensitive ranges. It has the lowest value to extremely sensitive ranges and a relative high not sensitive range; therefore the parameters are not sensitive to this variable. The sensitive range has similar percentage to the other variables, therefore from the selected variables it seems the least suitable for further sensitivity studies.
Using the peak frequency has 79.28% to not sensitive range, 16.042% to moderately sensitive, 3.679% to sensitive and 0.875% to extremely sensitive ranges. It has the highest percentage to not sensitive ranges; therefore the parameters are not sensitive to this variable. However it has the highest percentage to most sensitive ranges, which is because of sudden frequency changes. Therefore this parameter can be used to test model accuracy and might be even useful for parameter identification tasks in the future.
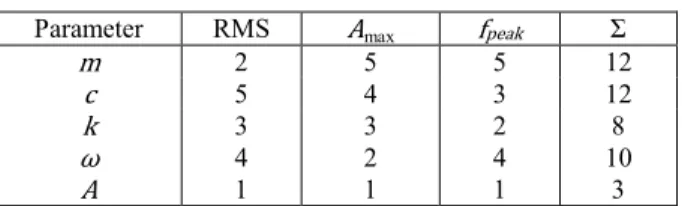
The sensitivity order of the examined parameters is summarized in Table VI. The parameter, which was the most sensitive to a selected variable (highest value in Fuzzy-set 4) got the largest number. When the membership value to Fuzzy-set 4 are the same the membership value to Fuzzy-set 3, then Fuzzy-set 2 are compared.
Table VI
Sensitivity order of the examined parameters
Parameter RMS Amax fpeak Σ
m 2 5 5 12
c 5 4 3 12
k 3 3 2 8
ω 4 2 4 10
A 1 1 1 3
It can be seen that the mass (m) and the damping coefficient (c) are the most sensitive considering the selected variables. The second most sensitive parameter is the angular velocity of the excitation signal (ω). The spring stiffness (k) is less sensitive and the amplitude of the excitation signal (A) is the least sensitive parameter.
Next step of the research is the sensitivity analysis of nonlinear suspension systems using the RMS of acceleration and the peak frequency. As first step the sensitivity analysis of a nonlinear semi-active suspension system based on [28] will be carried out.
The results are planned to be published in a separate paper.
The detailed sensitivity study of 21 different parameters of a fire truck suspension system using the half car model with nonlinear characteristics using the RMS of acceleration has been already accomplished [29]. It was observed that the nonlinear coefficient of the rear spring is the most sensitive parameter. It was also proven that
nonlinear phenomena cannot be neglected in case of vibration system and that accurate spring characteristics are necessary.
6. Conclusion and further research tasks
In this study the OaT sensitivity analysis of nonlinear vibration systems was carried out with numerical simulations using a novel Fuzzy-set based sensitivity method. Using a Duffing type vibration system 3 different output variable were compared, which are the RMS of acceleration, the maximum amplitude of acceleration and the peak frequency of acceleration. Based on numerical simulations it was observed that the RMS of acceleration and the peak frequency can be used for OaT sensitivity study effectively, they have quite a large membership in the extremely sensitive Fuzzy-set 4.
With the peak frequency parameter identification tasks seem to be solved as it clearly shows the sudden changes in the sensitivity functions. It was also shown that taking all the 3 sensitivity measures into account the mass and the damping coefficient were the most sensitive parameters and the amplitude of the excitation signal was the least sensitive parameter in case of a Duffing-type vibration system.
To continue the research there are several future tasks. The next step is the sensitivity study of a nonlinear semi-active suspension system using the RMS of acceleration and the peak frequency. An important task is to develop the presented OaT sensitivity method and use Fuzzy logic more effectively. As there are a lot of variables, especially in case complex systems a lot of numerical calculations are necessary. The calculation can be speedup with a parallel algorithm, the development of it is an important research task. In the future global sensitivity study methods are also planned to be used to gain a more detailed knowledge about the examined systems.
Acknowledgements
This study was supported by the ÚNKP-19-3-III-SZE-11 New National Excellence Program of the Ministry for Innovation and Technology.
Open Access statement
This is an open-access article distributed under the terms of the Creative Commons Attribution 4.0 International License (https://creativecommons.org/licenses/by/4.0/), which permits unrestricted use, distribution, and reproduction in any medium, provided the original author and source are credited, a link to the CC License is provided, and changes - if any - are indicated. (SID_1)
References
[1] Pannell D. J. Sensitivity analysis of normative economic models: Theoretical framework and practical strategies, Agricultural Economics, Vol. 16, No. 2, 1997, pp. 139‒152.
[2] Zádor J., Zsély I. Gy., Turányi T., Ratto M., Tarantola S., Saltelli A. Local and global uncertainty analyses of a methane flame model, The Journal of Physical Chemistry, A.
Vol. 109, No. 43, 2005, pp. 9795‒9807.
[3] Abbas A. A., Hussein M. A., Mohammad M. M. Design parameters estimation and design sensitivity analysis in manufacturing process of rubber pad by using finite element technique, International Journal of Mechanical & Mechatronics Engineering, Vol. 18, No. 3, 2005, pp. 75‒85.
[4] Andrisano A. O., Ansaloni M, Leali F., Pellicciari M., Vergnano A. A novel method for sensitivity analysis and characterization in integrated engineering design, Proceedings of the International Conference on Innovative Methods in Product Design, Venice, Italy, 15-17 June 2011, pp. 272‒279.
[5] Mouida A., Alaa N. Sensitivity analysis of TSEB model by one-factor-at-a-time in irrigated olive orchard, International Journal of Computer Sciences, Vol. 8, No. 3, 2011, pp. 369‒377.
[6] Khalid K., Ali M. F., Abd Rahman N. F., Mispan M. R. Application on one-at-a-time sensitivity analysis of semi-distributed hydrological model in tropical watershed, International Journal of Engineering and Technology, Vol. 8, No. 2, 2016, pp. 132‒136.
[7] Mamo K. H. M., Jain M. K. Runoff and sediment modeling using SWAT in Gumera Catchment, Ethiopia, Open Journal of Modern Hydrology, Vol. 3, No. 4, 2013, pp. 196‒205.
[8] Cattarin G., Pagliano L., Causone F., Kindinis A., Goia F., Carlucci S., Schlemminger C.
Empirical validation and local sensitivity analysis of a lumped-parameter thermal model of an outdoor test cell, Building and Environment, Vol. 130, 2018, pp. 151‒161.
[9] Gul R., Bernhard S. Local sensitivity analysis of cardiovascular system parameters, 10th International Conference on Modeling and Measurement in Medicine and Biology, Budapest, Hungary, 24-26 April 2013, Vol. 17, pp. 155‒167.
[10] Jung Y. Local sensitivity analysis of nonlinear models - Applied to aircraft vehicle systems, MSc Thesis, Linköping University, Sweden, 2009.
[11] Hamza S., Anstett-Collin F., Li Q., Denis-Vidal L., Birouche A., Basset M. Dynamic sensitivity analysis of a suspension model, 13th International Symposium on Advanced Vehicle Control, Munich, Germany, 13-16 September 2016, pp. 651‒656.
[12] Asamer J., Graser A., Heilmann B., Ruthmair M. Sensitivity analysis for energy demand estimation of electric vehicles, Transportation Research, Part D, Transport and Environment, Vol. 46, 2016, pp. 182‒199.
[13] Trišović N. Eigenvalue sensitivity analysis in structural dynamics, FME Transactions, Vol. 35, 2007 pp. 149‒156.
[14] Sharma R. C. Sensitivity analysis of ride behavior of Indian Railway Rajdhani Coach using Lagrangian dynamics, International Journal of Vehicle Structures and Systems, Vol. 5, No. 3-4, 2013, pp. 84‒89.
[15] Bigoni D., True H., Engsig-Karup A. P. Sensitivity analysis of the critical speed in railway vehicle dynamics, Vehicle System Dynamics, Vol. 52, Sup. 1, 2014, pp. 272‒286.
[16] Sert E., Boyraz P. Optimization of suspension system and sensitivity analysis for improvement of stability in a midsize heavy vehicle, Engineering Science and Technology, an International Journal, Vol. 20, No. 3, 2017, pp. 997‒1012.
[17] Farahat S., Ajam H. Sensitivity analysis of parameter changes in nonlinear hydraulic control systems, International Journal of Engineering, Transactions B, Applications, Vol. 18, No. 3, 2005, pp. 239‒252.
[18] Iwaniec J. Sensitivity analysis of an identification method dedicated to nonlinear systems working under operational loads, Journal of Theoretical and Applied Mechanics Vol. 49, No. 2, 2011, pp. 419‒438.
[19] Murray-Smith D. J. The application of parameter sensitivity analysis methods to inverse simulation models, Mathematical and Computer Modeling of Dynamical Systems, Vol. 19 No. 1, 2012, pp. 67‒90.
[20] Bansal A., Sharma V. Design and analysis of robust H-infinity controller, Control Theory and Informatics, Vol. 3 No. 2, 2013, pp. 7‒14.
[21] Hamby D. M. A review of techniques for parameter sensitivity analysis of environmental models, Environmental Monitoring and Assessment, Vol. 32, No. 2, 1994, pp. 135‒154.
[22] Baranyi P., Koczy L. T., Gedeon T. D. A generalized concept for fuzzy rule interpolation, IEEE Transactions on Fuzzy Systems, Vol. 12, No. 6, 2004, pp. 820‒837.
[23] Hajdu F. Sensitivity study of a nonlinear semi-active suspension system, Acta Technica Jaurinensis, Vol. 12. No. 3, 2019, pp. 205‒217.
[24] Brüel & Krajer, Measuring vibration, https://www.bksv.com/media/doc/br0094.pdf, (last visited 1 March 2019).
[25] Fakhraei J., Khanlo H. M., Ghayour M. Chaotic behaviors of a ground vehicle oscillating system with passengers, Scientia Iranica, Vol. 24, No. 3, 2017, pp. 1051‒1068.
[26] Maróti Gy. Investigating parameterized model of n-gonal wheel’s motion, Pollack Periodica, Vol. 6, No. 2, 2011, pp. 25‒36.
[27] Maróti Gy. Finding closed-form solutions of beam vibration, Pollack Periodica, Vol. 6, No. 1, 2011, pp. 141‒154.
[28] Litak G., Borowiec M., Friswell M. I., Szabelski K. Chaotic vibration of a quarter-car model excited by the road surface profile, Communications in Nonlinear Science and Numerical Simulation, Vol. 13, No. 7, 2008, pp. 1373–1383.
[29] Hajdu F., Molnárka Gy., Kuti R. One-at-a-time sensitivity study of a nonlinear fire truck suspension model, FME Transactions, Vol. 48, No. 1, 2020, pp. 90‒95.
![Fig. 1. Parameter sensitivity study methods (based on [20])](https://thumb-eu.123doks.com/thumbv2/9dokorg/787499.36622/2.892.205.620.386.607/fig-parameter-sensitivity-study-methods-based.webp)