1. ABSTRACT
Here we critically review studies that used electroencephalography (EEG) or event-related potential (ERP) indices as a biomarker of Alzheimer’s disease. In the first part we overview studies that relied on visual inspection of EEG traces and spectral characteristics of EEG. Second, we survey analysis methods motivated by dynamical systems theory (DST) as well as more recent network connectivity approaches. In the third part we review studies of sleep. Next, we compare the utility of early and late ERP components in dementia research. In the section on mismatch negativity (MMN) studies we summarize their results and limitations and outline the emerging field of computational neurology. In the following we
overview the use of EEG in the differential diagnosis of the most common neurocognitive disorders. Finally, we provide a summary of the state of the field and conclude that several promising EEG/ERP indices of synaptic neurotransmission are worth considering as potential biomarkers. Furthermore, we highlight some practical issues and discuss future challenges as well.
2. INTRODUCTION
Alzheimer’s disease is the most common cause of cognitive decline in the elderly creating significant medical and economic burden.
Approximately 47 millions of people live with
EEG and ERP biomarkers of Alzheimer’s disease: a critical review
Andras Horvath
1,2,3, Anna Szucs
1, Gabor Csukly
4, Anna Sakovics
1, Gabor Stefanics
5,6, Anita Kamondi
1,71
National Institute of Clinical Neurosciences, 57 Amerikai ut, Budapest, 1145, Hungary,
2Semmelweis University School of PhD Studies, Janos Szentagothai Doctoral School of Neurosciences, 26 Ulloi ut, Budapest, 1085, Hungary,
3Semmelweis University, Department of Anatomy Histology and Embryology, 58 Tuzolto utca, Budapest, 1094, Hungary,
4Semmelweis University Department of Psychiatry
and Psychotherapy, 6 Balassa utca, Budapest, 1083, Hungary,
5Translational Neuromodeling Unit (TNU), Institute for Biomedical Engineering, University of Zurich & ETH Zurich, Zurich, Switzerland.
Wilfriedstrasse 6, CH-8032 Zurich, Switzerland,
6Laboratory for Social and Neural Systems Research, Department of Economics, University of Zurich, Blümlisalp strasse 10, 8006 Zurich, Switzerland,
7
Semmelweis University Department of Neurology, 6 Balassa utca, Budapest, 1083, Hungary
TABLE OF CONTENTS 1. Abstract
2. Introduction 3. EEG studies in AD
3.1. Visual inspection and spectral characteristics of EEG in AD 3.2. Non-linear EEG studies in AD
3.3. Sleep-EEG studies in AD
3.4. Event-related potential (ERP) studies in AD 3.5. Mismatch-negativity (MMN) studies in AD and MCI
3.5.1. MMN in AD 3.5.2. MMN in MCI 3.5.3. Conclusions
3.5.4. Future directions – Computational neurology 4. EEG in the differential diagnosis of cognitive decline
5. Conclusions and Future perspectives
5.1. Experimental and analysis methods 5.2. Clinical studies
6. Acknowledgement
7. References
neurocognitive disorders worldwide, and this number is expected to triple by 2050 (1). Despite the huge efforts to find accurate treatment for AD, we are still not able to influence the progression of the disease. One of the reasons for this failure is that the pathological changes start decades before the initial clinical symptoms (2). The neuropathological hallmarks of AD are the presence of extracellular amyloid plaques and the intracellular neurofibrillary tangles composed of hyperphosphorylated tau protein. Growing body of evidence (3) suggests that the misfolded proteins might compromise the synaptic functions leading to severe network disintegration. Recent studies have illustrated that abnormal tau and amyloid could modify the pre- and postsynaptic neuronal mechanisms, elevate the neuronal calcium influx leading to increased excitability, neuronal loss and altered rhythmic patterns (4–6). Synaptic plasticity is essential in all complex cognitive functions such as learning, abstract thinking and memory (7). Evidence from recent neurophysiological and pathological studies suggests that impaired synaptic plasticity is a dominant feature of AD (8). Intact synaptic plasticity seems to be essential to normal neuronal oscillatory synchronization, which is thought to be the basis of information transfer at cell population level in the human brain underlying cognitive functions by functionally integrating a distributed network neuronal populations (9). Only recently, we begin to see how compromised network functions may affect motor activity, perception, or more complex cognitive functions like memory formation or decision-making.
The emerging view of neurological and psychiatric disorders as ‘‘oscillopathies’’ provides a new perspective that might help better understand clinical conditions (10). Based on these considerations, AD has recently been described as a network disconnection disease or as an oscillopathy (11).
Large-scale oscillatory neural population activity and event-related responses are often recoded using electroencephalography (EEG). EEG is a relatively cost-effective, non-invasive technique that provides in vivo data on electrical activity during neurotransmission with high temporal resolution. EEG has been successfully used in studying neurocognitive disorders, for example in schizophrenia (12), which has also been conceptualized as a dysconnection syndrome (13–14). Several characteristics of the EEG and event-related potentials (ERP) have been put forward as biomarkers in AD (15). Biomarkers are objective indicators of medical state that are sensitive and specific to a given pathology (16). Although a growing body of evidence indicates that EEG might be useful in the early recognition of neural signatures of dementia (17) as well as in the differential diagnosis of cognitive impairment (15, 18), this technique is rarely involved in the protocols of clinical assessment of cognitive decline.
Here we summarize the current knowledge on potential EEG and ERP biomarkers with respect to their importance in the diagnosis of AD, in early recognition of cognitive impairment, in differential diagnosis of neurocognitive disorders, and their relation to neuroimaging and neuropsychological findings.
3. EEG STUDIES IN AD
3.1. Visual inspection and spectral characteristics of EEG in AD
The conventional visual inspection of the EEG is still a widely used diagnostic method of neurological assessment (e.g., 19). The disappearance of posterior dominant alpha rhythm and the diffuse slowing in AD are easily detectable EEG signs for the experienced eyes. These changes have been reported in numerous previous studies even in patients with pathologically confirmed diagnosis (35 AD patients in the study of Brenner et al., (20)) and 72 patients in the study of Gordon et al., (21)). Strong correlation between visual EEG scores and dementia severity assessed by Mini Mental State Examination (MMSE) has been reported (22–23). In the study of de Waal et al. with 460 AD patients, subjects with early onset AD presented more severe diffuse slowing compared to the later onset counterparts, which is in line with the clinical presentation of AD (23). Based on these findings, the visual inspection of the EEG seems to be useful in the evaluation of AD.
Spectral analysis of EEG signals by Fourier or wavelet transformation has been widely used in the research of neurological and psychiatric disorders, including cerebrovascular disorders and epilepsy. Originally, the method was suggested by Roy John with the aim of the differential diagnosis of brain dysfunctions (24). Spectral methods estimate the power of selected EEG frequency bands, and the results are often evaluated with regard to their topographical distribution. Early spectral EEG studies revealed that a shift to lower frequency rhythms, i.e., a diffuse slowing of the EEG is a prominent feature of AD. Specifically, a reduction of power in the alpha (8–15Hz) and beta (16–31Hz) bands, as well as an increase in the theta (4–8Hz) and delta (0.5–4Hz) bands have been observed (25–26). Studies on higher frequency brain activity such as gamma oscillations yielded conflicting results (11). While Stam and his colleagues reported the loss of gamma band synchronization using magnetoencephalography (MEG) (27), other EEG (28–29) and MEG (30) studies found an increase in gamma power. Some studies indicate that in the diagnosis of AD the measurement of theta power could be as sensitive as the measurement of regional glucose metabolism by PET. In the studies of Szelies on 24 AD patients, the differentiation of AD and age matched healthy elderly using relative theta
power was correct in 86% while it was correct in 87%
when assessing temporo-parietal glucose metabolism (31–32).
It has also been shown that spectral changes show specific topographical distribution. Earlier studies with low sample size (12 and 8 AD patients) reported that the increase of lower frequency bands typically appeared over the left temporal area (33–34). The difference between mild AD and normal healthy controls seemed to be the most prominent in the temporal area, while comparing advanced AD patients with controls the difference was mainly related to the mid-frontal and anterior bifrontal areas (35). In a study involving higher number of patients (n=48) using low resolution brain electromagnetic tomography (LORETA), Babiloni and his colleagues demonstrated that patients with mild AD had a significant attenuation in the low alpha band in temporo-parietal and limbic sources compared to age-matched normal individuals (36). In the experiment of Kwak (37), the left anterior alpha power was lower in patients with a Clinical Dementia Rating Scale (CDR) value of 0.5, compared to cognitively normal elderlies. In CDR the 0 value represents the normal population, the 0.5 is very mild dementia, 1 is mild dementia, and 2 is moderate dementia, while 3 means severe dementia. Posterior theta power was increased bilaterally and power in all alpha bands was reduced in CDR 1 patients; while all alpha and beta power was reduced and the theta spectral power was increased in the CDR 2 patients; and alpha and beta spectral power was reduced and delta and theta spectral power was increased in the CDR 3 group (37). These changes are in line with the well-known pathological progression of the misfolded protein aggregation (38) suggesting that spectral alterations might indicate the severity of the disease (39).
Numerous studies with great samples have reported that spectral EEG measures showed a relationship to scores on common neuropsychological tests assessing cognitive functions. Significant correlation was revealed between the results of MMSE, Global Deterioration Scale (GDS), Addenbrooke Cognitive Examination (ACE) and qEEG parameters such as occipital peak frequency, reduction of alpha and beta spectral powers and increase in theta and delta spectral powers (37). In 69 subjects with mild cognitive impairment (MCI) and AD the delta power negatively correlated with MMSE scores, while alpha power showed a positive correlation (40).
The decrease in alpha power was also found to be correlated with scores in the Cognitive Subscale of the Alzheimer’s Disease Assessment Scale (ADAS-Cog) in a study with 130 patients (41). In the experiment of Claus et al. involving 82 patients, Cambridge Cognition Examination (CAMCOG) scores showed similar results (42). Only one early study reported a minimal or no correlation between the EEG and the
neuropsychological test results; however, this study examined dementia patients with different etiology including AD, frontotemporal dementia, multi-infarct dementia and alcoholic dementia patients. (43).
Correlations between EEG changes and neuroimaging findings have been reported in many studies as well. Global alpha and delta power showed a relationship to the volumetric changes of sub-cortical white matter in a study with 65 AD and 34 MCI patients (44), to the level of hippocampal atrophy in 35 AD and 88 MCI patients (45), to the grey matter density of the thalamus and basal ganglia in 88 MCI patients (46) and to the volume of cortical grey matter in 108 AD and 102 MCI patients (47). In an earlier study, qEEG (prominently the relative theta power) could predict dementia severity with similar power as PET markers (32). The combination of MRI, PET, P300 EEG analysis and spectral EEG power analysis increased the accuracy of dementia diagnosis by 10–20%
compared to a single diagnostic method (48). These findings indicate that qEEG might be useful to assess the severity and progression of AD (49).
Pathologic changes in AD are generally assumed to start several years before initial symptoms of cognitive deterioration appear (50). There is an urgent need to identify the disease in the prodromal or in the early clinical phases such as MCI. To address this, Jelic et al. studied spectral EEG properties in 27 MCI and 15 AD patients and found that the MCI group did not differ from the healthy controls in the baseline EEG measures. However, MCI patients had significantly lower relative theta power at the left temporal, temporo-occipital, centro-parietal and right temporo-occipital derivation compared to the AD group (50). In other studies with larger samples (69 MCI, 73 AD, and 64 control subjects), an increase in the relative theta-power and a decrease in alpha indicated well the conversion of MCI to AD. In LORETA studies, patients with MCI exhibited a reduction in centro-temporal, posterior delta and left anterior theta fields (51). In another study the same group found that amnesic MCI patients represent an intermediate stage between normal cognition and mild AD based on parietal and occipital power in the low alpha frequency band (47). A study by Huang et al. with 38 AD, 31 MCI and 24 control participants reported an anterior shift of the maximum alpha and beta power in AD compared to MCI (52).
Based on longitudinal studies with 39 patients, the increase of delta and theta power and the decline in the alpha and beta band power are the most important predictors of conversion from MCI to AD within 1- and 2-year follow-ups (53–54). EEG studies have also showed differences in genetic mutation carriers of AD without memory complaints compared to non-carriers.
Studies revealed that there is no difference between the apoE carriers and normal individuals; however, the presence of an apoε4 allele was associated with the
manifestation of synchronous high-voltage delta and theta activity as well as sharp-waves. Furthermore, hyperventilation induced significantly higher decrease in the alpha power and increase in delta-theta relative powers by the carriers in the studies of Ponomareva and colleagues involving altogether 572 individuals (55–58). Another study with 118 patients illustrated that apoε4 carriers show more frequent focal or global irregular slow wave activities after a traumatic brain injury (59). Interestingly, a recent study with lower number of participants revealed that patients (n=21) with presenilin-1 mutation show a significant decrease of the fast frequency bands prominently in the temporal regions compared to non-carriers even in the asymptomatic phase (60). These studies suggest that markers based on spectral EEG measures could be useful in the early identification of AD.
EEG studies on AD patients revealed that decrease in alpha power and increase in delta are the most prominent features of Alzheimer’s disease, showing a strong relationship to neuropsychological test results (40–42) and structural brain alterations (44–
47). Spectral changes in the delta and alpha band also indicate the conversion of MCI to AD (51). Theta power increase has also been suggested as a predictor for conversion of MCI to AD (51, 53). Reduced beta power has been reported in AD suggesting that it might be useful in the monitoring of MCI-AD conversion as well (37, 52). The changes of gamma band in AD and MCI are still ambiguous (27–30). These alterations together underlie the typical visual EEG appearance of AD, the diffuse slowing (23).
Simple measures of power at different frequencies fail to capture one of the most important features of the EEG signal, namely the dynamic coupling between the different oscillating populations. However, cognitive functions are supported by dynamic interactions between spatially separated but temporally coordinated brain networks. After the introduction of the disconnection theory by Delbeuck and his coworkers to dementia research, methods focusing on the measurement of functional connectivity between distributed brain areas have been applied more frequently in the field (61). The theoretical assumptions underlying these measurements is that rhythmic EEG activity in resting state reflect phase and/or amplitude coupling of oscillations in different neuronal populations.
Such measures provide information about functional integration and segregation between oscillating populations, captured by synchrony between the EEG signals recorded at various electrode pairs (62). Spectral coherence is thought to indicating functional coordination between two or more EEG generators (63). For example, higher coherence values have been observed between brain regions with higher interactions and stronger associations
during perceptual and motor processes (64). It has been postulated that cholinergic pathways play an organizing function and modulate coherence across distant brain areas (65). It is strongly supported by a study demonstrating that scopolamine with anticholinergic effect reduces the EEG coherence (66). Because of the structural damage of the generators and the involvement of cholinergic basal forebrain neurons in AD (67), coherence studies pointed out significant alterations. Major decrease in coherence in the alpha band has been demonstrated in several studies, particularly at the left temporal region (n=31 AD patients) (68), with significant correlation to neuropsychological results (n=34 AD patients) (69). Delta coherence studies revealed conflicting results (68), but a recent study by Babiloni and his colleagues showed that AD patients have higher delta ant theta coherence than normal controls (45). Global theta coherence increase was demonstrated in the study of Adler et al., but the interhemispheric theta coherence was significantly reduced (68). It should be noted that elevated delta coherence was also observed in MCI patients but in a lower extent compared to AD patients (70).
In summary, spectral power and coherence in different frequency bands might offer promising clinical tools for diagnosing AD, assessing the severity of cognitive decline, and they might contribute to early disease recognition (Table 1).
3.2. Non-linear EEG studies in AD
The basic concept of non-linear time series analysis of EEG rests on the assumption that the brain is a non-linear dynamical system thus its behavior follows the principles of chaos theory (71). EEG captures the large-scale spatio-temporal dynamics of electromagnetic fields in the brain which are thought to be generated by non-linear coupling interactions between different neuronal populations. According to Stam the trajectory of a non-linear dynamical system is determined by its initial state and the history of its evolution. It can be argued that such a system possesses memory since its current state is dependent on previous states (62). The first studies on non-linear dynamical properties of EEG have been published in the 80’s and focused on primate spontaneous EEG and human sleep EEG (72). In the following years, a revolution took place in the field of non-linear EEG analysis focusing on modeling non-linear neuronal dynamics and on the development of new methods with the aim to analyze noisy, non-stationary and high- dimensional EEG. Numerous methods have been developed including non-linear forecasting, non-linear cross prediction, and dimension density; many of the novel methods relied on embedding the EEG time series in a multidimensional state-space and observing
different properties of resulting trajectories. For an exhaustive review see Stam (62).
It is well known that the pathological changes in AD affect not only specific brain regions but neural pathways between the major areas as well (73). Non- linear methods are commonly used in the research of AD comparing it to other psychiatric conditions, because of the widely accepted disconnection syndrome theory (59).
Correlation dimension (D2) is one of the most commonly used non-linear EEG parameter in AD research. D2 is a measure of the assumed independent variables that are required to precisely define the complexity of cortical dynamics reflected in the EEG signal. An early study with 21 AD and 29 MCI patients has shown that AD patients have lower D2 values almost on every EEG channel suggesting a globally reduced complexity of the electric brain activity in AD (74). Normal elderly have significantly increased D2 values in eyes-open state compare to eyes-closed state, while the difference disappears in AD, suggesting the loss of brain reactivity to external stimuli in AD (75). Further studies pointed out decreased complexity even in eyes-closed state in 15 AD patients compared to normal controls (76). These studies aimed to characterize the EEG in a global frequency range; however, the separate frequency bands are thought to represent different brain dynamic systems (26). Numerous studies investigated the complexity of EEG in different frequency ranges or multiple time scales. They identified higher D2 at higher frequency ranges in 20 AD (77) and 17 AD patients (78), while lower values have been demonstrated in the low frequencies. Yosimura and colleagues investigated mild AD patients with the so-called omega complexity method and found high complexity in a wide range of frequencies similarly to the findings of Czigler and colleagues involving 12 AD patients (78–
79). Omega complexity estimates the number of the independent, uncorrelated brain sources. Thus, these studies suggest the functional disintegration of cortical networks, with lower coherence between sources and a higher number of independent generators. A
decrease in the parameter that reflects flexibility of information processing, the so-called first positive Lyupanov exponent (L1), has been also reported in some studies (27), which may represent a difficulty to enter different states from the initial one during information processing in AD.
Some new methods, such as multiscale entropy (MSE) have been implemented in the recent years enabling to investigate the complexity of dynamic biological signals across a long-range of temporal scales. These studies in 11 AD patients (80) as well as 26 AD and 22 MCI patients (81) found that AD patients had less complexity at smaller temporal scales related to higher frequency bands and higher complexity at larger temporal scales regarding lower frequency bands (80–81). Higher complexity in large temporal scales was strongly associated to the extent of cognitive decline. Studies of global range complexity yielded diverging results. However, different frequency bands correspond to different brain functions (82).
While higher-frequency bands are thought to support local neuronal communication in smaller neuron groups with short-range neural connectivity, slower oscillations likely arise from larger populations within wider-range networks (83). Although finding a physiological interpretation of complexity measures obtained with methods motivated by dynamical system theory is not straightforward, these results are in line with the notion that AD is characterized by a disruption of integration and segregation within distributed brain networks (61).
Complexity measurements have shown a strong correlation also with results of neuropsychological tests. Lower global dimensional complexity was associated with lower MMSE scores in 21 AD patients (74). The estimated severity of the disease also showed a strong relationship to non-linear measures in the study of Besthorn involving 50 AD patients (84). Region-specific changes were observed in the study of Ikawa et al., where a strong association was found between the reduced dynamical complexity (DC) in the mid-temporal, left frontal, central areas and cognitive status in 25 AD patients (85). In the same
Table 1. Changes in spectral power and phase coherence of different EEG bands in AD, MCI and preclinical
stages of AD
EEG band Spectral power and phase coherence
in AD Spectral power and phase coherence
in MCI Spectral power and phase coherence
in preclinical AD
Gamma IC IC DNA
Beta ↓↓ ↓↓↓ ↓↓
Alpha ↓↓↓ ↓↓↓ ↓↓↓
Theta ↑↑ ↑↑ ↑
Delta ↑↑↑ ↑↑ ↑↑↑
The number of arrows indicates the number of studies reporting concordant results: ↑ = 1–5 studies ↑↑ = 5–10 studies ↑↑↑ >10 studies. DNA = data not available; IC = inconclusive results.
study a correlation has been found also between verbal memory performance and DC values at post- temporal, left-central and parietal regions. Interestingly, in the early phases of AD, increased predictability and reduced complexity are predominantly visible in frontal and temporal areas (76).
Using the relatively new measures of mutual information (MI) and synchronization likelihood (SL), it has been demonstrated that the interdependency between the distant electrodes, especially between the frontal and temporal regions, between the frontal and parietal and between the hemispheres are reduced (26). Significant decrease in the SL of beta and high alpha band was also indicated in the study of Stam with 24 AD patients, where SL of both frequency bands had a strong correlation to the MMSE scores (86), while the gamma band was not affected. Babiloni and his colleagues obtained similar results in MCI; namely they found reduced SL in the delta band in 109 AD and 88 MCI patients with fronto-parietal dominance (87). Phase lag index (PLI) measurements revealed frequency dependent results in 18 AD patients; in the theta band patients showed higher whole-brain PLI and in the alpha band lower whole-brain PLI compared to patients with subjective cognitive decline (88).
Concluded minimum spanning trees (MSTs) analysis from PLI suggested that global efficiency loss was defined mostly by the parietal and occipital loss of network organization (89).
Overall, results suggest that earlier alterations in neural dynamics can be identified with spectral analysis methods which can identify more precisely the early stages of Alzheimer (75). However, the combination of spectral and state-space methods proved to be highly sensitive in the early recognition of cognitive decline (62).
New methods derived from the mathematical framework of graph theory have recently become
popular in EEG analysis. Graph theory is used to describe network connectivity from EEG data. Nodes in the network often correspond to electrodes, and some measures of connectivity between electrode pairs are used to characterize edges (90). The nodes which receive more inputs and have more connections are referred to as hubs. Human cognition seems to be strongly related to the efficacy of the integration of different brain nodes. The normal human large-scale functional connectivity network can be described as a small-world network, with numerous local connections between adjacent nodes and a few but prominent connections between distant regions, which together lend high clustering and short path lengths to the network (91). Recent studies revealed that small-world like network properties of are replaced by random-world characteristics in AD.
Studies demonstrated that AD patients (n=18) have a prominent decrease in the characteristic path length, degree correlation and mean clustering coefficient of delta and gamma band activity indicating severe loss in the local and global connectivity parameters (86,90). These findings were corroborated by MEG and fMRI studies as well including 18 (92), 20 (93), 21 (94) and 14 AD patients (95).
In summary, current EEG network analysis methods provide a promising new strategy for the diagnosis of AD and studying disease progression, and open a fresh view to cognitive decline from a network based perspective. State-space approaches seem to be also promising tools for the early recognition of MCI, especially when combined with spectral methods (Table 2).
3.3. Sleep-EEG studies in AD
Major neurocognitive disorders including Alzheimer’s disease as well as MCI are characterized with disturbed sleep. Growing evidence suggests that sleep disturbances precede the clinical onset
Table 2. Different EEG analysis techniques motivated by dynamical systems theory show variable complexity
measures across studies in AD
Measured parameter Measured change Study and number of patients included
Correlation dimension (D2) Global decrease, increase in higher frequency bands,
decrease in lower frequency bands Yagyu et al. (74), n=21 AD- 29 MCI patients van Walsum et al. (77), n=20 AD patients Yoshimura et al. (78), n=17 AD patients
Omega complexity (OC) Global increase Yoshimura et al. (78), n=17 AD patients
Czigler et al. (79), n=12 AD patients
Global complexity (GC) Global decrease Besthorn et al. (84), n=50 AD patients
Multiscale entropy (MSE) Increase in higher frequency bands, decrease in lower
frequency bands Park et al. (81), n=26 AD- 22 MCI patients
Escudero et al. (80), n=11 AD patients
Dynamical complexity (DC) Global decrease Ikawa et al. (85), n=25 AD patients
While studies with spectral and other non-DST methods involve relatively large number of subjects, studies with non-linear methods are limited, recruit remarkably lower number of AD patients and show inconclusive results. DST methods might be useful for the early recognition of MCI; however, combination with other methods is recommended.
of cognitive decline in AD by years. A sleep-wake disturbance of clinical importance is found in up to half of the patients with dementia, and sun-down agitation is a frequent cause of institutionalization of demented patients (96). The circadian rhythm of dementia patients is disturbed with daytime sleepiness and disrupted night sleep. Whereas sleep changes may be severe in several types of dementia, a clinically significant sleep disorder usually develops only in the late phase of Alzheimer’s disease (97-98).
Sleep transforms in many ways during healthy aging. Changes include reduction in the proportion of slow wave sleep (SWS) and sleep slow wave activity (SWA), the number and amplitude of sleep spindles as well as the density of rapid eye movements (REM) and the amplitude of circadian rhythms. With MCI there are further reductions of these parameters and all deteriorate further with the conversion to AD (99).
Progressive changes in the quality, architecture and neural regulation of sleep may contribute to cognitive decline (100). The sleep profiles of patients with dementia of diffuse Lewy body and AD are different;
which may have diagnostic importance (101).
Sleep pathology appears to be essential component of AD pathophysiology. Noticeably, sleep deprivation compromises cognitive and executive functions such as memory, attention, and response inhibition. In mice studies sleep deprivation impaired the mice’s long-term and remote memory, even a month after the sleep deprivation session (102). The negative impact of sleep loss on memory has also been shown in patients with sleep disorders. Impairments of sleep- dependent memory consolidation for verbal and visual declarative information were found in patients with primary insomnia, for verbal declarative information in patients with obstructive sleep apnea, and for visual procedural skills in patients with narcolepsy-cataplexy (103). Conversely, increasing the amount of SWS and SWA by an anti-inflammatory agent in healthy humans improved memory consolidation (104). The positive cognitive effect of sleep slow waves was also shown in a transcranial slow oscillatory stimulation study where stimulation was applied during the afternoon naps of elderly individuals. The transcranial stimulation considerably increased frontal SWA significantly improving visual memory retention after sleep, but not retention in the location memory subtask and in the verbal memory task (105).
Changes in sleep microstructure have been observed as well in AD. Several studies have identified two types of sleep spindles: fast (13–15 Hz) centro- parietal and slow (11–13 Hz) frontal spindles. AD and MCI patients have shown a significant decrease in parietal fast spindle density, which positively correlated with their loss in MMSE scores (106). Fast spindles are involved memory consolidation as enhancing
sleep spindles with non-invasive brain stimulation in humans was found to significantly improve motor memory consolidation which correlated with the stimulation-induced increase of fast spindle activity (107).The impact of both slow and fast spindles on re- presentation learning has been shown in an odor re- exposure experiment (108).
Increased cerebrospinal fluid orexin levels were found causing sleep deterioration, which appeared to be associated with cognitive decline (109). The orexinergic system may be dysregulated in AD, while the role of orexin in memory function has remained controversial (110). Mice-experiments have shown an association of the amyloid-beta (Aβ) peptide and mitochondrial dysfunction, supporting a primary role for mitochondrial Aβ in AD pathology.
Mitochondrial Aβ peptide levels were strongly negatively associated to the scores of cognitive tasks in an AD transgenic mice model experiment, indicating that amyloid could compromise the cognitive functions via the altered the mitochondrial signaling system. The degree of cognitive impairment in AD transgenic mice can be linked to the extent of synaptic mitochondrial dysfunction and mitochondrial Aβ peptide levels, suggesting that a mitochondrial signaling cascade induced by Aβ may contribute to cognitive impairment (111). Further, chronic sleep deprivation caused mitochondrial dysfunction in the frontal cortex of mice and a significant mitochondria-related Aβ increase in this cortical region suggesting that chronic sleep deprivation-induced mitochondrial dysfunction might be related to frontal mitochondria-related Aβ accumulation, preceding Aβ deposition in any other frontal cortical regions (112). These findings and the strong link of sleep-disruption in AD indicate a strong link between AD and sleep (113). It has been shown that insufficient sleep facilitates the accumulation of Aβ (114), potentially triggering earlier cognitive decline and conversion to AD (115). The sleep-wake cycle influences brain Aβ levels, and sleep deprivation increases the concentration of soluble Aβ leading to its accumulation, whereas sleep extension has the opposite effect (116). Furthermore, Aβ accumulation leads to increased wakefulness. Individuals with still normal cognitive functions and early Aβ deposition, report sleep abnormalities, similarly to mild dementia patients with incipient AD. Thus, sleep deprivation and AD may mutually amplify each other (117–118).
FMRI results suggest that the mechanism of the decline in short-term memory observed after acute sleep restriction is linked to the disruption of hippocampal-cortical connectivity (119). Age-related medial prefrontal cortex grey matter atrophy was associated with reduced non-REM SWA in older adults, correlating with the degree of the impairment of sleep-dependent memory retention. This memory impairment was associated with persistent
hippocampal activation and reduced task-related hippocampal-prefrontal cortex functional connectivity, potentially causing compromised hippocampal- neocortical memory consolidation. Thus it seems that the age-related medial prefrontal cortex atrophy diminishes SWA, resulting in impaired long-term memory (120). In a human and monkey neocortical microelectrode array study, the state of SWS was associated with the highest coherence values in beta and gamma bands across the width of the neocortex, supporting the idea of the SWS-related memory consolidation (121). Aβ-burden in the medial prefrontal cortex correlates with the impairment in non-REM SWA generation, which in turn is associated with sleep memory consolidation deficits during hippocampal- neocortical memory transfer. The association of the medial prefrontal cortex Aβ pathology with a deficit in hippocampus-dependent memory consolidation was indirect as it depended on the intermediary factor of decreased non-REM SWA. These findings suggest that amyloid deposition could compromise the sleep- dependent memory consolidation via the disruption of the SWS (120).
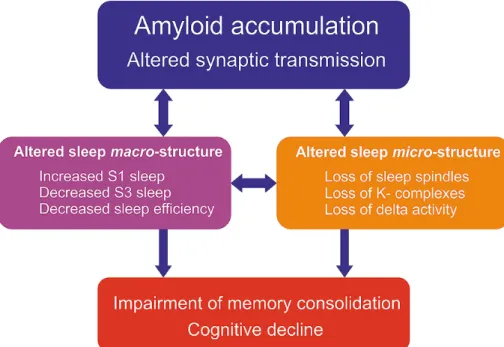
In summary, changes in macrostructural parameters of sleep EEG indicate that alterations in sleep are prominent and early features of AD. However, further studies are required to examine the microstructural features including the sleep spindles, K-complexes, cyclic alternating patterns and high frequency oscillations.
These microstructural features might reveal novel aspects of AD-related memory impairment and open new ways to understand how amyloid and tau could lead to cognitive decline (Figure 1).
3.4. Event related potential (ERP) studies in AD ERPs are electrical potential generated by the brain time-locked to a sensory, cognitive, or motor event (123124) and originate from summed excitatory and inhibitory postsynaptic potentials (EPSPs and IPSPs, respectively) produced by synchronous firing of a large number of cortical pyramidal neurons with similar spatial orientation (125). The ERP technique usually involves averaging brain responses over a large number of experimental trials to increase signal-to-noise ratio. The resulting waveforms are informative about the time course of sensory and cognitive processes with high temporal resolution and provide coarse spatial information about the location of the generating structures. ERPs allow us to study neural correlates of information processing including sensory-motor and perceptual processes as well as higher cognitive operations such as decision making.
Furthermore, ERPs provide safe, noninvasive, easily accessible and cost-effective (126) readouts of synaptic neurotransmission which potentially make ERPs an ideal tool to assess cognitive processes in AD. In contrast to neuropsychological tests ERPs are
not influenced heavily by cultural background and educational level (127). As discussed above, there is a consensus in the field about AD being primary a disorder of synaptic plasticity (128).Given that ERPs are generated mainly by summated EPSPs and IPSPs, they may provide an ideal tool to probe synaptic dysfunction (129). In this section, we present an overview of the major ERP components and their relevance in Alzheimer type dementia.
Early ERPs (P50, N100 and P200) peaking roughly within two hundred milliseconds after stimulus onset are considered exogenous sensory components representing sensory processes as they depend mainly on the physical parameters of the stimulus, nevertheless they have been associated with attention as well (130). Although the prevailing view is that early ERP components are mostly unaffected, and therefore they are not ideal biomarkers in AD (131), a genetic study by Golob et al. showed significantly longer latencies for the N100, P200 components among familial AD (FAD) mutation carriers (132).
Moreover reduced N100 amplitude was found in patients with sporadic or familial AD (133–135) and other abnormalities, including delayed latency of the P200 component have also been reported (136–137) indicating that early sensory-cognitive processes might be compromised in AD.
The N170 is a visual ERP component that is widely used in face perception research (e.g. 138).
N170 amplitude is generally reported to be larger and more right-lateralized in response to faces than to other objects (139). A decrease in N170 amplitude has been reported in patients with AD (140–141). Although in a recent study Schefter et al. found no differences in N170 amplitude between neurotypical controls and aMCI patients, they have found a delayed N170 latency in the MCI group (142) which is in line with compromised face processing in AD (143).
The N200 is a scalp negative waveform, which is evoked approximately 200ms after stimulus presentation. N200 is elicited by a novel infrequent stimulus during an oddball paradigm (usually investigated together with P300 component), and generated in fronto-central cortical areas (144). N200 is the earliest ERP that differentiates between target and non-target events, and it behaves functionally similar as the P300 wave. The N200 component is thought to represent automatic cognitive processes, such as pre-attentive stimulus evaluation and discrimination and is affected by stimulus probability. The N200 is sometimes further partitioned into three distinct subcomponents: the N2a, N2b, and N2c waves. The N2a is often referred to as mismatch negativity (MMN) component which we further discuss in the next section. In general, the N200 is sensitive to normal aging, as decreased amplitude and prolonged latency
is observed with age (145). Although it has been less extensively studied in AD, a few prior studies (usually investigating P300 and N200 component together) have found delayed N200 latency in AD patients compared to healthy aging (127, 137). Moreover Howe et al. in a recently published meta-analysis of 16 studies also demonstrated severe prolongation of the N200 latency in patients with AD and MCI compared to normative aging (126). This alteration seems to appear in the early course of the disease, suggesting that N200 latency changes could reliably predict MC/early ADI, and the conversion from MCI to AD. The predictive value of N200 latency delay has been improved by its combination with other biomarkers, such as amyloid-b 42 or CSF cytochrome c and also by a novel N2-P3 inter-peak index reported by Papagliakas et al. that incorporates alterations in N200 and P300 latencies and amplitudes into a single parameter (146–147).
Latency changes in AD have been associated with deterioration in attention processing and short-term memory processing, stimulus evaluation, and also in stimulus discrimination (123, 148). Furthermore N200 amplitude was found to be more sensitive in the early stages of AD, than P300 latency (147). In addition, prolonged latency was also found among FAD mutation carriers (132) and according to Vaitkevicius and colleagues the N200 subcomponent is less influenced by cholinergic treatment compared to the P300 component, therefore it may reflect the progression
of AD more independently from cognitive-behavioral effects produced by cholinesterase inhibitors (ChEIs) (149). To conclude, alterations in latency of the N200 component might be sensitive enough to differentiate patients with MCI and early AD from healthy controls as well as to predict conversion from MCI to AD (126,147). Nevertheless, more research is required with larger samples to determine reference values for N200 latency and amplitude for the differentiation of AD and MCI.
The P300 component has the longest history in clinical applications and it is the most extensively used potential to study dementia and aging. It is an objective index of cognitive activities, and in particular memory and context updating processes. The P300 is a relatively large (10–20 μV), scalp-positive ERP component that peaks around 250ms to 500 ms) elicited by auditory, visual, or somatosensory stimuli (150). The P300 is most often investigated using the so-called “oddball” paradigm where a train of frequent irrelevant (standard/nontarget) stimuli is interspersed with random infrequent task-relevant (target) stimuli that have to be detected, and with infrequent task- irrelevant distracter stimuli (novelty) (151). The two rare stimulus types elicit two different ERP components;
the slightly earlier positive deflection called P3a is elicited by the distracter (task-irrelevant) stimulus followed by the later P3b subcomponent elicited by
Figure 1. The multiple vicious circles of sleep loss and cognitive decline. Amyloid accumulation is the earliest and most prominent pathological hallmark of AD. Amyloid-induced synaptic transmission changes are well known from human and animal studies as well (6). Therefore, amyloid deposition is associated with altered sleep macro- and microstructure as well (122). The presence of amyloid seems to have a direct effect on sleep regulation leading to changes in the general sleep macrostructure (fragmented and superficial sleep, loss of slow-wave sleep) (99–101). Microstructural changes have been demonstrated as well (106) including decreased sleep delta power and diminished sleep spindles and K-complexes. Since these elements are essential for memory consolidation (108), cognitive functions are thought to be compromised directly by altered sleep and indirectly through to the impaired amyloid clearance mechanisms (122). There might be a bidirectional link between amyloid deposition and sleep fragmentation; impaired sleep might lead to increased amyloid burden (114–116), while amyloid accumulation compromises sleep regulation leading to altered macro- and microstructure (117–118).
the target (task-relevant) stimulus (152). The P3a has frontocentral scalp topography whereas the distribution of P3b is maximum over midline centroparietal electrode sites (153).Target-related responses are thought to be generated in the parietal cortex and the cingulate whereas novelty-related responses in the inferior parietal and prefrontal regions (154), which also reflects interactions between the frontal lobe and the hippocampus (152). Regarding neurotransmitter systems, P3a shows strong association to the frontal/
dopaminergic circuits whereas P3b is linked to the parietal/norepinephrine pathways (152). P300 originates from a distributed network associated with attention and working memory processes. It is generally assumed that the P300 component reflects the completed encoding of stimulus information into working memory (155). The P3a (involved in automatic novelty detection) has been linked to attentional processes and presumed to be an electrophysiological correlate of the orientation, whereas the P3b (associated with voluntary target detection) appears to be related to working memory and context updating processes (156). P300 amplitude increases with lower probability and higher discriminability of targets, and it is influenced by stimulus probability and saliency as well as availability of attentional resources (157). P300 amplitude correlates with memory performance, in the cognitively unaffected biological children of AD patients smaller amplitudes are related to decreased brain activation and lower scores in cognitive tests (158).
P300 latency generally increases with the complexity of the stimulus evaluation and decision processes demanded by the task and indicates the closure of stimulus processing (152) as well as response selection (159). It appears to be also correlated with the agility of mental functions, thus a lower P300 latency is associated with superior cognitive performance (160) and reaction times (161). P300 is relatively independent of physical characteristics of the sensory input (157). Furthermore, the amplitude, latency and scalp topography of the P300 are modulated by a variety of factors that also tend to influence cognition, such as age (162), learning (163), substance use (164), pharmacological interventions (165), exercise (150) and diseases, particularly mental illnesses (166). P300 is sensitive to normal aging, as its latency increases in a linear fashion with 1 to 2 msec/y (167).
Its topography tends to shift frontally with age (161) and its amplitude is progressively decreasing (168).
In general, several previous studies consistently reported a prolonged P300 latency in AD patients compared to age-matched healthy controls (for review see 169). P300 latency has been highly correlated with the severity of cognitive deficits in AD.
Its latency increases as cognitive abilities decrease (170); in particular it was found to be sensitive to deterioration of language, memory, and executive functions (171). Although the majority of P300 studies
in AD focused on its latency, changes in its amplitude have also been found (172). A meta-analysis and meta-regression by Hedges et al. in concluded that the amplitude of the P300 component after an auditory or visual oddball stimulus was also significantly lower in probable Alzheimer’s disease than in healthy controls (173). Moreover several recently published studies showed sensitivity and specificity above 80% (174).
Studies that have differentiated between P3a and P3b latencies, reported more prolonged P3a latency in AD (126, 174). Also prolonged P300 latency has been reported in patients with MCI compared to healthy controls, and shortened P300 latency when compared to patients with AD. Two recent meta-analyses of these findings reported strong evidence that P300 latency can reliably differentiate between groups of MCI patients and controls (126, 175). Moreover Jiang et al.
showed shorter P300 latency and larger amplitude in stable MCI patients compared to AD converters, and they suggested that P300 measures can predict MCI progression to AD (175). Furthermore, delayed P300 latency has been associated to positive cognitive response during cholinesterase inhibitor (ChEI) administration (131, 149). P300 latency has followed the same dynamics as the cognitive functions: initial improvement after 3 months of treatment, plateau phase of several months, and the gradual decrease after 6–12 months and later (150).The pre- and post- treatment latency differences were also correlated with cognitive ability and memory performance (131, 170, 176–177). Increased P300 amplitudes were found among normal subjects with first degree relatives of autopsy confirmed AD cases (178). An association has been revealed with genetic mutations, P300 latency of subjects carrying the apolipoprotein E (APOE) 4 allele (E4+) and with a positive family history of AD has been significantly longer than those of negative family history (155, 173–179). Furthermore, familial AD mutation carriers had significantly longer P300 latencies, which, together with other ERP abnormalities appear approximately 10 years before dementia manifestation (132). P300 changes have been shown to be positively correlated with neuropsychological test scores used in AD, such as the Trail Making Test Part B (TMT-B), the Wechsler Memory Scale, and digit span test that assess executive and working memory functioning.
Furthermore Lai et al. suggested that P300 latency might be even a more sensitive index of cognitive decline than neuropsychological testing according to a longitudinal follow-up study in AD (170). Regarding variations in oddball protocols, a recent review of P300 studies in AD concluded that while the P300 assessment methodology is consistent across studies, the intensity, duration and type of stimuli, as well as the inter-stimulus interval and also the target-related task vary substantially among the studies (169).
In summary, P300 is associated with memory and cognition which are impaired in AD, which is in line
with the fact that presumed generator sites (centro- parietal cortex, frontal cortex, and hippocampus) are usually also affected in AD.P300 latency and also amplitude abnormalities have been suggested as sensitive tools to detect cognitive decline in patients with AD. P300 changes appeared to be objective and sensitive measures for discriminating subjects with MCI from controls and AD patients; moreover changes in P300 might be useful in the detection of the transition from MCI to AD. Furthermore, genetic studies found P300 abnormalities even in preclinical AD while subjects are in an asymptomatic stage.
Pharmacological studies indicate the P300 latency could also be useful in quantifying the effect of the central nervous system’s (CNS) response to medication.
Deviations in congruency expectations about meaningful stimuli such as words elicit the N400 event related potential which has been widely used as an index of lexical and semantic processing (180). Deficits in language and sematic integrative processes are known to be characteristics of AD (181),therefore the N400 might be a promising candidate to study this type of dementia.N400 is a negative-going potential peaking between about 250–550 ms) with maximal distribution over the centro-parietal electrode sites, although distribution can vary across protocols depending on the nature of the eliciting stimulus. Its amplitude can range from -5 to 5 µV (182). Studies using invasive electrophysiology and magnetoencephalography localized N400 generators in the temporal, parietal and the prefrontal cortical regions (180, 183). The N400 N400 effect is usually calculated by contrasting responses to congruent and incongruent stimuli to reveal the ERP component related the investigated experimental variable (182).
Sematic priming and repetition priming have been used widely to examine semantic memory functions in AD (175). Semantic priming (SP) facilitates retrieval of target words that are preceded by contextually related priming words compared to words in unrelated context (184). The N400 is sensitive to semantic congruity, and its amplitude is positively correlated with semantic processing load and negatively correlated with semantic expectancy.
Thus semantically incongruous (inappropriate or unexpected) stimuli elicit larger responses compared congruous stimuli (185), frequently described as N400 effect. As it is generally assumed, N400 SP effect represents a more prominent signal processing need on neural resources for unexpected stimuli relative to the expected ones (182). Other repetition priming effects are reviewed later in the P600 section.
The N400 component as well as the N400 SP effect was found to be smaller and delayed in the elderly (186) indicating that the N400 is affected in
normal aging. Nevertheless, the majority of studies investigating N400 effects based on manipulations of semantic congruity in AD consistently revealed reduced N400 amplitudes or slower latencies compared to elderly controls (187). Moreover, different topographic N400 congruity effects have been shown in AD patients (188). Reduced N400 semantic congruity effect in AD patients relative to controls was found to sentence- terminal words of visual (189) or auditory (190) sentences, to visual words congruous/incongruous to the preceding category (191), to semantically related/
unrelated line drawings and pictures (192), as well as to picture primes followed by visual word targets (193) or to visual words followed by picture targets (188). In contrast to the aforementioned findings, other studies reported normal N400 congruity effect in mild AD suggesting a relatively preserved semantic memory (189). However, in a recent study using an ERP paradigm optimized for AD corroborated the aforementioned positive results and found decreased N400 amplitudes among MCI/early AD patients compared to normal controls (76, 135). Furthermore studies investigating the word-repetition effect also showed significant attenuation of the N400 effect and an additional atypical anterior N400 distribution in patients with AD compared with controls (135).
Nevertheless, the authors observed a typically shaped N400; hence they suggested preserved semantic knowledge but impaired access in AD (Word repetition effect is further discussed in the P600 section.) MCI patients also tend to show delayed N400 latencies, reduced N400 semantic congruity and word repetition effect compared to healthy elderly subjects (194).
Olichney et al. have shown in a longitudinal study that MCI converters had abnormal N400 effects (loss of both the N400 repetition effect and N400 congruity effect), which were present at year 1, and became pronounced by year 2. Moreover an abnormal N400 (or P600) effect was associated with an increased risk of transition from MCI to AD. They also found an atypically anterior N400 distribution in MCI converters, similar to mild AD (129). Abnormal N400 topography was found by Grieder et al. to be associated with decreased anterior temporal cerebral blood flow (possibly reflecting the underlying pathology), and they suggested that N400- topography alterations might be a potential biomarker for the detection of early dementia (195). Furthermore, according to Bobes et al., deviant N400 topographies might occur even before the manifestation of semantic memory symptoms. They reported abnormal parietal distribution of N400 congruity effect among asymptomatic carriers of E280A PS-1mutation (196).
In sum, altered N400 semantic congruity effect in AD likely reflects the well-known dysfunction of semantic memory processes in AD (181).
Abnormalities of N400 (reduced N400 effect and altered topography) have been consistently found in previously published studies of mild AD and MCI and
they seem to be related to the anterior temporal lobe, a predilection site for AD pathology (38). Abnormalities of the N400 effect (including both semantic congruity and word repetition effect) may offer sensitive markers for detecting and monitoring the stages of disease progression in very early AD and for the subsequent transition from MCI to AD. Moreover deficits of N400 effects in cognitively normal elderly persons may be an important sign of preclinical AD.
The P600 or Late Positive Component (LPC) has been suggested as an index of memory encoding and retrieval processes, including episodic and declarative memory (129). The P600 component is a large late positive waveform, with a centro-posterior distribution, which reaches its peak around 600 milliseconds after stimulus presentation. Intracranial studies concluded that putative P600 generators include several paralimbic cortical regions (cingulate, orbito-frontal cortex and temporal pole), the medial temporal lobe (MTL) including the hippocampus and entorhinal cortex, and further multi-modal association neocortical regions (ventrolateral prefrontal, lateral temporal cortex). Depth recordings in several paralimbic and association neocortical regions have shown biphasic ERP components which resemble the N400–P600, suggesting a link between these components (197). Studies in dementia focusing on the P600 have mainly used repetition priming to probe memory processes.
Behavioral effects of repetition priming typically include improvements in response speed or accuracy to repeatedly presented stimuli (198).
Both the N400 and P600 can be reliably elicited and modulated using a word repetition paradigm. In word list recognition experiments recognized/remembered words that go through a more extensive encoding process evoke larger late positivity (199). In contrast, preceding semantic contexts which increase the probability of a word’s repeated occurrence have the opposite effect (200). While diminished N400 repetition effects have been linked with abnormal semantic/
conceptual priming (201), P600 priming effects have been associated with episodic verbal memory and declarative memory skills (192).
Prior studies of ERP word repetition effects in AD have reported inconclusive results (202–204).
However, Olinchey et al. used a semantic categorization task in a word repetition paradigm that manipulated semantic congruity and repetition. ERPs obtained in their paradigm showed high sensitivity and specificity (100% and 80%, respectively) to AD. They consistently have found reduced or absent P600 and N400 word repetition effects as well as atypical anterior N400 distribution in patients with AD compared to controls (135, 200). Using the same word repetition paradigm in an fMRI study they have found left hemisphere dominant
repetition effects in medial temporal, prefrontal and parietal networks associated with both encoding and retrieval of episodic memory (205).
The aforementioned research group has also demonstrated reduced P600 word repetition effects in patients with MCI (195). Furthermore, reductions in either the P600 or N400 word repetition effect in MCI patients were associated with greater likelihood for conversion to AD dementia (129). Olinchey and colleges used an incidental verbal learning paradigm with high sensitivity to prodromal AD in seven elderly subjects, who had normal cognition at the time of ERP recordings but showed subsequent cognitive deterioration or had AD pathology confirmed by autopsy. A reduced P600 repetition effect was found compared to normal elderly controls. The P600 effect was severally compromised even in patients with minimal neurofibrillary pathology, and the authors suggested that amyloid deposits might disrupt effective communication within the network of neural generators underlying the P600 response (206).
In conclusion, progressive alteration of the P600 effect may be a manifestation of failing P600 generators, which may relate to the early involvement of the medial temporal lobe. The MTL (anterior fusiform, parahippocampal gyrus, hippocampus) is known to be involved in the early neuropathology of AD; deficits in the episodic memory are usually the earliest symptoms. ERP word repetition effects appear to be very sensitive to AD and MCI. P600 and N400 repetition effects have consistently been found diminished in AD which may be linked to semantic and memory impairments. Decreased P600 and N400 repetition effects appear to be useful biomarkers for predicting conversion from MCI to AD dementia, thus altered P600 effects in elderly with normal cognition could be a red flag for preclinical AD.
The emerging picture after overviewing the abnormalities of cognitive ERPs in AD shows that early, sensory-evoked potentials are usually found to be less affected in AD, although the results are not entirely conclusive. Later potentials reflecting higher cognitive processes, such as the P300 component, could be more effective for detecting the progression of cognitive decline and attention deficits, thus it could prove to be a useful biomarker in CNS drug development. A decreased P600 and N400 repetition effect and also a delayed N200 latency can be detected consistently in the early stage of the disease therefore they could reliably predict the conversion from MCI to AD.
Interestingly, genetic and longitudinal studies also found the abnormalities of several ERP components (N200, P300, N400, and P600) in the pre-symptomatic stage of AD. ERP abnormalities are not specific to Alzheimer’s disease; they have been also documented in several other neuro-psychiatric disorders. The sensitivity
and specificity of ERP measurements showed great variability in the literature; therefore the diagnostic validity of these measurements seemed to be poor. However, recently several studies using promising clinical ERP approaches presented prediction accuracies of MCI/
AD progression in the 85–95% range (129, 207–208).
The separation of subcomponents (174) and also the additional use of two or more components of the event- related potentials (147, 208), the combination of ERP measurements with event-related synchronization (ERS) measurements (136) or with neuropsychological tests has been found to be useful to increase sensitivity and specificity (165) and thus improve reliability of the overall test procedure. Furthermore the importance of the use of carefully designed paradigms with higher sensitivity to AD (137, 199), MCI (194) or even to prodromal AD (206) has been highlighted (Table 3).
3.5. Mismatch-negativity (MMN) studies in AD and MCI
The mismatch negativity (MMN) is an ERP component generated automatically in response to events that deviate from what is likely to happen. A commonly used experimental protocol to elicit MMN is the oddball paradigm (209), where frequent, standard stimuli are interspersed with rare, deviant stimuli. The MMN component is usually obtained by subtracting the ERPs to standards from those to deviant stimuli.
Although MMN can be elicited by stimuli in virtually all sensory modalities, auditory and visual paradigms have been used most frequently. Automatically detecting a change in the sensory input works not only at the level of simple acoustic or visual features, but also at higher, more abstract stimulus attributes (209).
The MMN has been proposed to reflect the automatic functioning of a “primitive intelligence” (210), which generate predictions about future events by extracting invariant patterns from the varying environmental sensory input even when they are task-irrelevant.
Extracting such regularities (211) in the absence of attention corresponds to implicitly keeping track of statistical probabilities of sensory events (212) that
allows detecting improbable events; the mismatch between predicted and observed stimuli is thought to be signaled by the MMN response, thus it is increasingly considered as a perceptual prediction error signal (203–219). Since such signals play a fundamental role in veridical sensory and cognitive processes, the MMN component is a suitable candidate as a marker of cognitive decline.
3.5.1. MMN in AD
According to the guideline for the diagnosis and management of Alzheimer’s disease by the European Federation of the Neurological Societies (EFNS), spectral EEG markers based on oscillatory power alterations in different frequency bands may help to differentiate between AD, subjective complains and psychiatric diagnoses (220). However, ERPs are currently not listed in the guideline. ERPs or MMN in particular, to qualify as a clinical marker, should have a sufficiently high sensitivity for detecting early AD, as well as a sufficiently high specificity for distinguishing it from other neurodegenerative disorders. Furthermore, according to the Consensus Report of the Working Group on Molecular and Biochemical Markers of AD (221) by the Ronald and Nancy Reagan Research Institute, an ideal marker should be non-invasive, simple to perform, and inexpensive. However, currently only diagnostic approaches based on cerebrospinal fluid-tau and positron emission tomography (PET) approaches demonstrated sensitivity as well as specificity in the range of about 70%-100% (222).
Clearly, markers obtained with these methods do not fulfill the above ideal requirements of non-invasiveness and cost-effectiveness. Regarding biomarkers for disease progression, a recent systematic review by McGhee et al. (223) found that the most commonly studied marker was brain MRI, whereas electrophysiological studies made up only a small fraction of the included studies. They found that studies were generally of poor quality, underpowered due to relatively small number of participants, and had flawed methodologies, indicating that the field in general
Table 3. Changes in amplitude and latency of different ERP components in AD, MCI and preclinical stages
of AD
ERP component Amplitude in AD Latency in AD Amplitude in MCI Amplitude in preclinical AD Effect of cholinergic treatment
Early ERPs IC IC DNA DNA DNA
N170 ↓ / IC ↑ DNA DNA DNA
N200 ↓ ↑↑ ↑ ↑ Less influenced by cholinergic
treatment
P300 ↓↓↓ ↑↑↑ ↑↑↑ ↑↑ Response to cholinergic treatment
N400 ↓↓ ↑↑ ↑↑ ↑ DNA
P600 ↓↓ ↑↑ ↑↑ ↑ DNA
The number of arrows indicates the number of studies reporting concordant results: ↑ = 1–5 studies ↑↑ = 5–10 studies ↑↑↑ >10 studies. DNA = Data not available; IC = inconclusive results.