Climate sensitivity of allergenic taxa in Central Europe associated with new climate change related forces
Áron József Deák
a, László Makra
b,⁎ , István Matyasovszky
c, Zoltán Csépe
b, Beáta Muladi
aaDepartment of Physical Geography and Geoinformatics, University of Szeged, HU-6701 Szeged, P.O.B. 653, Hungary
bDepartment of Climatology and Landscape Ecology, University of Szeged, HU-6701 Szeged, P.O.B. 653, Hungary
cDepartment of Meteorology, Eötvös Loránd University, HU-1117 Budapest, Pázmány Péter st. 1/A, Hungary
H I G H L I G H T S
►Trend analysis on a daily basis is a new approach providing information on annual cycles of pollen concentration trends.
►A multiple association measure is introduced for quantifying the relationships among the trends of the variables.
►Novel climate change related forces are introduced, namely risk potential and expansion potential due to the climate change.
►A novel procedure separates the effects of the past and current weather conditions in influencing current pollen levels.
►The potential effect of land use changes on pollen release of the taxa is discussed using the CORINE Land Cover Database.
a b s t r a c t a r t i c l e i n f o
Article history:
Received 2 July 2012
Received in revised form 16 October 2012 Accepted 16 October 2012
Available online 21 November 2012 Keywords:
Pollen Pollen season Trend
Ecological indicator Climate change Respiratory allergy
The aim of the study was to analyse trends of the pollen season with its duration, start and end dates, as well as trends of the annual total pollen count and annual peak pollen concentration for the Szeged agglomeration in Southern Hungary. The data set covered an 11-year period (1997–2007) that included eight taxa and seven daily climate variables. Trend analysis was performed on both annual and daily bases. Trend analysis on a daily basis is a new approach that provides information on the annual cycles of the trends. To quantify the strength of the relationship between the annual cycle of the slope of a pollen concentration trend and the annual cycles of the slopes of the climate variable trends, an association measure and a multiple association measure are introduced. Individual taxa were sorted into three categories according to their climate sensitivities. These were compared with two novel climate change-related forces, namely risk potential and expansion potential due to the climate change. The total annual pollen counts indicated significant trends for 4 taxa and 3 of these 4 trends increased on a daily basis. At the same time, significant changes were detected for the pollen season character- istics of three taxa. The association measures performed well when compared to the climate change-related forces. Significant changes in pollen season characteristics were also in accordance with the risk potential and expansion potential due to the climate change. A novel procedure was applied to separate the effects of the past and current weather conditions that influence the currentAmbrosiapollen concentrations. The potential effect of land use changes on pollen release of the given taxa was also discussed using the CORINE Land Cover Database.
© 2012 Elsevier B.V. All rights reserved.
1. Introduction
Recently, the earth's ecosystem has been experiencing a global warming. Climate change is responsible for the observed northward and uphill distribution shifts of many European plant species. By the late 21st century, distributions of European plant species are projected
to have shifted several hundred kilometres to the north (Emanuel et al., 1985; Pearson, 2006; Parry et al., 2007; Lindner et al., 2010); forests are likely to have contracted in the south (Penuelas and Boada, 2003) and expanded in the north (Leemans et al., 1996; Pearson, 2006;
Lindner et al., 2010). The rate of change will exceed the ability of many species to adapt. As for plant phenology, the timing of seasonal events in plants is changing across Europe due to changes in the climate conditions. Between 1971 and 2000, the average advance of spring and summer was 2.5 days per decade. The pollen season starts on average 10 days earlier and is longer than it was 50 years ago (Feehan et al., 2009).
Global warming is associated with changes in the phenological and quantitative parameters of pollen dispersion of different species.
⁎ Corresponding author at: Department of Climatology and Landscape Ecology, University of Szeged, Hungary, PO Box 653, HU-6701 Szeged, Hungary. Tel.: +36 62 544856; fax: +36 62 544624.
E-mail addresses:aron@geo.u-szeged.hu(Á.J. Deák),makra@geo.u-szeged.hu (L. Makra),matya@ludens.elte.hu(I. Matyasovszky),csepzol@geo.u-szeged.hu (Z. Csépe),muladi@geo.u-szeged.hu(B. Muladi).
0048-9697/$–see front matter © 2012 Elsevier B.V. All rights reserved.
http://dx.doi.org/10.1016/j.scitotenv.2012.10.067
Contents lists available atSciVerse ScienceDirect
Science of the Total Environment
j o u r n a l h o m e p a g e : w w w . e l s e v i e r . c o m / l o c a t e / s c i t o t e n v
An analysis of a continental-scale pollen data set reveals an increasing trend in the yearly amount of airborne pollen for many taxa in Europe, which is more pronounced in urban areas than in semi- rural areas or rural areas (Ziello et al., 2012). Namely, trends for 896 phenological time series in Switzerland for the period 1951–1998 in- dicated earlier appearance dates in the spring and a weak tendency towards later appearance dates in the autumn (Defila and Clot, 2001). In Austria, theflowering period of six taxa starts earlier, and lasts longer; furthermore, their total pollen production and peak values are increasing (Bortenschlager and Bortenschlager, 2005). In the Mediterranean, the flowering of olive trees (Olea europaea L.) starts earlier due to the increased spring temperature (García-Mozo et al., 2009; Orlandi et al., 2010), and the warming climate substan- tially influences both the quantity and quality of olive production (Orlandi et al., 2012). In addition, the pollen season as well as the flowering period of olive trees in Italy are both expected to lengthen in the twenty-first century (Avolio et al., 2012).
The accumulation of anthropogenic gases, especially CO2, is likely to have two fundamental effects on plants, namely (1) an indirect ef- fect through increasing global average surface temperatures with subsequent effects on the climate, and (2) a direct effect caused by the CO2-induced stimulation of photosynthesis and plant growth.
Both effects substantially influence human health as well including allergic respiratory conditions (Ziska and Beggs, 2012).
The prevalence of allergic respiratory conditions has increased over the last three decades, especially in industrialised countries (D'Amato, 2002; Asher et al., 2006; ARIA, 2008). This increase may be partly explained by changes in environmental factors. Urbanisa- tion, the ever-increasing automobile traffic with its high levels of ve- hicle emissions (diesel exhaust can enhance IgE production,Krämer et al., 2000) and changing lifestyles are linked to the rising frequency of respiratory allergic conditions (D'Amato et al., 2005). Furthermore, there is evidence that high levels of traffic-derived air pollutants may interact with pollen and bring about more intense respiratory allergy symptoms (Motta et al., 2006). Hence, due to the rising air pollution, respiratory problems are of major concern worldwide.
A comprehensive spectrum of the regional pollenflora was only analysed in three studies, namely in Clot (2003, 25 plant taxa), Damialis et al. (2007, 16 plant taxa)andCristofori et al. (2010, 63 plant taxa), respectively.Clot (2003)found that 71% of the dates of the onset or the end of the pollen seasons occurred significantly ear- lier in the year. For the majority of the pollen types the pollen season was not prolonged, but shifted in time. BothDamialis et al. (2007) andCristofori et al. (2010)detected significant increasing trends in the pollen levels for the majority of the taxa studied. In all three stud- ies, the pollen production of the arboreal plants indicated more comprehensive and stronger increasing trends compared to the her- baceous species (Clot, 2003; Damialis et al., 2007; Cristofori et al., 2010). Though these studies provided a broad survey and a detailed analysis on the pollen season characteristics and trends of a large number of taxa, they did not take into account the associations be- tween the structure of the annual cycles of trends of the pollen con- centrations on one hand and the meteorological elements on the other. Furthermore, they did not examine the climate sensitivity or the potential reactions of the individual taxa on the recent warming or the effect of the temporal distribution of the values of the meteoro- logical parameters on the current pollen levels. An analysis of these aspects seems necessary in order to understand the effect of the re- cent warming on each taxon.
The main aim of this paper is to study an extended spectrum of airborne pollen characteristics (8 plant taxa) for the Szeged region in Southern Hungary. Trends for both quantity-related and phenolog- ical pollen season characteristics have been calculated for each taxon.
A multiple association measure (MAM) is introduced that describes how well the annual cycle of the daily slopes of a pollen concentration trend can be represented by a linear combination of the annual cycles
of the daily slopes of the climate variable trends. Two novel climate change-related forces, namely risk potential (RP) and expansion po- tential (EP) due to the climate change have also been introduced and these forces are evaluated for each taxon. In addition, a novel pro- cedure was applied to separate the effects of the past and current weather conditions which influence the currentAmbrosiapollen con- centration. The potential effect of land use change onAmbrosiapollen concentration is also discussed using results taken from the CORINE Land Cover Database.
2. Materials and methods
2.1. Location and data
Szeged (46.25°N; 20.10°E), the largest settlement in South-eastern Hungary is located at the confluence of the Rivers Tisza and Maros (Fig. 1). The area is characterised by an extensiveflat landscape of the Great Hungarian Plain with an elevation of 79 m above sea level. The city is the centre of the Szeged region with 203,000 inhabitants. The cli- mate of Szeged belongs to Köppen's Ca type (warm temperate climate) with relatively mild and short winters and hot summers (Köppen, 1931).
The pollen content of the air was measured using a 7-day recording Hirst type volumetric spore trap (Hirst, 1952) (Fig. 1). The air sampler is located on top of the building of the Faculty of Arts at the University of Szeged approximately 20 m above the ground surface (Makra et al., 2010). Meteorological variables include daily values of minimum (Tmin, °C), maximum (Tmax, °C) and mean temperature (T, °C), total solar radiation (TR, W·m−2), relative humidity (RH, %), wind speed (WS, m·s−1) and rainfall (R, mm). They were collected in a meteoro- logical station located in the inner city area of Szeged (Fig. 1). The data set consists of daily pollen counts (average daily pollen count per cubic metre of air) of those taxa that have the highest pollen release and their mean total annual pollen counts exceeded 80% of the total pollen dispersion over the period 1997–2007. Hence, 8 taxa were analysed. With their Latin (English) names they are as follows:Ambrosia (ragweed), Artemisia (mugwort), Betula (birch), Chenopodiaceae (goosefoots),Morus(mulberry), Poaceae (grasses), Populus(poplar) andUrtica (nettle). Note that pollen grains of Chenopodiaceae and Amaranthaceae are similar in their shape and appearance. Hence their separation and identification require great skill. However, we carefully separated the pollen grains of these two genera. Taxa with the highest pollen levels include Ambrosia (32.3%), Poaceae (10.5%), Populus (9.6%) andUrtica(9.1%), which together account for 61.5% of the total pollen production.
The pollen season is defined by its start and end dates. For the start (end) of the season we used the first (last) date on which 1 pollen grain m−3of air is recorded and at least 5 consecutive (pre- ceding) days also have 1 or more pollen grains m−3(Galán et al., 2001). For a given pollen type, the longest pollen season during the 11-year period was considered for each year.
2.2. Methods 2.2.1. Trend analysis
A common way of estimating trends in data is via linear trend analysis. The existence of trends is examined generally by thet-test based on the estimated slopes and their variances. This test, however, may be used for normally distributed data. Data having probability distributions far from the normal one can be tested against monotone trends by the Mann–Kendall (MK) test (Önöz and Bayazit, 2003).
Hence this method is used here, though the slopes have also been cal- culated (Table 1).
It may happen that some trends might have overly complex forms that cannot be suitably approximated by global linearfits, so non- parametric methods are preferable. Nonparametric methods assume
some smoothness of trends to be estimated. Each version of these techniques results in linear combinations of observations lying within an interval around the points where the trends are estimated. The
size of this interval is controlled by a parameter called the bandwidth.
There are several versions of such estimators, but local linearfittings have nice properties (Fan, 1993). When estimating the trends, the choice of the bandwidths has a crucial role in the overall accuracy.
Thus, an optimal bandwidth is estimated by a technique proposed byFrancisco-Fernández and Vilar-Fernández (2004). Note that the local linearfits become globally linear with infinite bandwidths.
2.2.2. Taxon-specific ecological indicators as a basis for introducing new climate change-related forces
Four main ecological indicators of the taxa were used to determine the above-mentioned two new terms. The selected indicators were:
temperature requirements due to Zólyomi (TZ-value) (Zólyomi and Précsényi, 1964; Horváth et al., 1995), temperature requirements due to Soó (TS-value) (Soó, 1964–1980; Horváth et al., 1995), heat supply of the species interpreted with the climate of the vegetation belts due to Borhidi (TB-value) (Borhidi, 1995; Horváth et al., 1995), as well as degree of continentality and climate extremity tolerance according to the distribution of the species due to Borhidi (CB-value) (Borhidi, 1995; Horváth et al., 1995). TZ- and TS-values concentrate only on the heat requirements of the species; however, TB- and CB-values related to the vegetation zones include the typical annual precipitation distributions as well. The replacement of the species Fig. 1.Location of Europe including Hungary (upper panel) and the urban web of Szeged with the positions of the data sources (lower panel). 1: meteorological station; and 2:
aerobiological station. The distance between the aerobiological and the meteorological station is 2 km.
Table 1
Change in the total annual pollen count (TAPC), annual peak pollen concentration (APP), start, end and duration of the pollen season (days/10 years) calculated by using linear trends. Significant values on an annual basis with a probability levelp are denoted by⁎⁎⁎(p= 0.01),⁎⁎(p= 0.05) and⁎(p= 0.1). Significant values on a daily basis with a probability levelpare denoted by+++(p= 0.01),++(p= 0.05) and+(p= 0.1).
Taxa Mean total
annual pollen countsb
TAPCb APPb Pollen season
Start End Duration
Ambrosiaa 7826 −1170 230 14⁎ −9 −22
Artemisia 772 −61 −133 −4 15 19
Betula 901 −60 0 −1 2 3
Chenopodiaceae 854 −175++ −9 −2 3 5
Morus 667 400+++ 44 −7 −4 3
Poaceaea 2552 176 43 −10 17⁎ 27⁎⁎⁎
Populusa 2322 2981⁎⁎,+++ 610⁎⁎ −2 3 4
Urticaa 2200 1183⁎,+++ 25 −13⁎⁎ 18⁎⁎ 31⁎⁎⁎
aBold: taxa with the highest pollen levels.
b Pollen grains m−3/10 years.
within a taxon and habitat-shifts were also considered using the Hun- garian National Flora Database (Horváth et al., 1995) andfield knowl- edge (Deák, 2010) to detect the effect of different climate extremities on the vegetation (Deák, 2011a) (Table 2). In order to calculate the new climate change-related forces, besides the above-mentioned ecological indicators, local effects of the expected changes predicted by recent climate models were also considered. These models take into account a 2–4 °C increase in the annual mean temperature, lower rainfall total in the summer season, decreasing annual precipi- tation by 150–200 mm and a more extreme rainfall distribution throughout the year for a 100-year time scale up to the end of the century (Láng et al., 2007; Czúcz, 2009; Faragó et al., 2010).
2.2.3. Risk potential (RP) and expansion potential (EP) as new forces due to climate change
In order to evaluate the response of plants to climate change, two forces were introduced, namely risk potential due to the climate change (RP) and expansion potential due to the climate change (EP). Both forces were determined for a specific taxonomic group (genus, family) of the plants studied. The species pool of the Hungar- ian vegetation was collected according to the Flora Database of Hun- gary (Horváth et al., 1995).
RP characterises the endangerment of the species of different taxa in their present habitats and indicates their survival potential at their present places. Based on their RP, the species were classified into 3 cat- egories. Non-endangered taxa (*) can survive climate change since they contain species for warmer and drier conditions, whereas the climati- cally endangered taxa (***) have no species in the presentflora for the conditions expected to change. In thefirst case, the change of species within a taxon in a certain landscape could help the adaptation of the taxon to the global warming, whereas in the latter case the lack of warm-tolerant species might lead to the disappearance of a given taxon. The wider the tolerance-range (the more ecological indicator values there are, i.e. TZ-, TS-, TB-, or CB-values) (Table 2) and the more species (especially warm and dry-tolerant species) a taxon has, the less exposed it is to climate change. Moderately endangered taxa
(**) could survive to some degree in their locations, but the populations of some species might decrease regionally.
Three variables must be used for a given taxon: (1) the number of species within a taxon, (2) the value-range of the ecological indicators of the species within a taxon and (3) the number of warm- and dry-tolerant species within a taxon (this is the most important factor).
For example, grasses (Poaceae) have a lot of species [see (1)] with a wide value-range of their ecological indicators [see (2)], and many of them are warm-tolerant [see (3)], so they will have enough species to adapt to the changes. However, the response of species to the climate change may be different (all three categories of RP may apply to Poaceae) (Table 2). If a taxon contains mainly warm- and dry-tolerant species (e.g.Ambrosia), then fewer species need to adapt—so it is a less endangered taxon. If a taxon has only a few species and none of them favours warmer and drier conditions, the chance for its extinction is significantly higher (***) (e.g.Betula) (Table 2).
EP indicates the capability of the species to move in the landscape, which characterises the rescue effect. If a taxon belongs to several cate- gories of RP, these categories may be grouped into different classes on the basis of field experiments (Horváth et al., 1995; Deák, 2010;
Bölöni et al., 2011; Deák, 2011b). This feature is described with 5 classes as follows. (0): Taxa uninfluenced by global warming. They could sur- vive and their distribution area will remain about the same. (+1):
Taxa uninfluenced by global warming, but for some species area- increase is possible, while for some others area-decrease is possible.
They may survive the changes by moving in the landscape, but their ex- pansion is limited although possible. (+2): Taxa significantly influenced by global warming. For some species area-increase is expected. They are the best adapted to the climate change so they will not just survive, but also spread out in the landscape. For example, the potential spread of species with (*) (e.g.Ambrosia) is expected in the landscape, so a +2 value is given for them, which shows that a signifi- cant area increase is expected as a response to the expected climate change. (−1): For some species regional area-decrease is possible.
They may survive in a few places, their spreading in the landscape is limited and area-decrease is expected. (−2): Taxa significantly
Table 2
The values of the ecological indicators and the climate change-related forces for the most common allergenic taxa for Hungary.
Taxa TZ-valueb TS-valuec TB-valued CB-valuee Risk potential due to
climate change (RP)
Expansion potential due to climate change (EP)
Ambrosiaa 0 0 8 6 * 2
Artemisia 5, 6, 7, 2, 3, 4, 5 6, 7, 8, 9 5, 6, 7, 8, 9 * 2
Betula 3 1, 2 3, 4 3, 4 *** −2
Chenopodiaceae 0, 5, 6, 7 0, 2, 3, 4, 5 5, 6, 7, 8, 9 0, 2, 3, 4, 5, 6, 7, 8, 9 *
**(few taxa)
1
Morus – – 7 5 ** −1
Poaceaea 0, 3, 4, 5, 6, 7 0, 2, 3, 4, 5 3, 4, 5, 6, 7, 8, 9 2, 3, 4, 5, 6, 7, 8, 9 *
**(few taxa)
***(few taxa)
1
Populusa 3, 5 3, 4 5, 7, 8 5, 6, 7 *
**(few taxa)
1
Urticaa 5, 6 0, 4 6, 7 4, 6 *
**(few taxa)
1
aBold: taxa with the highest pollen levels.
b TZ-value: temperature requirements due to Zólyomi (Zólyomi and Précsényi, 1964; Horváth et al., 1995):−: no value is determined; 0: not characteristic; 3: in accordance with taiga belt; 4: in accordance with broad-leaved/needle-leaved mixed forest belt; 5: in accordance with broad-leaved forest belt; 6: in accordance with sub-Mediterranean forest belt;
7: in accordance with Mediterranean, Atlantic evergreen belt; taxa with TZ-values of 1 and 2 do not occur.
c TS-value: temperature requirements due to Soó (Soó, 1964–1980; Horváth et al., 1995):−: no value is determined; 0: indifferent species to temperature; 1: highly cold-tolerant, arctic or alpine species; 2: cold-tolerant species; 3: slightly cold-tolerant species; 4: cold-sensitive, warm-needed species; 5: highly warm-needed species.
d TB-value: heat supply of species interpreted with the climate of the vegetation belts due to Borhidi (Borhidi, 1995; Horváth et al., 1995): 3: in accordance with sub-alpine or sub-boreal belt; 4: in accordance with montane needle-leaved forests or taiga belt; 5: in accordance with montane broad-leaved forest belt; 6: in accordance with sub-montane broad-leaved forest belt; 7: in accordance with thermophilous forest belt; 8: in accordance with the belts of sub-Mediterranean woodlands and continental steppes; 9: in accor- dance with Mediterranean evergreen belt; taxa with TB-values of 0, 1 and 2 do not occur.
e CB-value: degree of continentality and climate extremity tolerance in association to the distribution of species due to Borhidi (Borhidi, 1995; Horváth et al., 1995): 0: indifferent species; 2: oceanic species (living mainly in Western-Europe and Western-Central Europe); 3: oceanic-sub-oceanic species (distribution focus on Central Europe); 4: sub-oceanic species (distribution focus on Central Europe, but rarely expanding to East); 5: sub-oceanic–sub-continental intermediate species; 6: sub-continental species (distribution focus on Eastern Central Europe); 7: continental–sub-continental species (distribution focus on Eastern Europe, but occurring in Central Europe, as well); 8: continental species (distribution focus on Eastern Europe reaching only Eastern Central Europe); 9: EU-continental species (Eastern European and Asian steppe species occurring just exceptionally in Central Eu- rope); taxa with CB-value of 1 do not occur.
influenced by global warming. For the majority of species, area- decrease is expected. They have the smallest adaptation capability;
they will gradually disappear and even the rescue effect in some refuges is doubtful (Table 2). For instance, Betula is an endangered taxon marked by (***) in the RP system, so their EP value is the lowest, mean- ing that area-decrease is expected as a result of climate change.
2.2.4. Multiple association measure (MAM) and its connection with RP and EP
We examined whether there were any clear associations between the annual cycles of daily slopes of pollen concentration trends and the annual cycles of daily slopes of climate variable trends. Here, an association measure (AM) is used to characterise these relationships by calculating the correlations between the annual cycles of slopes obtained by using the nonparametric trend estimation procedure de- scribed inSection 2.2.1. This quantity will not be referred to as a cor- relation because correlation is defined for random variables, but now similarities between deterministic functions (annual cycles) have to be quantified. An overall measure called the multiple association measure (MAM) was also introduced, which characterises how well the annual cycle of the daily slopes of a pollen concentration trend can be represented by a linear combination of the annual cycles of the daily slopes of the climate variable trends. MAM varies between zero and one, approaching one with increasing accuracy of the above-mentioned representation. Actually, MAM is calculated as a multiple correlation, but it should not be labelled as a correlation.
The definitions of AM and MAM are based on elementary consider- ations of linear algebra (see, for instance, Section 5.15 in Meyer, 2001) because an annual cycle of the slopes of daily trends covering ann-day period can be treated as ann-dimensional vector.
2.2.5. Factor analysis and a special transformation
Factor analysis identifies any linear relationships among subsets of examined variables and this helps to reduce the dimensionality of the initial database without substantial loss of information. First, a factor analysis was applied to the initial data sets consisting of 9 variables (8 explanatory variables including 4 climatic variables in the past and the same 4 climatic variables on the actual day, and 1 resultant variable defined by the dailyAmbrosiapollen concentration) so as to transform the original variables to fewer variables. These new variables (called factors) can be viewed as latent variables explaining the joint behaviour of past and current meteorological elements — current Ambrosia pollen concentration variables. The optimum number of retained factors can be determined by different statistical criteria (Jolliffe, 1993; Liu, 2009). After performing a factor analysis, a special transformation of the retained factors was made to discover to what de- gree the above-mentioned explanatory variables (climatic variables) af- fect the resultant variable (Ambrosia), and to assign a rank of their influence (Jahn and Vahle, 1968).
3. Results
3.1. Trend analysis
Only a few trends were clearly identified compared to the total num- ber of MK tests performed (Table 1). This is not surprising as the inter-annual variability of the characteristics studied is quite high, while the size of the data sets is quite small. Therefore, MK tests were performed and linear trends were estimated for each particular day of each pollen season of all 8 taxa considered using 11-element pollen concentration data sets corresponding to the 11-year study period.
This kind of trend analysis provides information on the annual cycles of trends. In the absence of a trend for each day of the pollen season, the MK test values are distributed normally with zero expectation and unit variance. Hence, deciding on the existence of a trend is identical with the problem of deciding whether the annual mean of daily MK test values corresponds to an expectation of zero. The classicalt-test was simplified for the purpose as the variance was known (unit), but modified based on the autocorrelations among the consecutive daily MK test values. First order autoregressive (AR(1)) models were used to describe these autocorrelations. Averaging the values of daily slopes of linear trends over the pollen seasons gives the rates of change of the total annual pollen counts (TAPC). Note that a trend analysis on a daily basis detected many more significant trends of TAPC than a trend analysis on an annual basis (Table 1).
Needless to say, the daily MK test statistics had a big variability.
Therefore, daily MK test values were smoothed with the nonparametric regression technique outlined inSection 2.2.1. In the absence of a trend for each day the estimated bandwidth is extremely large (practically infinite), producing a line close to zero because the local linear approx- imation to the annual cycle of the daily trends becomes globally linear.
Hence, well-defined finite bandwidths got for each taxon indicated trends even forAmbrosia,Artemisia,Betulaand Poaceae, the 4 taxa not exhibiting overall trends on a yearly basis even with a probability levelp= 0.1. The nonparametric regression technique was also used to estimate the annual cycles of the slopes of daily trends.
3.2. Analysis of individual taxa based on MAM, RP and EP
The possible future change of taxa due to the anticipated climate change based on RP, EP (Table 3) and MAM (Table 4) can be explained as follows.Betulais an endangered species according to their RP (***), as well as being highly sensitive according to their MAM values (+++). This is because they live on the edge of their distribution area in Hungary. Hence, global warming can adversely affect them because they cannot stand a warm and dry climate for a longer period and they may go extinct in several habitats and other competitors may be more successful.Betulafavours a much cooler climate according to its distribution area and climate tolerance indi- cators. Therefore,Betulaadapted to cooler springs cannot tolerate earlier springs with higher temperatures. The anticipated warmer
Table 3
Association measure (AM) between the annual cycles of the daily slopes of the pollen concentration trends and the annual cycles of the daily slopes of the climate variables trends.
Taxa Tmin Tmax T R TR RH WS MAM
Ambrosia 0.100 0.207 −0.641⁎ 0.398 0.049 0.087 0.223 0.827
Artemisia −0.249 0.676⁎ −0.486 0.140 −0.004 −0.230 −0.049 0.998
Betula −0.689⁎ −0.192 −0.544⁎ −0.663⁎ −0.006 0.542⁎ 0.070 0.973
Chenopodiaceae 0.071 0.306 −0.869⁎ 0.644⁎ 0.047 0.112 0.307 0.965
Morus 0.329 −0.668⁎ −0.874⁎ 0.821⁎ −0.216 −0.893⁎ 0.684⁎ 0.978
Poaceae −0.088 −0.649⁎ −0.816⁎ 0.826⁎ −0.057 0.309 0.643⁎ 0.959
Populus 0.361 0.358 0.395 0.407 −0.093 −0.378 −0.349 0.869
Urtica −0.467 0.612⁎ 0.451 −0.396 0.076 −0.580⁎ −0.705⁎ 0.827
Bold: taxa with the highest pollen levels; Tmin: minimum temperature (°C), Tmax: maximum temperature (°C), T: mean temperature (°C), R: rainfall (mm), TR: total radiation (W·m−2), RH: relative humidity (%), WS: wind speed (m·s−1); MAM: multiple association measure.
⁎ AM > 0:5j jindicates a strong association.
climate may thus reduce its pollen release. In terms of its survival, in- creased temperatures may provide a more severe limiting factor for Betulathan the lack of water.
Ambrosiais unaffected according to its MAM value. However, its higher potential increase is expected due to its ecological indicator values and high climate tolerance. In other words, this genus can adapt well to dry and hot conditions.
Artemisia species are warm-tolerant, so their EP is high; even Mediterranean and more continental species could appear in the Carpathian basin. The EP of agricultural weeds may be high on fallow areas and may appear quickly in all landscapes in unfavourable weather conditions for farming.Artemisia pollen is partly released by Artemisia santonicum, a natural dominant species of Artemisia short grass alkali steppes—the main habitats of saline grasslands formed on loess (Deák, 2010). These habitats and this species have been shown to be very climate-sensitive—in contrast withArtemisia weeds. The reason for this is the leaching out of their solonetz soils, due to the drainage of saline grasslands and the decrease in rainfall that result in a decrease in the salty groundwater-table.
The MAM value of Chenopodiaceae indicates a high sensitivity, but its response to climate change varies according to its species as it has a big species pool. Both an increase and decrease of its species pool are anticipated. These plants frequently appear in areas affected by in- land water around Szeged, which may disappear with a dryer climate.
Morusbelong to the moderately endangered category (**). Lack of rainfall and very high temperatures are a hindrance for pollen pro- duction during their pollen season (summer). The AM and MAM values suggest that a decreasing rainfall may markedly decrease their pollination capabilities. In its original distribution area in China and Korea, high temperatures are accompanied with springtime or monsoon rainfalls. This high precipitation amount is missing in Cen- tral Europe. Hence,Morustry to preserve as much water as possible in the summer.
Poaceae display a high sensitivity according to MAM (+++) as the available water and high temperatures can threaten their existence.
However, the species pool of this family is the biggest among the plant groups studied, so there will be species to take the place of the ac- tual grasses and even species from the Mediterranean and the more continental areas can reach the Carpathian-basin in the future. This means a high risk for the present species, but intra-taxonic re- assemblage could occur. A shortage of water and excessively high
temperatures could bring about a lower pollen production in natural grasslands and also in crops produced in arable lands. Certain species in certain places and time periods can suffer from climate change, but the change in species composition will offer a good chance for the survival of this family.
UrticaandPopulushave a wide climate-tolerance, so they are not climate-sensitive according to MAM. Both genera could increase their population in the future. They are not endangered or just certain species are moderately endangered by warming.Urtica dioicais not endangered according to its RP value and even population increase is expected. The relatively better climate tolerance ofPopuluscan be explained by the wide adaptation of its various species.
3.3. Separation of the effects of the current and past meteorological elements influencing the current Ambrosia pollen concentration
Airborne pollen concentrations can be influenced not only by the current values of meteorological elements, but also by their past values.
As it is hard to distinguish between the effect of current and past values of the meteorological variables, no attempt was made to determine the relative weight of these two components in influencing the measured current pollen concentration. The procedure proposed here was performed only forAmbrosia, the most allergenic of all taxa considered.
Current meteorological elements were characterised by actual values, while past meteorological elements were described by cumulative values of daily mean temperature, daily relative humidity, daily total solar radiation and daily precipitation total, respectively.
In order to assess the effect of the antecedent and current meteoro- logical conditions on the current pollen concentration, the 1st-day, 2nd-day,…, 93rd-day values of both the pollen concentration and the four meteorological elements of the current pollen season were taken.
(The duration of the ragweed pollen season in Szeged lasts from July 15 until October 15, namely 93 days.) An association between pollen concentration and the four meteorological variables characterises the role of current weather conditions. The values of these meteorological variables were then cumulated for 272-day, 271-day,…, 1-day periods starting 272 days, 271 days,…, 1 day before the actual day of the actual pollen season. This is because there are 272 days between the end of the previous-year pollen season and the beginning of the actual pollen sea- son. Hence, 272 data sets were produced altogether and a factor analysis with a special transformation was performed for each of them.
Table 4
The climate change-related forces and the significance of the different pollen season characteristics for each individual taxon.
Taxa RPb EPc MAMd TAPCeby linear trend APPf Pollen seasong TAPChvia daily linear trend
Onset End Duration
Ambrosiaa * 2 + +10
Artemisia * 2 +++
Betula *** −2 +++
Chenopodiaceae *
**(few taxa)
1 +++ −5
Morus ** −1 +++ +1
Poaceaea *
**(few taxa)
***(few taxa)
1 +++ (+10) +1
Populusa *
**(few taxa)
1 + +5 +5 +1
Urticaa *
**(few taxa)
1 + +10 −5 +5 +1 +1
aBold: taxa with the highest pollen levels.
b RP: risk potential due to climate change.
c EP: expansion potential due to climate change.
d MAM: multiple association measure.
e TAPC by linear trend: change in the total annual pollen counts.
f APP: change in the annual peak pollen concentrations calculated by using linear trends.
g Pollen season: change of start, end and duration of the pollination season calculated by using linear trends.
h TAPC via daily linear trend: change in the total annual pollen count calculated by using daily linear trends; ±1 and ±5: a significant increasing/decreasing trend at probability levelsp= 0.01 andp= 0.05; ±10: a tendency of trend at a probability levelp= 0.1.
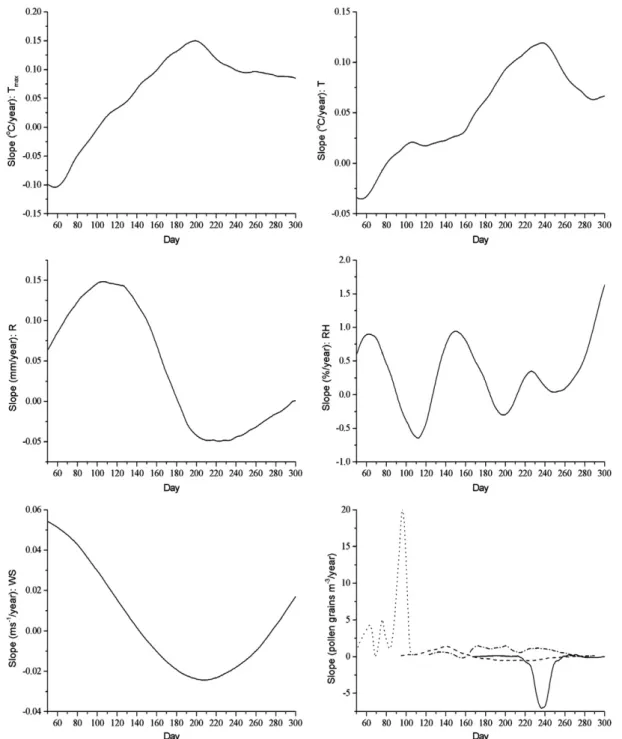
The main conclusions forAmbrosia, say, are as follows (Fig. 3). The total weights (summarized absolute values) of the factor loadings for the past meteorological variables (dashed line) gradually increased from day 272 until day 123, reaching a maximum value of 0.498. From that day until the present, the effect of the past climate parameters influencing dailyAmbrosiapollen level decreased, though two local maxima (days 82 and 21) occurred. The total weights of the factor load- ings for the current climate parameters (solid line) were very low from day 272 until day 138. Then, they increased steeply, reaching their peak values between days 62 and 50. During the last 50 days up to the start of the currentAmbrosiapollen season, the total weights sharply decreased.
The effect of the past climate was greater on the currentAmbrosiapollen concentration from day 272 up to day 77, while from that day up to the present the current climate had a greater influence on the current Ambrosiapollen level. The effect of the current climate began to increase
on day 138 (i.e. 138 days preceding July 15, corresponding to the date February 28) (seeFig. 3).
3.4. The role of land use changes in the pollen release of Ambrosia In the study, we wanted to distinguish between the changes in at- mospheric pollen concentrations resulting from the effect of climate change and changes due to land use change. The effect of land use change can be described by changes in the ratios of agricultural areas, industrial areas, urban areas, forestries, meadows, vineyards, orchards and fallow lands. By applying an appropriate statistical pro- cedure (such as a factor analysis with a special transformation), the weight of both climate-related and land use-related components of atmospheric pollen concentrations could be estimated. However, data on changes in land use is only available for the years 1990,
Fig. 2.Annual cycles of the slopes of daily linear trends for the maximum temperature (Tmax), mean temperature (T), rainfall total (R), relative humidity (RH), wind speed (WS) and forAmbrosia(solid), Poaceae (dash),Populus(dot) andUrtica(dash dot).
2000 and 2006 in the CORINE Land Cover Database (http://www.eea.
europa.eu/publications/COR0-landcover) so such a statistical proce- dure could not be performed.
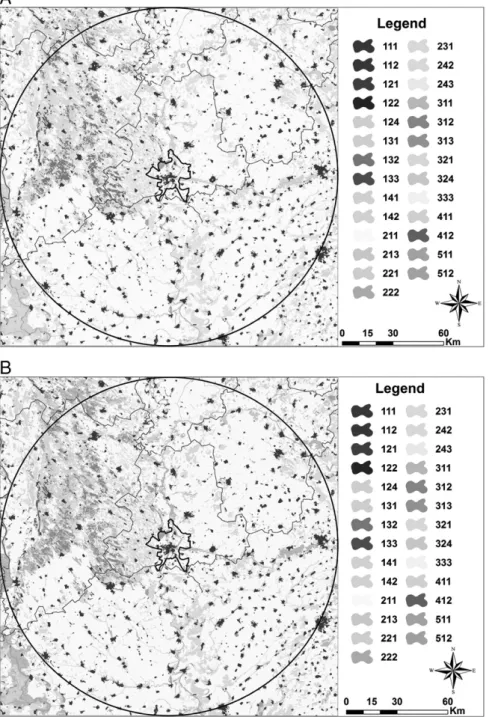
CORINE Land Cover maps for the Szeged area were produced with a 100 km radius around the centre of the city for the years 1990, 2000 and 2006 (Fig. 4a–c). For the Szeged area, short- to medium-range pollen transport involving local pollen dispersion has a higher impact on dailyAmbrosiapollen concentration than long-range pollen trans- port (Makra et al., 2010). Hence, an area for a 100 km limit of medium-range transport (Makra et al., 2010) was considered. Then, in the centre of the radius a square wasfitted to the circle with its sides touching the circle that covered an area of 40,000 km2. Changes in the individual land use cover categories were determined from the year 1990 to the year 2000 (Fig. 4a–b), as well as from the year 2000 to the year 2006 (Fig. 4b–c). These changes were then expressed as a percentage of the total area covered by the square. In fact, change in land use was 1.68 · 10−5% from the year 1990 to the year 2000, while it was 5.39 · 10−3% from the year 2000 to the year 2006. There- fore, land use changes did not influence the pollen concentration of any taxa considered over the Szeged area in the period examined (http://www.eea.europa.eu/publications/COR0-landcover).
4. Discussion
Climate change can modify the pollen season characteristics of dif- ferent allergenic taxa in diverse ways and can exert a substantial in- fluence on habitat regions. To the best of our knowledge, only three previous studies (Clot, 2003; Damialis et al., 2007; Cristofori et al., 2010) analysed comprehensive spectra of the regional pollenflora.
The present study analysed a large spectra with 8 taxa. Our study can be considered unique in the sense that trends of pollen concen- tration data for each taxon and those of all seven climate variables were calculated on a daily basis. This kind of trend analysis provides information on the annual cycles of daily slopes of trends.
Trends of taxa (Table 1) related to trends of climatic variables (Fig. 2) can be explained as follows.Betula occurs around Szeged, but with a very small population. According to the tolerance range of this taxon, an increasing temperature and dryer climate are
unfavourable to it, so a decreasing pollen trend would not be surpris- ing asBetulalike a wetter, more humid, balanced climate. Due to its low occurrence, the decrease in its TAPC value cannot be significant in the trends. However, we are now in a preliminary period of the cli- mate change (Parry et al., 2007) to which it could have adapted. Fur- thermore, the trend back-shots (e.g. individual years with extreme high precipitation in the decreasing trend) could ensure enough water for its survival and adaptation, but it is questionable whether these back-shots will be enough if the trends continue in the future.
The change of TAPC forArtemisiaand Chenopodiaceae calculated on a yearly basis was not significant. However, Chenopodiaceae showed a decreasing trend when calculated on a daily basis. These plants are typical species of young fallow areas, which appeared after the change of the political system at the beginning of 1990s, es- pecially in sandy landscapes. But due to spontaneous regeneration fa- cilitated by grazing and mowing these new stocks began to disappear as these sandy fallow areas turned into sand steppe grasslands (Deák, 2010) and only the populations associated with natural habitats or settlements remained. At the same time, the abandonment of the cultivation of arable lands has decreased over the past 10 years as the increase of fallow areas was curtailed by the increase of areas earmarked for building and forest plantations, respectively.
The duration of the pollen season of Poaceae increased significant- ly due to the warming climate, but TAPC exhibited no significant trend, which might also be connected with the regenerating fallow areas. The older fallow areas are all characterised by a huge coverage of grasses, so fallow regeneration has led to a slight increase of grass- lands over the past 10 years. In warmer years the pollination season of Poaceae may be substantially longer (Makra et al., 2012), but with- out higher pollen concentrations due to decreasing amounts of rain- fall in the summer.
Populus displayed a substantial increase in its TAPC value.
This may be the result of its wide climate tolerance as both wet- (e.g.Populus nigraandPopulus canescens) and dry-tolerant species are represented in the landscape.Populus alba, in particular, present in the floodplains and sandy areas, has a great adaptation potential.Populus (both wild and cultivated types) were planted widely in the sandy lands west of Szeged and in thefloodplains. The planting of these Fig. 3.Total weights of the factor loadings for the current and past meteorological elements influencing the currentAmbrosiapollen concentration.
species has not ceased over the last 10 years. Besides the locust-tree (Robinia pseudo-acacia), they are the most favoured trees for a forest plantation. The stocks planted in the past few decades are now in a ma- ture state, so they can pollinate at a high level.
A marked increase was observed for the TAPC value and the dura- tion of the pollen season ofUrtica.U. dioica, the only representative of this species around Szeged, has a broad climate tolerance. It can be found both in dry and wet habitats. The under-use of urban habitats, a huge plantation of locust trees(R. pseudo-acacia)and more fallow land also contributed to the expansion of their population. Their pol- lination is also promoted by increasing maximum temperatures that facilitate an earlier start and later end of its pollen season.
Ambrosia(represented only by one species) showed no significant trend as a moderate warming is favourable for this taxon, but the lack of available water during the hottest summer period can limit its pol- lination capabilities because the plant concentrates on preserving water and maintaining its vegetative life functions at the expense of its generative processes.Ambrosiaappears year after year in stubble fields, especially in sandy landscapes and in abandoned places around settlements. The populations of young fallow areas represent just a small fraction of their population in the landscape.
On a yearly basis onlyPopulusandUrticashowed a significant in- crease in the total annual pollen count.Populusdisplayed the most important increase in the annual peak pollen counts. Poaceae and Urticashowed a significant increase in the duration of the pollen sea- son. With a probability levelp= 0.05, 4 of the 8 taxa showed signifi- cant trends in the total annual pollen count, and 3 of these 4 trends increased on a daily basis (Table 1). The phenological characteristics (onset, end and duration of the pollen season) showed changes only in 4 (6) out of 24 cases (8 taxa × 3 phenological characteristics) with a significance level of p= 0.05 (p= 0.1). Here, Poaceae andUrtica are the most important with notable changes of at least two charac- teristics. Our general conclusions are in good agreement with those of several previous studies. For Thessaloniki (Greece), the total annu- al pollen counts, as well as daily peak pollen counts showed signifi- cant increasing trends for the majority of taxa, but there were no important changes for the phenological characteristics (Damialis et al., 2007). Looking at a bigger region of Central Europe, for Zurich, Switzerland (Frei, 2008,Betula), as well as for Vienna, Austria (Jäger et al., 1996,Betula) the pollen concentrations for most of the pollen types have been increasing. Furthermore, for Zurich (Frei, 2008, Betula), Poznaň, Poland (Stach et al., 2007,Artemisia) and Vienna (Jäger et al., 1996,Betula) the pollen season starts earlier, the daily maximum pollen concentration has increased (Frei, 2008, Betula) and the days of peak pollen counts occur earlier (Stach et al., 2007, Artemisia).
Note that all the taxa examined in our study are families or genera involving a number of species. Accordingly, analysing the pollen season and phenological characteristics of a family or genus instead of a given species both involve a high variability of pollen season data. An ob- served trend in the above characteristics incorporates the variability of a given parameter for all species belonging to a given taxon, but this variability is influenced by meteorological variables. The important role of sunshine hours is stressed here, since high values enhance pollen production (Valencia-Barrera et al., 2001; Kasprzyk and Walanus, 2010). We found increasing trends (with a significance levelp= 0.05) in the total solar radiation, relative humidity and wind speed. Temper- ature and rainfall did not display any overall significant trends, but the smoothing of daily MK test values showed stages of positive and nega- tive trends within the year for these latter two variables as well (Fig. 2).
Based on an association measure (AM), the individual taxa were placed into three categories according to their climate sensitivity defined by a multiple AM (MAM). These are: (1) high sensitivity: MAM>0.950, involving 5 taxa (Artemisia,Morus,Betula, Chenopodiaceae and Poaceae);
(2) medium sensitivity: 0.900bMAM≤0.950, including 0 taxon (however, based on an extended analysis this category comprises
Platanus,Plantago,Ulmus,JuglansandQuercus); and (3) low sensitivity:
MAM≤0.900, comprising 3 taxa (Populus, Ambrosia and Urtica) (Table 3).
Risk potential (RP) and expansion potential (EP) due to the climate change were compared to the MAM for each taxon (Tables 3 and 4). The association measure alone cannot contain or express the climate change-related forces. Still, all taxa having the lowest climate sensitivity (+) (Ambrosia,PopulusandUrtica) are non-endangered (*) and, except forAmbrosia, are characterised by a moderate EP. For all endangered taxa (***) (Betulaand Poaceae) (even if just one species is endangered within a given taxon), the MAM values suggest a high sensitivity (+++). Accordingly, the association measures closely follow the climate change-related forces, indicating that climate parameters are important elements of the environment for the taxa examined.
Here, we remark that ourfindings for assessing the effect of the an- tecedent and current meteorological conditions on the current pollen concentration are valid only for variations of the dailyAmbrosiapollen concentrations accounted for by the above-mentioned eight explanato- ry variables and nothing is known about the variance portion not explained by these variables. In general, this is in agreement with our preliminary idea that past climate has a higher weight far away from the current pollen release, while the current climate has a greater rele- vance close to it. This meshes well with the fact that the germination ability of over 80% forAmbrosiapollen seeds is mostly measured from the second half of February (Hartmann et al., 2003). With the climate conditions of Hungary, the germination peak ofAmbrosiapollen seeds occurs in April (Béres et al., 2005), which agrees with the fact that the effect of the current climate becomes predominant over the past climate influencingAmbrosiapollen release from day 77 (i.e. 77 days preceding July 15, corresponding to the date April 30). A further climate-related significance of these days (February 28 and April 30) is as follows. By the end of February, daily mean temperatures are already in a positive range. The weight of the past climate elements culminates in January– February. This underlines the major effect of temperature and precipita- tion on theAmbrosiapollen concentration as a resultant variable in win- ter. The effect of autumn rainfall lasts until the end of February. As soon as photosynthesis starts, autumn and winter precipitation is gradually utilised by the plants and hence leads to a decrease in the role of precip- itation of the past climate and in an increase in the role of current rain- fall. In addition, from the second half of April, the mean and maximum temperatures suddenly increase and this substantially contributes to the plants producing organic material for their generative processes.
5. Conclusions
Recent warming may help to extend habitats of herbaceous and arboreal plants producing allergenic pollen that contributes to the in- crease of pollen levels and exacerbation of their adverse effects, hence may contribute to the rise in pollen sensitivity and respiratory admis- sions due to pollen-related allergy problems.
Note that this study is thefirst attempt to show the climate sensitiv- ity of the main allergenic species groups of vegetation. Two climate change-related forces were introduced, where the risk potential con- centrates on the local survival capability, specifying what will happen with the species in their present habitats, while the expansion potential concentrates on the moving capability of the species and the landscape- level response. The scale of the two forces is thus different. Expansion potentials were determined using risk potentials based on the ecologi- cal indicators of the species pool; hence, these forces have a strong connection. These latter two plant-associated forces include (a) an intra-taxonic species change, (b) a higher range of species coming from the surroundings of the Carpathian basin, (c) the transformation of abiotic features of habitats, (d) the moving capability of species and (e) the rescue effect of habitats due to special microclimates.
The MAM values are not always in close agreement with the risk and expansion potentials, but do closely follow them for certain
taxa. MAMs use only the climate sensitivity of the taxa for a given time period, area and species pool. Furthermore, the risk and expan- sion potentials are useful for detecting regional changes over longer time periods (centuries, millennia), while MAMs can be used for detecting local changes over shorter periods (decades).
Of course, the results and conclusions were stated for only one sampling point. The results presented above will form the basis of fur- ther studies that will examine the climate change-related reasons for the modifications in vegetation dynamics, the phenology offlowering and pollen production as well.
Acknowledgements
The authors would like to thank Gábor Motika (Environmental Con- servancy Inspectorate, Szeged, Hungary) for providing meteorological data of Szeged, Miklós Juhász (University of Szeged) for providing daily pollen concentration data of Szeged and Zoltán Sümeghy for the digital mapping inFig. 1. The European Union and the European Social Fund providedfinancial support for the project under the grant agree- ment called TAMOP 4.2.1/B-09/1/KMR-2010-0003, TAMOP-4.2.1/B-09/
1/KONV-2010-0005 and TAMOP-4.2.2/B-10/1-2010-0012.
Fig. 4.A. The CORINE Land Cover map for the Szeged area with a 100 km radius around the centre of the city, 1990. B. The CORINE Land Cover map for the Szeged area with a 100 km radius around the centre of the city, 2000. C. The CORINE Land Cover map for the Szeged area with a 100 km radius around the centre of the city, 2006. 111: Continuous urban fabric; 112: discontinuous urban fabric; 121: industrial or commercial units; 122: road and rail networks and associated land; 124: airports; 131: mineral extraction sites;
132: dump sites; 133: construction sites; 141: green urban areas; 142: sport and leisure facilities; 211: non-irrigated arable land; 213: ricefields; 221: vineyards; 222: fruit trees and berry plantations; 231: pastures; 242: complex cultivation patterns; 243: land principally occupied by agriculture, with significant areas of natural vegetation; 311:
broad-leaved forest; 312: coniferous forest; 313: mixed forest; 321: natural grasslands; 324: transitional woodland-shrub; 333: sparsely vegetated areas; 411: inland marshes;
412: peat bogs; 511: water courses; and 512: water bodies.
References
ARIA (allergic rhinitis and its impact on asthma) 2008 update. In collaboration with the World Health Organization, GA2LEN and AllerGenhttp://www.whiar.org/docs/
ARIA-Report-2008.pdf.
Asher MI, Montefort S, Bjorkstén B, Lai CK, Strachan DP, Weiland SK, et al. Worldwide time trends in the prevalence of symptoms of asthma, allergic rhinoconjunctivitis, and eczema in childhood: ISAAC phases one and three repeat multicountry cross-sectional surveys. Lancet 2006;368(9537):733–43.
Avolio E, Orlandi F, Bellecci C, Fornaciari M, Federico S. Assessment of the impact of climate change on the oliveflowering in Calabria (southern Italy). Theor Appl Climatol 2012;107:531–40.
Béres I, Novák R, Hoffmanné Pathy Zs, Kazinczi G. Az ürömlevelűparlagfű(Ambrosia artemisiifoliaL.) elterjedése, morfológiája, biológiája, jelentősége és a védekezés lehetőségei. ((Distribution, morphology, biology, importance and weed control of common ragweed (Ambrosia artemisiifoliaL.))). Gyomnövények, Gyomirtás 2005;6:
1-48. [in Hungarian].
Bölöni J, Molnár Zs, Kun A. Magyarország élőhelyei. (Habitats of Hungary.). Vácrátót:
MTA Ökológiai és Botanikai Kutatóintézet (Academy of Hungary's Institute of Botany and Ecology); 2011. [439 pp. (in Hungarian)].
Borhidi A. Social behaviour types, the naturalness and relative ecological indicator values of the higher plants in the Hungarian Flora. Acta Bot Hung 1995;39:97-181.
Bortenschlager S, Bortenschlager I. Altering airborne pollen concentrations due to the global warming. A comparative analysis of airborne pollen records from Innsbruck and Obergurgl (Austria) for the period 1980–2001. Grana 2005;44:172–80.
Clot B. Trends in airborne pollen: an overview of 21 years of data in Neuchâtel (Switzerland). Aerobiologia 2003;19:227–34.
Cristofori A, Cristofolini F, Gottardini E. Twenty years of aerobiological monitoring in Trentino (Italy): assessment and evaluation of airborne pollen variability.
Aerobiologia 2010;26:253–61.
Czúcz B. Élővilág és éghajlatváltozás. (Biosphere and climate change.). Tudomány az élőtermészetért 1. (Science for the biosphere 1.). Vácrátót: MTA-ÖBKI; 2009 [in Hungarian].
D'Amato G. Environmental urban factors (air pollution and allergens) and the rising trends in allergic respiratory diseases. Allergy 2002;57(Suppl. 72):30–3.
D'Amato G, Liccardi G, D'Amato M, Holgate S. Environmental risk factors and allergic bronchial asthma. Clin Exp Allergy 2005;35:1113–24.
Damialis A, Halley JM, Gioulekas D, Vokou D. Long-term trends in atmospheric pollen levels in the city of Thessaloniki, Greece. Atmos Environ 2007;41:7011–21.
Deák JÁ. Csongrád megye kistájainak élőhelymintázata és tájökológiai szempontú értékelése. (Habitat-pattern and landscape ecological evaluation of the micro- regions of Csongrád County.) PhD Dissertation, Szeged: University of Szeged;
2010 (in Hungarian)
Deák JÁ. Vegetáció-monitoring vizsgálatok Kunpeszéren a“conservation of Hungarian meadow viper (Vipera ursinii rakosiensis) in the Carpathian-basin”címűLIFE+
pályázathoz kapcsolódóan. Kutatási jelentés ((Vegetation monitoring researches in Kunpeszér, in the frame of LIFE+ programme titled“conservation of Hungarian meadow viper (Vipera ursinii rakosiensis) in the Carpathian-basin”. Research Report.)). ; 2011a [231 pp. Szeged (in Hungarian)].
Deák JÁ. A növényzet tájléptékűváltozásai a Kiskunság délkeleti részén. Környezeti változások és az Alföld. (Landscape-level changes of the vegetation of south-east Kiskunság. Environmental changes and the Great Hungarian Plain.). In: Rakonczai J,
editor. A Nagyalföld Alapítvány kötetei, 7. ; 2011b. p. 327–38. [Békéscsaba (in Hungarian)].
Defila C, Clot B. Phytophenological trends in Switzerland. Int J Biometeorol 2001;45:
203–7.
Emanuel WR, Shugart HH, Stevenson MP. Climatic change and the broad-scale distribu- tion of terrestrial ecosystem complexes. Clim Chang 1985;7:29–43.
Fan J. Local linear regression smoothers and their minimax efficiency. Ann Stat 1993;21:196–216.
Faragó T, Láng I, Csete L, editors. Climate change and Hungary: mitigating the hazard and preparing for the impacts. The“VAHAVA”report. Budapest: Hungarian Acade- my of Sciences; 2010. [124 pp.].
Feehan J, Harley M, van Minnen J. Climate change in Europe. 1. Impact on terrestrial ecosystems and biodiversity. A review (reprinted). Agron Sustain Dev 2009;29:
409–21.
Francisco-Fernández M, Vilar-Fernández JM. Weighted local nonparametric regression with dependent data: study of real private residentialfixed investment in the USA.
Stat Infer Stoch Process 2004;7:69–93.
Frei T. Climate change and its impact on airborne pollen in Basel, Switzerland 1969–2007.
Allergologie 2008;31:165–9.
Galán C, Cariňanos P, García-Mozo H, Alcázar P, Domínguez-Vilches E. Model for forecast- ingOlea europaeaL. airborne pollen in South-West Andalusia, Spain. Int J Biometeorol 2001;45:59–63.
García-Mozo H, Orlandi F, Galán C, Fornaciari M, Romano B, Ruiz L, et al. Oliveflowering phenology variation between different cultivars in Spain and Italy: modeling analysis.
Theor Appl Climatol 2009;95:385–95.
Hartmann F, Hoffmanné PZs, Tóth Csantavéri Sz. A parlagfű(Ambrosia artemisiifoliaL.) atrazinrezisztens biotípusának országos elterjedése. ((Country-side distribution of an atrazine-resistant biotype of ragweed (Ambrosia artemisiifoliaL.))). Növényvédelem 2003;39:313–8. [in Hungarian].
Hirst JM. An automatic volumetric spore trap. Ann Appl Biol 1952;39:257–65.
Horváth F, Dobolyi ZK, Morschhauser T, Lőkös L, Karas L, Szerdahelyi T. Flóra adatbázis (Flora database) 1.2. Vácrátót: MTA-ÖBKI; 1995 [in Hungarian].
Jäger S, Nilsson S, Berggren B, Pessi AM, Helander M, Ramfjord H. Trends of some airborne tree pollen in the Nordic countries and Austria, 1980–1993—a comparison between Stockholm, Trondheim, Turku and Vienna. Grana 1996;35:171–8.
Jahn W, Vahle H. Die Faktoranalyse und ihre Anwendung. Berlin: Verlag die Wirtschaft;
1968 [in German].
Jolliffe IT. Principal component analysis: a beginner's guide—II. Pitfalls, myths and extensions. Weather 1993;48:246–53.
Kasprzyk I, Walanus A. Description of the main Poaceae pollen season using bi-Gaussian curves, and forecasting methods for the start and peak dates for this type of season in Rzeszow and Ostrowiec Sw. (SE Poland). J Environ Monitor 2010;12:906–16.
Köppen W. Grundriss Der Klimakunde. Berlin: Walter De Gruyter & Co.; 1931.
Krämer U, Koch T, Ranft U, Ring J, Behrendt H. Traffic-related air pollution is associated with atopy in children living in urban areas. Epidemiology 2000;11:64–70.
Láng I, Jolánkai M, Csete L, editors. Globális klímaváltozás: hazai hatások és válaszok—a VAHAVA jelentés. (Global climate change: effects and responses for Hungary— VAHAVA report)Budapest: Szaktudás Kiadó Ház; 2007.
Leemans R, Cramer W, van Minnen JG. Prediction of global biome distribution using bio- climatic equilibrium models. In: Melillo JM, Breymeyer A, editors. Effects of global change on coniferous forests and grasslands. New York, USA: Wiley; 1996. p. 413–40.
Fig. 4(continued).