DOI: 10.2478/10004-1254-63-2012-2246 Scientifi c Paper
ASSOCIATIONS BETWEEN WEATHER CONDITIONS AND RAGWEED POLLEN VARIATIONS IN SZEGED,
HUNGARY
István MATYASOVSZKY1, László MAKRA2, and Zoltán CSÉPE3
Department of Meteorology, Eötvös Loránd University, Budapest1, Department of Climatology and Landscape Ecology2, Department of Climatology and Landscape Ecology3, University of Szeged, Szeged, Hungary
Received in April 2012 CrossChecked in August 2012
Accepted in August 2012
This study analyses potential associations between day-to-day variations in common ragweed pollen counts in the southern Hungarian district of Szeged and meteorological variables using adapted factor analysis.
The database includes ten years (1997-2006) worth of data on daily common ragweed pollen ratios (value on the given day per value on the day before) and daily differences (value on the given day minus value on the day before) in eight meteorological variables (mean temperature, minimum temperature, maximum temperature, temperature range, irradiance, relative humidity, wind speed, and rainfall) over the ragweed pollen season. This method is new, as it has only been applied in the economics. In factor analysis it is advisable to combine all the weights of the factors and the resultant variable into one factor indicating the rank of importance of the given explanatory variables in infl uencing the resultant variable, while the remaining factors are uncorrelated with the resultant variable. The procedure shows that wind speed, rainfall, and temperature range are the most important, while minimum temperature and irradiance are the least important meteorological variables infl uencing daily pollen ratios. We found a tendency to stronger associations between the meteorological variables and the pollen variable when the pollen ratio was 1 or below. This is due to the fact that data corresponding to the pollen ratio over 1 come mainly from the pre- peak pollen season, while data corresponding to less than 1 are characteristic of the post-peak pollen season (late summer to early autumn).
KEY WORDS: allergenic pollen, Ambrosia artemisiifolia, meteorological parameters, plant physiology, pollen transport, respiratory disease
Air pollution, as a major and ever increasing environmental hazard, is associated with increased cost of health insurance (1). The prevalence of allergic respiratory diseases has also increased extensively over the last three decades (2). Historical records have demonstrated that the prevalence of allergic rhinitis and allergic asthma have signifi cantly increased over the past two centuries (3). Although the reasons for this increase are not entirely clear, epidemiological data suggest that particular pollutants produced by
burning fossil fuels may have played a substantial role in increasing this prevalence (3).
Pollen allergy has become a widespread disease by the end of the 20th century. Around 20 % of the general population in Europe suffers from this immune system disorder (4). Hungary is exposed to one of the most severe air pollutions in Europe (5); in addition, airborne pollen levels here are also high. The Carpathian basin, which includes Hungary (Figure 1), is considered the most polluted region with airborne
ragweed (Ambrosia artemisiifolia) pollen in Europe (6-10). Ragweed in Hungary discharges the most pollen of all taxa (11, 12). In Szeged in the southern Hungary, the ratio of its pollen release compared to the total pollen release in the late summer is around 60 % to 71 % (13). The highest counts on peak days in Szeged are about one order of magnitude higher than those over other cities in Europe (14). The prevalence of sensitivity to ragweed in Szeged is 83.7 % (15). Ragweed-related allergy and asthma have become the dominant health issue in Hungary over the past few decades (16, 17). Recently, 20 % of the total population suffers from allergic diseases and for one-third of these patients may also suffer from asthma (18). In 60 % to 90 % of patients pollen allergy is ragweed-related (19). The number of patients with registered allergic diseases has doubled over the last 40 years, and the number of patients with allergic asthma has quadrupled in the southern Hungary by the late 1990s (12).
Knowledge of the association between daily ragweed pollen concentrations and daily meteorological parameters may have a great practical importance.
Applying simple statistical analysis, several studies have detected signifi cant positive correlations of daily ragweed pollen counts with daily maximum temperature (20), daily mean temperature (6, 7, 21- 23), daily mean wind speed (23), and daily maximum wind speed (22) and signifi cant negative correlations with relative humidity (21-23) and rainfall (7, 23, 24).
Furthermore, Ziska et al. (25) established that the association between higher temperatures and higher ragweed pollen counts was stronger in urban than in rural locations. Wind direction analysis has shown that either long-range transport or local sources could play an important role in ragweed pollen concentrations (20, 23).
However, meteorological elements affect pollen concentration not by means of their individual values but through their interrelationships (26). This is why it could be useful to study the association between daily ragweed pollen concentrations with daily values of meteorological parameters as a whole. Only a few papers have reported results of this kind of approach, using multivariate statistical analysis. They generally defi ne the most homogeneous groups as objective classes of meteorological parameters (27-30) using factor and cluster analyses to associate them with a given pollen variable.
The aim of this study was to determine possible reasons for day-to-day variations in ragweed pollen
counts for Szeged in view of meteorological parameters. For this purpose, we used factor analysis with special transformation of daily meteorological and ragweed pollen data to establish the strength of associations between meteorological (explanatory) variables and ragweed pollen ratio (resultant) variable.
Factor analysis with special transformation is a procedure that has not yet been applied for studying this kind of relationships.
MATERIALS AND METHODS
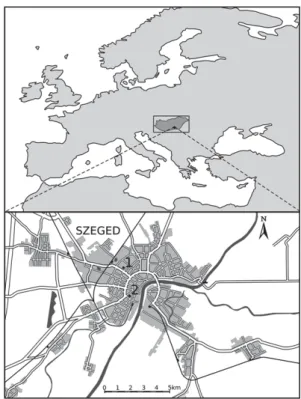
Szeged (46.25°N; 20.10°E) is the largest city in the southeast of Hungary (Figure 1). The area is located in the Great Hungarian Plain with an elevation of 79 m above mean sea level. The city area covers about 46 km2. The city is the centre of the Szeged region with 203,000 inhabitants. According to the Köppen system, the climate in Szeged is of the Ca type (warm temperate climate) with relatively mild and short winters and hot summers (31). Airborne ragweed pollen content was measured using a 7-day recording “Hirst-type” volumetric trap (32). The air sampler was located about 20 m above the ground (Figure 1, lower panel).
Figure 1 Location of Hungary in Europe (upper panel) and the map of Szeged with the locations of 1 - the meteorological monitoring station and 2 - aerobiological station (lower panel)
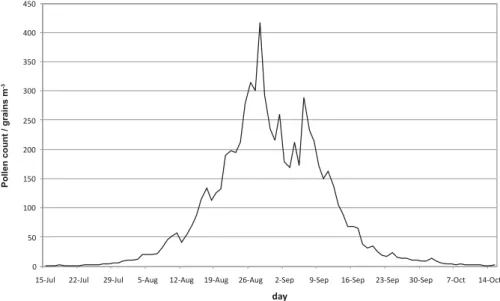
Our database includes ten years (1997 to 2006) of daily ratios of ragweed pollen counts (A - a value on the given day per value on the day before) and daily differences (a value on the given day minus the value on the day before) of eight meteorological variables (mean temperature, minimum temperature, maximum temperature, temperature range, irradiance, relative humidity, wind speed, and rainfall) over the ragweed pollen season (15 July to 16 October) (Figure 2).
The Ambrosia genus has only one species, Ambrosia artemisiifolia (common ragweed) in the Szeged region. It is present both in the city and in the countryside. Ragweed is particularly common in the west of the town. The prevailing northwest wind can easily transport pollen into the city. Since in the sandy region northwest of Szeged, stubble stripping is not necessary for ground-clearance due to the mechanical properties of sandy soils, ragweed can spread unchecked. Furthermore, due to newly-built motorways around Szeged several farmlands have remained uncultivated, which also favours the spread of ragweed.
For the start and the end of the season we used the fi rst and the last date on which at least one pollen grain per cubic metre of air was recorded for at least fi ve consecutive days (33). Evidently, the pollen season varies from year to year. For our analysis we used the absolute longest observed pollen season over the ten- year period even if the remaining years had either remarkably late start or early end.
For each day of the analysis, daily differences in meteorological variables were paired with the daily
ratios of ragweed pollen counts (A). Three data sets were subjected to an analysis: (1) the total data set, (2) those daily differences in meteorological variables for which A≤1, and (3) those for which A>1. Days falling in respective data sets were classifi ed into four categories: (a) rainy day preceded by a rainy day; (b) rainy day preceded by a dry day; (c) dry day preceded by a rainy day; and (d) dry day preceded by a dry day.
Factor analysis with special transformation
Factor analysis identifies linear relationships between subsets of variables, and this helps to reduce the dimensionality of the initial database without substantial loss of information. We started with a dataset consisting of eight variables (seven meteorological parameters as explanatory variables and daily ratios of ragweed pollen counts as the resultant variable) in order to reduce the original number of variables. The newly combined variables (called factors) can explain the behaviour of meteorological and ragweed pollen variables. The optimum number of retained factors can be determined using different statistical criteria (34). The most common and widely accepted criterion is setting the lowest percentage (80 %) of total variance in the original variables (35). After factor analysis, we transformed the retained factors to see to what degree the explanatory variables affected the resultant variable and to rank their infl uence (36). In factor analysis of standardised variables the received factor loadings are the correlation coeffi cients between the
Figure 2 Mean daily ragweed pollen counts over the pollen season (15 July to 16 October) in Szeged between 1997 and 2006
0 50 100 150 200 250 300 350 400 450
15-Jul 22-Jul 29-Jul 5-Aug 12-Aug 19-Aug 26-Aug 2-Sep 9-Sep 16-Sep 23-Sep 30-Sep 7-Oct 14-Oct day
pollengrains/m3Pollen count / grains m-3
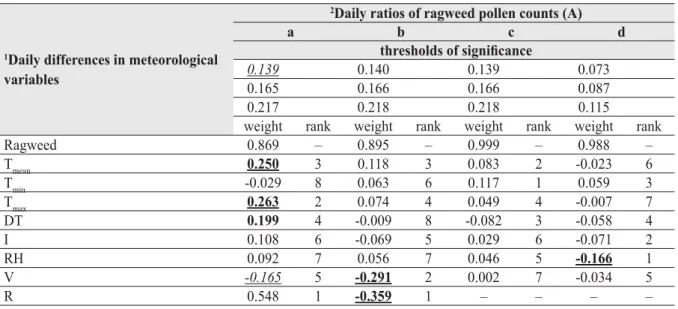
Table 1 Special transformation. The effect of the daily differences in meteorological (explanatory) variables on the daily ragweed pollen ratios (A)2 (resultant variables) and the ranking of the explanatory variables. Signifi cant factor loadings are indicated with fi gures in underlined italics (x0.10), bold (x0.05), and underlined bold (x0.01).
1Daily differences in meteorological variables
2Daily ratios of ragweed pollen counts (A)
a b c d
thresholds of signifi cance
0.139 0.140 0.139 0.073
0.165 0.166 0.166 0.087
0.217 0.218 0.218 0.115
weight rank weight rank weight rank weight rank
Ragweed 0.869 – 0.895 – 0.999 – 0.988 –
Tmean 0.250 3 0.118 3 0.083 2 -0.023 6
Tmin -0.029 8 0.063 6 0.117 1 0.059 3
Tmax 0.263 2 0.074 4 0.049 4 -0.007 7
DT 0.199 4 -0.009 8 -0.082 3 -0.058 4
I 0.108 6 -0.069 5 0.029 6 -0.071 2
RH 0.092 7 0.056 7 0.046 5 -0.166 1
V -0.165 5 -0.291 2 0.002 7 -0.034 5
R 0.548 1 -0.359 1 – – – –
1: value on the given day minus value on the day before;
2: value on the given day divided by value on the day before;
a: rainy day preceded by a rainy day;
b: rainy day preceded by a dry day;
c: dry day preceded by a rainy day;
d: dry day preceded by a dry day;
Tmean = daily mean temperature; Tmin = daily minimum temperature, Tmax = daily maximum temperature, DT = daily temperature range;
I = irradiance, RH = relative humidity; V = wind speed; R = rainfall;
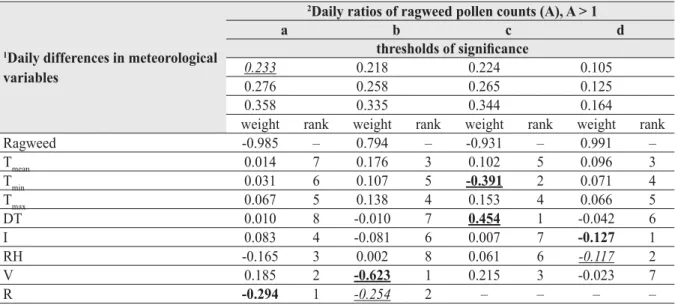
Table 2 Special transformation. The effect of the daily differences in meteorological (explanatory) variables1 on the daily ratios of ragweed pollen ratios (A)2, A≤1 (resultant variables) and the ranking of the explanatory variables. Signifi cant factor loadings are indicated with fi gures in underlined italics (x0.10), bold (x0.05), and underlined bold (x0.01).
1Daily differences in meteorological variables
2Daily ratios of ragweed pollen counts (A), A ≤ 1
a b c d
thresholds of signifi cance
0.185 0.197 0.191 0.106
0.220 0.233 0.225 0.126
0.286 0.304 0.294 0.167
weight rank weight rank weight rank weight rank
Ragweed -0.790 – -0.813 – 0.656 – -0.929 –
Tmean 0.193 4 0.087 5 0.181 5 0.260 1
Tmin -0.166 6 0.165 2 -0.316 4 -0.023 7
Tmax 0.170 5 0.027 8 0.397 3 0.234 2
DT 0.249 2 -0.129 4 0.553 2 0.151 4
I 0.000 8 -0.156 3 0.160 6 -0.144 5
RH -0.072 7 -0.064 6 -0.084 7 0.176 3
V -0.243 3 -0.657 1 -0.631 1 -0.119 6
R -0.725 1 -0.058 7 – – – –
1: value on the given day minus value on the day before;
2: value on the given day divided by value on the day before;
a: rainy day, preceded by a rainy day;
b: rainy day, preceded by a dry day;
c: dry day, preceded by a rainy day;
d: dry day, preceded by a dry day;
Tmean = daily mean temperature; Tmin = daily minimum temperature, Tmax = daily maximum temperature, DT = daily temperature range;
I = irradiance, RH = relative humidity; V = wind speed; R = rainfall;
original variables and the factors. Consequently, if the resultant variable strongly correlates with a factor (if a factor has high factor loading at the place of the resultant variable), and an infl uencing variable highly correlates with the factor, then the infl uencing variable also highly correlates with the resultant variable.
Therefore, it is advisable to combine all the weights of the factors into one factor. This can done by rotating the factors. As a result of the rotation, factor loadings will be very close to either 0 or 1. In this way we can more easily determine to which group of variables an individual factors belongs to. There are different rotation techniques. We use varimax rotation that produces uncorrelated factors after factor rotation. It is useful to rotate the factors so that only one factor has a great load on the resultant variable and the remaining factors are uncorrelated with the resultant variable (35). This procedure is called special transformation.
RESULTS AND DISCUSSION
Factor analysis with special transformation
In the total set, factor analysis yielded four factors for category (a), fi ve for category (b), four for category (c), and four for category (d) (Table 1). In the data set with A≤1, it yielded four factors in category (a), fi ve in category (b), three in category (c), and four in category (d) (Table 2). In the data set A>1, four factors were retained for each category (Table 3). In order to rank the importance of the explanatory (meteorological) variables for the resultant variable (daily ratios of ragweed pollen counts), loadings of the retained factors were projected onto Factor 1 (the one that has the greatest load on the resultant variable) for all twelve factor analyses with the special transformation (Tables 1-3) (36).
We analysed only the relationships between the meteorological and pollen variables that were signifi cant at 10 %, 5 %, and 1 % probability levels.
In the total data set (Table 1), rainfall (R), maximum temperature (Tmax), mean temperature (Tmean), and temperature range (ΔT) were the most important variables for category (a) with a proportional correlation with daily ratios of ragweed pollen counts.
At the same time, wind speed (V) showed a weak inverse correlation with the resultant variable. For category (b), rainfall (R) and wind speed (V) were the only relevant meteorological parameters, both
influencing inversely the resultant variable. For category (c), there were no signifi cant explanatory variables, while for category (d) only relative humidity (RH) showed a signifi cant inverse correlation with daily pollen ratios.
In the data set A≤1 (Table 2), rainfall (R) and wind speed (V) showed proportional, while temperature range (ΔT) and mean temperature (Tmean) showed inverse correlation with the resultant variable for category (a). Wind speed (V) was the only signifi cant parameter for category (b), with a positive correlation with daily pollen ratios. For category (c) signifi cant inverse correlation was found for wind speed (V) and minimum temperature (Tmean), while temperature range (ΔT) and maximum temperature (Tmax) showed a positive correlation with the resultant variable. For category (d), mean temperature (Tmean), maximum temperature (Tmax), relative humidity (RH), and temperature range (ΔT) showed signifi cant inverse correlation, while irradiance (I) and wind speed (V) positive correlation with the resultant variable.
In the data set A>1 (Table 3), the resultant variable positively correlated with rainfall (R) for category (a), while for category (b) it inversely correlated with rainfall (R) and wind speed (V) as the most important variables. For category (c), temperature range (ΔT) showed negative, while minimum temperature (Tmean) showed positive correlation with the resultant variable.
For category (d), irradiance (I) and relative humidity (RH) were the most important variables, infl uencing inversely daily pollen ratios.
Variable ranking
Rainfall (R) is one of the fi rst two most important meteorological parameters for all three data sets, except for category (b) of the A≤1 dataset (Table 2).
For category (a) rainfall positively correlates with daily pollen ratios in all three data sets (Table 1-3).
Rainfall generally stimulates pollen production, but this is not an immediate effect. Increased rainfall results in a higher biomass that leads to higher pollen concentration. For category (b) in the total data set (Table 1) and in the data set A>1 (Table 3) rainfall is in inverse correlation with daily pollen ratios. This association can be explained by the immediate wash- out effect; air pollen content drops sharply after rainfall (23, 37, 38). Another reason may be that rainfall is accompanied by a temperature drop, which slows down plant metabolism (39) (Table 1; Table 3).
However, this association is not direct. Pollen release depends on the dehiscence of the fl owers, which in
turn is linked to meteorological conditions, relative humidity in particular. Experimental studies on excised ragweed fl owers and whole plants confi rmed that the opening of fl owers can be controlled by regulating temperature and relative humidity. Lower temperature slows down or inhibits extension of anthers while higher humidity delays or stops the opening of pollen sacs (40). The role of rainfall in daily pollen counts is not clear. Fornaciari et al. (41) and Galán et al. (42) fi nd it complex because intense rain can lower pollen count. Fornaciari et al. (41) obtained the best correlation by comparing pollen concentrations of Urticaceae and meteorological parameters on dry days. Ragweed pollen count negatively correlated with rainfall in several studies (7, 23, 24, 37, 43), but Bartkova-Scevkova (21) found no statistically signifi cant association.
The importance of mean temperature (Tmean) in our study varied between data sets and categories (Tables 1-3). For category (a) in the total data set (Table 1) it was in positive, while for categories (a) and (d) in the data set A≤1 (Table 2) it was in inverse correlation with daily pollen ratios. If humidity is favourable, an increase in mean temperature (Tmean), if it is not too far from its optimum value, can accelerate vegetative and hence generative functions, which can increase airborne pollen concentrations [Table 1, category (a)]
(21, 23, 45). If humidity is low, an excessive increase in mean temperature (Tmean) can inhibit pollination, as the plant seeks to preserve water to maintain its vegetative life functions in contrast to the generative functions (39). This is why mean temperature (Tmean) showed inverse correlation with daily ratios of ragweed pollen counts for categories (a) and (d) (Table 2).
Minimum temperature (Tmin) was relevant for category (c), inverse in the data set A≤1 (Table 2) and positive in the data set A>1 (Table 3). The reason for the inverse relationship is that if preceding day is rainy, rainfall can lower temperature early in the morning.
On the other hand, the reason for the positive correlation may be that low minimum temperature can inhibit ragweed pollen release as it slows down life functions (Table 3).
Maximum temperature (Tmax) significantly correlated with daily pollen ratios for category (a) in the total data set (Table 1). However, it was in proportional and inverse correlation with the resultant variable for categories (c) and (d) in the data sets A≤1, respectively (Table 2). The proportional relationship may be explained as follows: anthers dehisce and
release pollen when anther sacs walls dehydrate (44), which is facilitated by higher maximum temperatures.
This association may not be valid on a dry day preceded by a dry day [category (d) in the data set with A≤1; Table 2]. In the summer, extremely high maximum temperatures may limit pollen release as water defi ciency can prompt the plant to preserve the remaining water and stop releasing pollen.
Temperature range (DT) is in a signifi cant positive correlation with the daily ratios of ragweed pollen counts for category (a) in the total data set (Table 1) and for category (c) in the data set A≤1 (Table 2). In the same data set, this variable showed an inverse correlation for categories (a) and (d) (Table 2). The same is true for category (c) in the data set A>1 (Table 3). The reason for inverse correlation is that very low temperatures slow down plant metabolism and pollen release, while extremely high temperatures force the plant to preserve water, which also lowers pollen release. Accordingly, the greater the temperature range (DT), the lower the pollen count.
Irradiance (I) showed positive correlation with daily ragweed pollen ratios for category (d) in the data set A≤1 (Table 2) and negative correlation in the data set A>1 (Table 3). The positive correlation is due to the fact that irradiance favours vegetative processes important for releasing pollen. Inverse correlation may be owed to extremely high irradiance (I) that increases mean temperature (Tmean), forcing the plant to limit its functions on preserving water (39).
Relative humidity (RH) was inversely associated with daily pollen ratios for category (c) in all three data sets (Tables 1-3). In general, pollen shedding is associated with shrinkage and rupture of anther walls at low relative humidity (44). Hence, relative humidity is inversely associated with pollen release (21, 45).
Furthermore, humid air makes pollen grains stick together, which in turn contributes to the inverse association (23).
Wind speed (V) showed inverse correlation with daily ragweed pollen ratios for categories (a) and (b) in the total data set (Table 1), for all categories in the data set A>1 (Table 3), and for category (c) in the data set A≤1 (Table 2). Correlation was positive for categories (a), (b), and (d) in the data set A≤1 (Table 2). When analysing the role of wind speed one should take into account its physical properties (39), plant physiology (39), and the range of pollen transport (46).
Wind can hinder sticking of pollen grains (46), and higher speeds increase evapotranspiration, forcing the plant to preserve water at the expense of pollination.
Long-range pollen transport may also have a substantial effect on local pollen counts (46).
Gioulekas et al. (45), Kasprzyk (23), and Hernández- Ceballos et al. (38) reported positive association between wind speed and daily pollen ratios. However, if mean temperature (Tmax) favours ragweed pollen release, then wind may take away locally released pollen and bring a smaller amount of pollen from far away to the local environment. Extremely high mean temperature (Tmax) may signifi cantly reduce available water and limit pollen release. In this case, wind may bring a greater amount of pollen from far away than the amount of locally released pollen.
CONCLUSIONS
Our factor analysis with special transformation has singled out wind speed (V), rainfall (R), and temperature range (ΔT) as the most important parameters for daily ratios of ragweed pollen counts.
In contrast, minimum temperature (Tmin) and irradiance (I) were the least important meteorological variables infl uencing the resultant variable. After dividing the
total data set in two groups, we established stronger associations between meteorological variables and the pollen ratio in the data set A≤1 (Table 2) than A>1 (Table 3). This is due to the fact that A>1 data mainly correspond to the pre-peak pollen season, while A≤1 data mainly correspond to the post-peak pollen season.
Weather conditions during early autumn are not optimal for ragweed pollen release. Additionally, although particular meteorological parameters might favour pollen release, the association might be inverse if the pollen season is nearing its end, and plants are fl owering less. This is may be the main reason for the differences between the two datasets.
Acknowledgements
The authors would like to thank Gábor Motika (Environmental Conservancy Inspectorate, Szeged, Hungary) for providing meteorological data, Miklós Juhász (University of Szeged) for providing ragweed pollen data, and Zoltán Sümeghy (University of Szeged) for the digital mapping in Figure 1. This study received fi nancial support from the European Union and the European Social Fund (project grant agreement nos. TAMOP 4.2.1/B-09/1/KMR-2010-0003, TAMOP-
Table 3 Special transformation. The effect of the daily differences in meteorological variables1 on the daily ratios of ragweed pollen ratios (A)2, A>1 (resultant variables) and the ranking of the explanatory variables. Signifi cant factor loadings are indicated with fi gures in underlined italics (x0.10), bold (x0.05), and underlined bold (x0.01).
1Daily differences in meteorological variables
2Daily ratios of ragweed pollen counts (A), A > 1
a b c d
thresholds of signifi cance
0.233 0.218 0.224 0.105
0.276 0.258 0.265 0.125
0.358 0.335 0.344 0.164
weight rank weight rank weight rank weight rank
Ragweed -0.985 – 0.794 – -0.931 – 0.991 –
Tmean 0.014 7 0.176 3 0.102 5 0.096 3
Tmin 0.031 6 0.107 5 -0.391 2 0.071 4
Tmax 0.067 5 0.138 4 0.153 4 0.066 5
DT 0.010 8 -0.010 7 0.454 1 -0.042 6
I 0.083 4 -0.081 6 0.007 7 -0.127 1
RH -0.165 3 0.002 8 0.061 6 -0.117 2
V 0.185 2 -0.623 1 0.215 3 -0.023 7
R -0.294 1 -0.254 2 – – – –
1: value on the given day minus value on the day before;
2: value on the given day divided by value on the day before;
a: rainy day, preceded by a rainy day;
b: rainy day, preceded by a dry day;
c: dry day, preceded by a rainy day;
d: dry day, preceded by a dry day;
Tmean = daily mean temperature; Tmin = daily minimum temperature, Tmax = daily maximum temperature, DT = daily temperature range;
I = irradiance, RH = relative humidity; V = wind speed; R = rainfall
4.2.1/B-09/1/KONV-2010-0005 and TAMOP-4.2.2/B- 10/1-2010-0012).
REFERENCES
1. Cohen AJ, Anderson HR, Ostro B, Pandey KD, Krzyzanowski M, Künzli N, Gutschmidt K, Pope A, Romieu I, Samet JM, Smith K. The global burden of disease due to outdoor air pollution. J Toxicol Environ Health A 2005;68:1301-7.
2. D’Amato G. Environmental urban factors (air pollution and allergens) and the rising trends in allergic respiratory diseases.
Allergy 2002;57(Suppl 72):30-3.
3. Peterson B, Saxon A. Global increases in allergic respiratory disease: The possible role of diesel exhaust particles. Ann Allerg Asthma Immunol 1996;77:263-70.
4. D’Amato G, Cecchi L, Bonini S, Nunes C, Annesi-Maesano I, Behrendt H, Liccardi G, Popov T, van Cauwenberge P.
Allergenic pollen and pollen allergy in Europe. Allergy 2007;62:976-90.
5. Ågren C. Particles killing half a million. Acid News. AirClim [displayed 5 July 2012]. Available at http://www.airclim.
org/acidnews/2010/AN2-10/particles-killing-half-million 6. Štefanić E, Kovačević V, Lazanin Ž. Airborne ragweed pollen
concentration in north-eastern Croatia and its relationship with meteorological parameters. Ann Agric Environ Med 2005;12:75-9.
7. Peternel R, Čulig J, Hrga I, Hercog P. Airborne ragweed (Ambrosia artemisiifolia L.) pollen concentrations in Croatia, 2002-2004. Aerobiologia 2006;22:161-8.
8. Ianovici N, Sîrbu C. Analysis of airborne ragweed (Ambrosia artemisiifolia L.) pollen in Timişoara, 2004. Analele Universităţii din Oradea, Fascicula Biologie 2007;14:101- 8.
9. Chrenová J, Mičieta K, Ščevková J. Monitoring of Ambrosia pollen concentration in the atmosphere of Bratislava (Slovakia) during years 2002–2007. Aerobiologia 2010;26:83- 8.
10. Šikoparija B, Smith M, Skjøth CA, Radišić P, Milkovska S, Šimić S, Brandt J. The Pannonian plain as a source of Ambrosia pollen in the Balkans. Int J Biometeorol 2009;53:263-272.
11. Járai-Komlódi M, Juhász M. Ambrosia elatior (L.) in Hungary (1989-1990). Aerobiologia 1993;9:75-8.
12. Makra L, Juhász M, Borsos E, Béczi R. Meteorological variables connected with airborne ragweed pollen in Southern Hungary. Int J Biometeorol 2004;49:37-47.
13. Juhász M, Juhász IE. A hazai gyomnövények aeropollinológiai jelentősége [Aeropollinological importance of domestic weeds, in Hungarian]. Környezeti ártalmak és a légzőrendszer 2002;12:149-60.
14. Makra L, Juhász M, Béczi R, Borsos E. The history and impacts of airborne Ambrosia (Asteraceae) pollen in Hungary. Grana 2005;44:57-64.
15. K a d o c s a E , J u h á s z M . A s z é n a n á t h á s b e t e g e k allergénspektrumának változása a Dél-Alföldön (1990-1998) [Change of allergen spectrum of hay-fever patients in Southern Great Plain (1990-1998), in Hungarian]. Orvosi Hetilap 2000;141:12617-20.
16. Kazinczi G, Béres I, Pathy Zs, Novák R. Common ragweed (Ambrosia artemisiifolia L.): a review with special regards
to the results in Hungary. II. Importance and harmful effect, allergy, habitat, allelopathy and benefi cial characteristics.
Herbologia 2008;9:56-93.
17. Páldy A, Bobvos J, Magyar D, Nékám K, Bitay Zs, Csajbók V, Kelemen A. Parlagfűallergia. A parlagfű pollinózis – a poliszenzitizáltság kezdete? [Ragweed allergy. Ragweed pollinosis – beginning of pollen sensitization? in Hungarian].
Egészségtudomány 2010;54:47-55.
18. Strausz J, Böszörményi Nagy Gy, Csekeő A, Csoma Zs, Herjavecz I, Kovács G, Nyári L, Ostoros Gy, Zsarnóczai I.
[A pulmonológiai intézmények 2009 évi epidemiológiai és működési adatai, in Hungarian]. Korányi Bulletin 2010;2:2- 25.
19. Harsányi E. [Parlagfû és allergia, in Hungarian].
Növényvédelem 2009;45:454-8.
20. Stepalska D, Myszkowska D, Wolek J, Piotrowicz K, Obtulowicz K. The infl uence of meteorological factors on Ambrosia pollen loads in Cracow, Poland, 1995-2006. Grana 2008;47:297-304.
21. Bartkova-Scevkova J. The infl uence of temperature, relative humidity and rainfall on the occurrence of pollen allergens (Betula, Poaceae, Ambrosia artemisiifolia) in the atmosphere of Bratislava (Slovakia). Int J Biometeorol 2003;48:1-5.
22. Puc M. Ragweed and mugwort pollen in Szczecin, Poland.
Aerobiologia 2006;22:67-78.
23. Kasprzyk I. Non-native Ambrosia pollen in the atmosphere of Rzeszów (SE Poland); evaluation of the effect of weather conditions on daily concentrations and starting dates of the pollen season. Int J Biometeorol 2008;52:341-51.
24. Peternel R, Čulig J, Srnec L, Mitić B, Vukušić I, Hrga I.
Variation in ragweed (Ambrosia artemishfolia L.) pollen concentration in central Croatia, 2002-2003. Ann Agric Environ Med 2005;12:11-6.
25. Ziska LH, Gebhard DE, Frenz DA, Faulkner S, Singer BD, Straka JG. Cities as harbingers of climate change: Common ragweed, urbanization, and public health. J Allergy Clin Immunol 2003;111:290-5.
26. Matyasovszky I, Makra L, Guba Z, Pátkai Zs, Páldy A, Sümeghy Z. Estimating the daily Poaceae pollen concentration in Hungary by linear regression conditioning on weather types. Grana 2011;50:208-16.
27. Makra L, Juhász M, Mika J, Bartzokas A, Béczi R, Sümeghy Z. An objective classifi cation system of air mass types for Szeged, Hungary with special attention to plant pollen levels.
Int J Biometeorol 2006;50:403-21.
28. Hart MA, de Dear R, Beggs PJ. A synoptic climatology of pollen concentrations during the six warmest months in Sydney, Australia. Int J Biometeorol 2007;51:209-20.
29. Makra L, Tombácz Sz, Bálint B, Sümeghy Z, Sánta T, Hirsch T. Infl uences of meteorological parameters and biological and chemical air pollutants to the incidence of asthma and rhinitis. Climate Res 2008;37:99-119.
30. Tonello MS, Prieto AR. Modern vegetation-pollen-climate relationships for the Pampa grasslands of Argentina. J Biogeogr 2008;5:926-38.
31. Köppen W. [Grundriss Der Klimakunde, in German]. Berlin:
Walter De Gruyter & Co; 1931.
32. Hirst JM. An automatic volumetric spore trap. Ann Appl Biol 1952;39:257-65.
33. Galán C, Cariňanos P, García-Mozo H, Alcázar P, Domínguez- Vilches E. Model for forecasting Olea europaea L. airborne pollen in South-West Andalusia, Spain. Int J Biometeorol 2001;45:59-63.
34. Jolliffe IT. Principal component analysis: A beginner’s guide – II. Pitfalls, myths and extensions. Weather 1993;48:246- 53.
35. Liu PWG. Simulation of the daily average PM10 concentrations at Ta-Liao with Box-Jenkins time series models and multivariate analysis. Atmos Environ 2009;43:2104-13.
36. Jahn W, Vahle H. [Die Faktoranalyse und ihre Anwendung, in German]. Berlin: Verlag die Wirtschaft; 1968.
37. Déchamp C, Penel V. Bilan des comptes polliniques de l’année 2001, du réseau Surveillance Ambroisie Rhône-Alpes (SARA) [Results of pollen counts for 2001 from the Rhone- Alpes ragweed pollen-monitoring network (SARA), in Franch]. Rev Fr Allergol Clin Immunol 2002;42:539-42.
38. Hernández-Ceballos MA, García-Mozo H, Adame JA, Domínguez-Vilches E, De la Morena, BA, Bolívar JP, Galán C. Synoptic and meteorological characterisation of olive pollen transport in Córdoba province (south-western Spain).
Int J Biometeorol 2011;55:17-34.
39. Deák JÁ. Habitat-pattern and landscape ecological evaluation of the micro-regions of Csongrád county. [PhD thesis].
Szeged: University of Szeged, Faculty of Nature Science and Informatics; 2010.
40. Bianchi DE, Schwemmin DJ, Wagner Jr WH. Pollen release in the common ragweed (Ambrosia artemisiifolia). Bot Gaz 1959;120:235-43.
41. Fornaciari M, Bricchi E, Greco F, Fascini D, Giannoni C, Frenguelli G, Romano B. Daily variations of Urticaceae pollen count and infl uence of meteoclimatic parameters in East Perugia during 1989. Aerobiologia 1992;8:407-13.
42. Galán C, Alcázar P, Cariňanos P, Garcia H, Domínguez- Vilches E. Meteorological factors affecting daily Urticaceae pollen counts in southwest Spain. Int J Biometeorol 2000;43:191-5.
43. Barnes C, Pacheco F, Landuyt J, Hu F, Portnoy J. Hourly variation of airborne ragweed pollen in Kansas City. Ann Allergy Asthma Immunol 2001;86:166-71.
44. Kozlowski TT, Pallardy SG. Acclimation and adaptive responses of woody plants to environmental stresses. Bot Rev 2002;68:270-334.
45. Gioulekas D, Balafoutis C, Damialis A, Papakosta D, Gioulekas G, Patakas D. Fifteen years’ record of airborne allergenic pollen and meteorological parameters in Thessaloniki, Greece. Int J Biometeorol 2004;48:128-36.
46. Makra L, Sánta T, Matyasovszky I, Damialis A, Karatzas K, Bergmann KC, Vokou D. Airborne pollen in three European cities: Detection of atmospheric circulation pathways by applying three-dimensional clustering of backward trajectories. J Geophys Res 2010;115:D24220. doi:10.1029/
2010JD014743
Sažetak
POVEZANOST IZMEĐU VREMENSKIH UVJETA I VARIJACIJA U PELUDU AMBROZIJE U OKOLICI GRADA SZEGEDA, MAĐARSKA
Primjenom prilagođene metode faktorske analize istražili smo povezanost između dnevnih varijacija u koncentracijama peludnih zrnaca ambrozije u zraku i meteoroloških varijabli u okolici grada Szegeda u južnoj Mađarskoj. Koristili smo bazu podataka prikupljenih tijekom desetogodišnjeg razdoblja (1997.- 2006.) za dnevne omjere u koncentracijama peludnih zrnaca ambrozije (vrijednost određena na promatrani dan podijeljena s vrijednošću određenom prethodnog dana) i dnevne razlike u koncentracijama peludnih zrnaca ambrozije (vrijednost određena na promatrani dan od koje je oduzeta vrijednost određena prethodnog dana) te podatke o osam meteoroloških varijabli (prosječna temperatura, minimalna temperatura, maksimalna temperatura, raspon temperatura, sijanje sunca, relativna vlažnost, brzina vjetra, padaline) tijekom sezona cvatnje ambrozije. Prikazali smo novu metodu za ovo područje istraživanja, jer je ona do sada bila primjenjivana samo u ekonomiji. U faktorskoj analizi poželjno je sve faktorske težine i izlaznu varijablu kombinirati u jedan faktor koji označava razinu važnosti pojedinih nezavisnih varijabli u utjecaju na izlaznu varijablu, dok preostali faktori nisu u korelaciji s izlaznom varijablom. Primjenom spomenutoga statističkog modela utvrdili smo da su najvažnije meteorološke varijable brzina vjetra, padaline i raspon temperatura, dok su minimalna temperatura i sijanje sunca imali najmanje utjecaja na dnevne omjere u koncentracijama peludnih zrnaca ambrozije u promatranu razdoblju. Uočili smo sklonost prema jačoj povezanosti između meteoroloških varijabli i varijabli peluda u slučajevima kad je omjer u koncentracijama peludnih zrnaca iznosio 1,00 ili niže. To tumačimo činjenicom da su podaci koji se odnose na omjer u koncentracijama peludnih zrnaca veći od 1,00 uglavnom dobiveni u razdoblju koje prethodi vrhuncu sezone cvatnje ambrozije, dok su podaci koji se odnose na omjer u koncentracijama peludnih zrnaca manji od 1,00 karakteristični za razdoblje koje slijedi nakon vrhunca sezone cvatnje ambrozije (kasno ljeto – rana jesen).
KLJUČNE RIJEČI: alergeni pelud, ambrozija, bolesti dišnog sustava, fi ziologija bilja, meteorološki parametri, prijenos peludnih zrnaca
CORRESPONDING AUTHOR:
László Makra
Department of Climatology and Landscape Ecology University of Szeged
P.O. Box 653,
H-6701 Szeged, Hungary E-mail: makra@geo.u-szeged.hu