Universitatis Szegediensis, Tomus 46, 2012, 51-59
ASSOCIATION OF EXTREME HIGH AND LOW TEMPERATURES AND PRECIPITATION TOTALS WITH DAILY AND ANNUAL POLLEN
CONCENTRATIONS OF AMBROSIA AND POPULUS IN SZEGED, SOUTHERN HUNGARY
Z CSÉPE1, L MAKRA1, I MATYASOVSZKY2, A PÁLDY3 and ÁJ DEÁK4
1Department of Climatology and Landscape Ecology, University of Szeged, P.O.Box 653, 6701 Szeged, Hungary E-mail: csepe.zoltan@gmail.com
2Department of Meteorology, Eötvös Loránd University, Pázmány Péter Street 1/A, 1117 Budapest, Hungary
3Fodor József National Institute of Environmental Health, Gyáli Street 2-6, 1097 Budapest, Hungary
4Department of Physical Geography and Geoinformatics, University of Szeged, P.O.Box 653, 6701 Szeged, Hungary
Summary: The aim of this study is to analyse the associations between pollen characteristics and extreme values of meteorological variables, furthermore to make an association between the rank of pollen characteristics and the rank of annual values of meteorological variables for Szeged in Southern Hungary. Pollen season (start, end and duration), as well as pollen quantity (total annual pollen amount, i.e. TPA and annual peak pollen concentration) characteristics, furthermore data sets of temperature and precipitation are considered for a 14-year period (1997- 2010). The data set also contains daily values of Ambrosia (ragweed) and Populus (poplar) pollen concentrations, as well as temperature and precipitation. Correlation analysis between the original variables and between their ranks was performed. We received that both taxa were sensitive either to temperature or precipitation. On the whole, due to a warming and drying climate, pollen quantity characteristics indicate a decrease for Ambrosia, while for Populus an increase is expected.
Key words: Ambrosia, Populus, pollen counts, pollination period
1. INTRODUCTION
The weather-related daily variability of pollen concentrations has a wide range of literature. Some of them study the relationship of meteorological parameters and daily pollen concentrations (e.g. Bartková-Ščevková 2003, Rodríguez-Rajo et al. 2005, Štefanič et al. 2005, Kasprzyk 2008, Recio et al. 2010). While others, based on meteorological data, use different techniques for predicting pollen characteristics (e.g. Galán et al. 2001, Aznarte et al. 2007, García-Mozo et al. 2009).
The role of extreme weather events to daily pollen concentrations has so far received little attention. Frei (2004, 2006) studied the co-occurrences of extreme events (storms, floods or droughts) with extreme birch and grass pollen concentrations in the data set of Basel. The heat wave over Europe in summer 2003 with mean temperature exceeding the 1961-1990 mean by about 5°C in June, July and August substantially influenced pollen phenology and pollen production in Switzerland (Gehrig 2006). The grass pollen season was most affected starting 1-2 weeks earlier and ending 7-33 days earlier than in general.
Extremely high Chenopodium, Plantago and Poaceae daily pollen concentrations were
measured in that pollen season. Cariňanos et al. (2000) analyzed the yearly distribution and severity of Artemisia and Chenopodiaceae-Amaranthaceae pollen load indicating the highest and very high pollen levels in a rural area with sub-desert climate and extreme dryness. Hart et al. (2007) analysed the effect of the six warmest months to the pollen concentrations in Sydney, Australia.
In climatology, several criteria are used to classify extreme events. (1) Rare events:
they occur with relatively low frequencies. For example, the IPCC (2001) defines an
“extreme weather event” to be “an event that is rare within its statistical reference distribution at a particular place. Definitions of “rare” vary, but an extreme weather event would normally be as rare as or rarer than the 10th or 90th percentile. (2) Intense events:
they are characterized by relatively small or large values (i.e. events that have large magnitude deviations from the normal). Not all intense events are rare: for example, low precipitation totals are often far from the mean precipitation but can still occur quite frequently. Intensity as defined here should not be confused with the definition of intensity used in the literature to denote the frequency/rate of events (Beniston et al. 2007). (3) Severe events: they result in large socio-economic losses. Severity is a complex criterion because damaging impacts can occur in the absence of a rare or intense climatic event: for example, thawing of mountain permafrost leading to rock falls and mud-slides (Beniston et al. 2007).
As an example, a heat wave event occurs on a day if the air temperature is larger than the normal daily mean plus one or more standard deviations (Baldi et al. 2005). Short- lasting (3 to 6 days) or long-lasting (6 or more consecutive days) heat (cool) waves have been defined when the temperature exceeds the 90th percentile (is below the 10th percentile) on the given days (Tank and Konnen 2003).
However, due to the recent climate change, the variability of temperature and precipitation increase (Tank and Konnen 2003) and extreme weather events (e.g. cold or hot days, as well as droughts or rainy periods) can be persistent; they can last several weeks and even they can be repeated several times. Global warming may facilitate to extend habitats of certain herbaceous and arboreal plants contributing to the increase of pollen levels and exacerbation of their adverse effects, hence to the rise of pollen sensitivity and respiratory admissions due to a pollen allergy (D'Amato and Cecchi 2008, Ariano et al.
2010, Ziska et al. 2011). Thus, the analysis of the effects of long-lasting extreme weather events on the daily or annual pollen concentrations is of ever increasing importance.
The purpose of this paper is to analyse the associations between pollen characteristics and meteorological variables, furthermore between the rank of ordered pollen characteristics and the rank of ordered annual values of meteorological variables for Szeged in Southern Hungary. Based on these results, a potential change in the pollen amount is concluded due to global warming.
2. MATERIALS
Szeged (46.25°N; 20.10°E), the largest settlement in Southern Hungary is located at the confluence of the rivers Tisza and Maros. The area is characterised by an extensive flat landscape of the Great Hungarian Plain with an elevation of 79 m AMSL. The city is the centre of the Szeged region with 203,000 inhabitants. The climate of Szeged belongs to Köppen’s Ca type (warm temperate climate) with relatively mild and short winters and hot
summers (Köppen 1931). The pollen content of the air was measured using a 7-day recording “Hirst-type” volumetric trap (Hirst 1952). The air sampler is located on top of the building of the Faculty of Arts at the University of Szeged some 20 m above the ground surface (Makra et al. 2008).
Meteorological data were collected in the meteorological monitoring station (operated by the Environmental and Natural Protection and Water Conservancy Inspectorate of the Lower-Tisza Region, Szeged) located in the downtown of Szeged at a distance of about 10 m from the busiest main road.
In order to determine the association between extreme high and low temperatures and precipitation totals on one hand and pollen counts of the two taxa selected on the other, daily values of two meteorological variables (mean temperature and precipitation total) and daily pollen concentrations of Ambrosia (ragweed) and Populus (poplar) were considered.
Selection of the above two taxa is justified by their high and medium allergenicity [in a four-score scale (www.pollenindex.hu); the allergenicity of Ambrosia is the highest indicated by score 4, while that of Populus is medium indicated by score 2] and their more or less permanently high pollen concentrations. They belong to the two highest pollen levels of all taxa measured for the period examined, namely Ambrosia (32.3%) and Populus (9.6%) together account for 41.9% of the total pollen production. (Annual pollen production of Poaceae (10.5%) is the 2nd highest of all taxa considered in Szeged area.)
Ambrosia genus has only one species, namely Ambrosia artemisiifolia (Common Ragweed) in the Szeged region. This appears both in the urban environment and in the countryside. Ragweed occurs especially frequently west of the city. The ruling north- western winds can easily transport pollen into the city. Since in the sandy region, northwest of Szeged, stubble stripping is not necessary for ground-clearance due to the mechanical properties of sandy soils, Ambrosia can spread unchecked. Owing to newly-built motorways around Szeged, several farmland areas have been left untouched for a long time that also favour the expansion of Ambrosia. For the Populus genus, natural species of Populus alba (White Poplar) and Populus canescens (Grey Poplar), as well as cultivated poplars such as I-273 Poplar and Populus x euroamericana (Canadian Poplar) and its variants are the most frequent in the city.
The analysis was performed for the 14-year period 1997-2010. The pollen season is defined by its start and end dates. For the start (end) of the season we used the first (last) date on which 1 pollen grain m-3 of air is recorded and at least 5 consecutive (preceding) days also show 1 or more pollen grains m-3 (Galán et al. 2001). Evidently, the pollen season for both pollen types varies from year to year.
3. RESULTS
The periods examined for the two taxa are indicated by the days of the year, namely:
for Ambrosia days 132-280 and for Populus days 35-113. The end of these periods was selected according to the average end date of the pollination seasons. Starting day (132, 62 and 35) was identical with the starting date for calculating cumulated daily mean temperatures used as a predictor for the estimation of the start of the pollen season. Such a date is chosen as to minimise the mean squared error of estimated pollen season starts (Laaidi et al. 2003).
Daily mean temperatures and daily precipitation amounts were cumulated over these above mentioned periods for every year separately corresponding to the two taxa. These quantities were then related to annual pollen characteristics. Additionally, the annual course of both daily mean temperature and daily precipitation amount was described by fitting sine and cosine waves of one year and one half year periods to the entire 14-year data set. The one half year period was used to reproduce the asymmetry of the annual cycle. The mean squared deviation (MSD) between actual daily mean temperatures/precipitation amounts and the annual course was calculated for each year for the periods according to the two taxa. MSD values were then ordered from the highest to lowest values. These ranks of years were related to ranks of ordered annual pollen characteristics.
Correlations between the rank of pollen characteristics and the rank of years based on temperature and precipitation were calculated for both taxa. In a first approach, correlations were determined for every year, and then they were computed for the three warmest and coldest as well as for the three wettest and driest years (extreme years), respectively (Table 1). As the number of data for calculating correlations is very small (14 or just 6) the interval for accepting the null-hypothesis of correlation zero was determined as follows. N values of meteorological variables (cumulated temperature, cumulated precipitation, ranks of MSDs) corresponding to the N years were reordered while keeping the pollen characteristics. Correlation between these two new data sets was then calculated.
Reordering and computation of the correlation were done in every possible case except for the original non-reordered case. Having (N!-1) number of correlations, the interval to be found is (qε, q1–ε), where qε is the ε-quantile of these correlations.
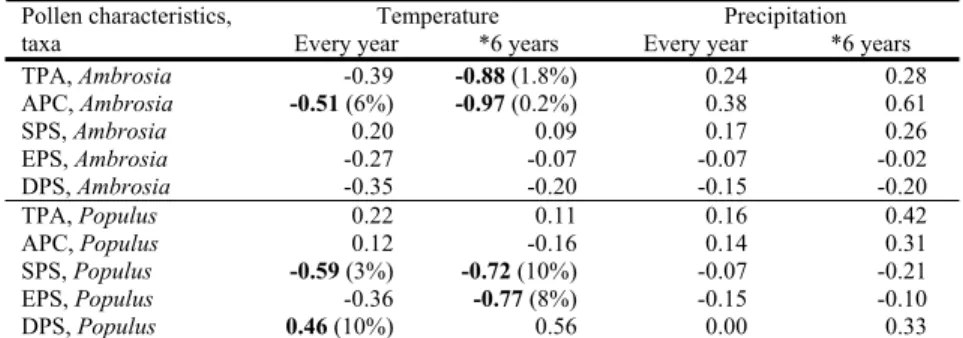
Table 1 Correlations between the rank of pollen characteristics and the rank of years based on temperature and precipitation. TPA: Total Pollen Amount during the pollination season,
APC: Annual Peak Concentration, SPS: Start of the Pollination Season,
EPS: End of the Pollination Season, DPS: Duration of the Pollination Season. Significance levels for correlations being non-zero are shown in parentheses for levels no higher than 10%.
Temperature Precipitation Pollen characteristics,
taxa Every year *6 years Every year *6 years
TPA, Ambrosia -0.39 -0.88 (1.8%) 0.24 0.28
APC, Ambrosia -0.51 (6%) -0.97 (0.2%) 0.38 0.61
SPS, Ambrosia 0.20 0.09 0.17 0.26
EPS, Ambrosia -0.27 -0.07 -0.07 -0.02
DPS, Ambrosia -0.35 -0.20 -0.15 -0.20
TPA, Populus 0.22 0.11 0.16 0.42
APC, Populus 0.12 -0.16 0.14 0.31
SPS, Populus -0.59 (3%) -0.72 (10%) -0.07 -0.21
EPS, Populus -0.36 -0.77 (8%) -0.15 -0.10
DPS, Populus 0.46 (10%) 0.56 0.00 0.33
*6 years: the three warmest / coldest and the three wettest / driest years, respectively
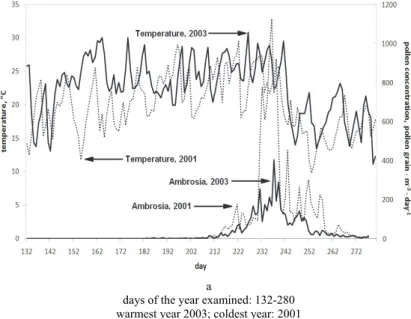
For Ambrosia, only temperature related correlations are relevant. When considering every year, the rank of annual peak concentrations (APC) is inversely proportional to the rank of the annual temperature data. While, for the extreme years, the ranks of both the total pollen amount (TPA) and the APC are negatively associated with the rank of the annual temperature data. In more detail, in the warmest year, TPA was the 2nd smallest and APC the 3rd smallest. In the coldest year, TPA was the 2nd highest and the APC was the 3rd highest (Table 1, Fig. 1).
a
days of the year examined: 132-280 warmest year 2003; coldest year: 2001
b
days of the year examined: 132-280 wettest year: 2001, driest year: 2000
Fig. 1 Daily pollen concentrations of Ambrosia, in years with extreme temperature and precipitation For Populus, only temperature-related substantial correlations have been detected.
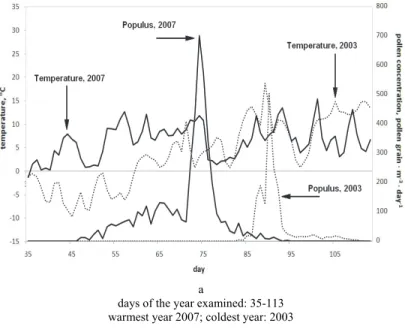
When considering every year, ranks for both the start of the pollination season (SPS) and the duration of the pollination season (DPS) are associated with the rank of the annual temperature data. Taking into account only the extreme years, the ranks of both the SPS and the end of the pollination season (EPS) are inversely proportional to the rank of the annual temperature data. In more detail, in the warmest year the DPS was the 3rd longest, while in
the coldest year it was the 5th shortest. In the coldest year the SPS was the 2nd latest, while in the warmest year it was the earliest (Table 1, Fig. 2).
Correlations between the pollen characteristics and the cumulated daily values of meteorological variables (temperature and precipitation) are summarised in Table 2. For Ambrosia, only temperature-related associations are important. Similarly to the ranks when considering every year, the correlation between the APC and the temperature is inversely proportional. For the extreme years, both the TPA and the APC are in substantial negative connection with temperature (Table 2, Fig. 1). For Populus, precipitation based associations are irrelevant, but for the extreme years, the EPS is in significant negative correlation with temperature (Table 2, Fig. 2).
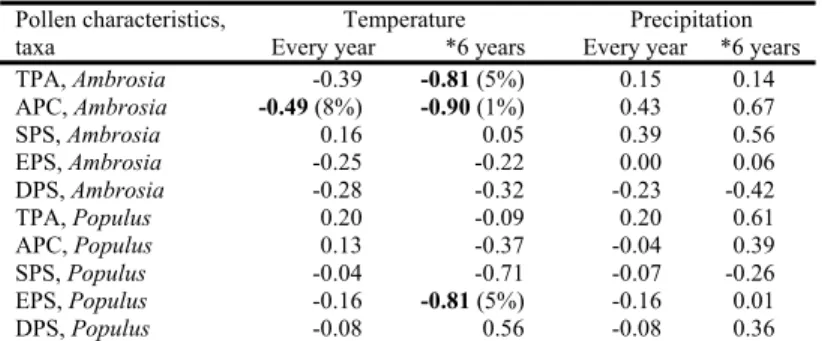
Table 2 Correlations between pollen characteristics and meteorological variables. TPA: Total Pollen Amount during the pollination season, APC: Annual Peak Concentration, SPS: Start of the Pollination
Season, EPS: End of the Pollination Season, DPS: Duration of the Pollination Season. Significance levels for correlations being non-zero are shown in parentheses for levels no higher than 10%.
Temperature Precipitation Pollen characteristics,
taxa Every year *6 years Every year *6 years TPA, Ambrosia -0.39 -0.81 (5%) 0.15 0.14 APC, Ambrosia -0.49 (8%) -0.90 (1%) 0.43 0.67
SPS, Ambrosia 0.16 0.05 0.39 0.56
EPS, Ambrosia -0.25 -0.22 0.00 0.06
DPS, Ambrosia -0.28 -0.32 -0.23 -0.42
TPA, Populus 0.20 -0.09 0.20 0.61
APC, Populus 0.13 -0.37 -0.04 0.39
SPS, Populus -0.04 -0.71 -0.07 -0.26
EPS, Populus -0.16 -0.81 (5%) -0.16 0.01
DPS, Populus -0.08 0.56 -0.08 0.36
*6 years: the three warmest / coldest and the three wettest / driest years, respectively
4. DISCUSSION AND CONCLUSIONS
A moderate warming is favourable for Ambrosia (Ziska et al. 2011). The increase of mean temperature can restrict the ability of the heat tolerant Ambrosia to pollinate, especially in summer time (August), since the plant concentrates on preserving water and maintaining its vegetative life functions rather than generative functions. This is in accordance with the negative association between its pollen count characteristics (TPA and APC) and temperature (Tables 1-2). This genus can adapt well to dry and hot conditions, but is highly influenced by future land use. If more fallows and abandoned human habitats appear in the landscape its further increase can be expected especially on sand soils (Deák 2010) in spite of the expected warming and drying summers in the Carpathian basin (Bartholy et al. 2008).
The plantation of Populus species has not stopped during the last 10 years. Besides locust-tree (Robinia pseudo-acacia), they are the most favoured trees of afforestations in the Szeged region. The stands planted during the last decades have grown up, they are in a mature state, so they can pollinate on a high level. Warmer, moderately humid weather in the spring also favours their pollination. Since Populus has both drought and heat tolerant species from floodplains to bare sand they have high environmental tolerance. Furthermore, they have low climate sensitivity (Deák 2010). However, the discrepancy between their low
climate sensitivity on one hand and a remarkably earlier start (Table 1), later end (Tables 1- 2), as well as longer duration (Table 1) of their pollen season on the other should be justified. A warming and drying climate is more favourable for them in general, facilitating their higher pollen release. Hence, a changing climate (warming and drying) may partly contribute to an extension of the pollen season (Tables 1-2) (Caramiello et al. 1994).
a
days of the year examined: 35-113 warmest year 2007; coldest year: 2003
b
days of the year examined: 35-113 wettest year: 2004, driest year: 1998
Fig. 2 Daily pollen concentrations of Populus, in years with extreme temperature and precipitation
Based on our data set, both taxa are sensitive either to temperature or precipitation.
On the whole, due to a warming and drying climate expected in the Carpathian basin (Bartholy et al. 2008) pollen count characteristics (TPA and APC) indicate a decrease for Ambrosia, while for Populus an increase is expected. Concerning Ambrosia, the effect of its area increase, due to change in land use, on its pollen release is smaller than the effect of its heat stress in hot summers restricting its ability to pollinate. As a result, global warming may involve a decrease in the pollen count characteristics of Ambrosia.
Acknowledgements: The authors would like to thank Miklós Juhász for providing pollen data of Szeged. The European Union and the European Social Fund provided financial support for the project under the grant agreement nos. TAMOP 4.2.1/B-09/1/KMR-2010-0003, TAMOP-4.2.1/B-09/1/KONV-2010-0005 and TAMOP- 4.2.2/B-10/1-2010-0012).
REFERENCES
Ariano R, Canonica GW, Passalacqua G (2010) Possible role of climate changes in variations in pollen seasons and allergic sensitizations during 27 years. Ann Allerg Asthma Im 104:215-222
Aznarte JL, Sánchez JMB, Lugilde DN, Fernández CDL, de la Guardia CD, Sánchez FA (2007) Forecasting airborne pollen concentration time series with neural and neuro-fuzzy models. Expert Syst Appl 32:1218-1225
Baldi M, Pasqui M, Cesarone F, De Chiara G (2005) Heat waves in the Mediterranean Region: Analysis and model results. Proc Am Met Society 16th Symposium on Global Change & Climate Variations, J10.5, San Diego, CA, http://ams.confex.com/ams/pdfpapers/85262.pdf
Bartholy J, Pongrácz R, Torma Cs, Pieczka I, Kardos P, Hunyadi A (2008) Analysis of regional climate change modeling experiments for the Carpathian basin. Int J Global Warming 1:238-252
Bartková-Ščevková J (2003) The influence of temperature, relative humidity and rainfall on the occurrence of pollen allergens (Betula, Poaceae, Ambrosia artemisiifolia) in the atmosphere of Bratislava (Slovakia).
Int J Biometeorol 48:1-5
Beniston M, Stephenson DB, Christensen OB, Ferro CAT, Frei C, Goyette S, Halsnaes K, Holt T, Jylha K, Koffi B, Palutikof J, Schoell R, Semmler T, Woth K (2007) Future extreme events in European climate: an exploration of regional climate model projections. Climatic Change 81:71-95
Caramiello R, Siniscalco C, Mercalli L, Potenza A (1994) The relationship between airborne pollen grains and unusual weather conditions in Turin (Italy) in 1989, 1990 and 1991. Grana 33:327-332
Cariňanos P, Galán C, Alcázar P, Domínguez E (2000) Allergenic pollen in the subdesert areas of the Iberian peninsula. J Invest Allerg Clin 10:242-247
D'Amato G, Cecchi L (2008) Effects of climate change on environmental factors in respiratory allergic diseases.
Clin Exp Allergy 38:1264-1274
Deák JÁ (2010) Csongrád megye kistájainak élőhelymintázata és tájökológiai szempontú értékelése. [Habitat- pattern and landscape ecological evaluation of the micro-regions of Csongrád county. (in Hungarian)]
PhD thesis. University of Szeged, Hungary
Frei T (2004) Frequency of extreme events with airborne pollen. Allergologie 27:1-10 Frei T (2006) Extreme events concerning airborne pollen. Allergologie 29:349-353
Galán C, Cariňanos P, García-Mozo H, Alcázar P, Domínguez-Vilches E (2001) Model for forecasting Olea europaea L. airborne pollen in south-west Andalusia, Spain. Int J Biometeorol 45:59-63
García-Mozo H, Galán C, Belmonte J, Bermejo D, Candau P, de la Guardia CD, Elvira B, Gutiérrez M, Jato V, Silva I, Trigo MM, Valencia R, Chuine I (2009) Predicting the start and peak dates of the Poaceae pollen season in Spain using process-based models. Agr Forest Meteorol 149:256-262
Gehrig R (2006) The influence of the hot and dry summer 2003 on the pollen season in Switzerland. Aerobiologia 22:27-34
Hart MA, de Dear R, Beggs PJ (2007) A synoptic climatology of pollen concentrations during the six warmest months in Sydney, Australia. Int J Biometeorol 51:209-220
Hirst JM (1952) An automatic volumetric spore trap. Ann Appl Biol 39:257-265
IPCC (2001) Climate change 2001: the scientific basis. Cambridge University Press, Cambridge
Kasprzyk I (2008) Non-native Ambrosia pollen in the atmosphere of Rzeszow (SE Poland); evaluation of the effect of weather conditions on daily concentrations and starting dates of the pollen season. Int J Biometeorol 52:341-351
Köppen W (1931) Grundriss Der Klimakunde. Walter De Gruyter & Co., Berlin (in German)
Laaidi M, Thibaudon M, Besancenot JP (2003) Two statistical approaches to forecasting the start and duration of the pollen season of Ambrosia in the area of Lyon (France). Int J Biometeorol 48:65-73
Makra L, Tombácz S, Bálint B, Sümeghy Z, Sánta T, Hirsch T (2008) Influences of meteorological parameters and biological and chemical air pollutants to the incidence of asthma and rhinitis. Climate Res 37:99- 119
Recio M, Docampo S, García-Sánchez J, Trigo MM, Melgar M, Cabezudo B (2010) Influence of temperature, rainfall and wind trends on grass pollination in Malaga (western Mediterranean coast). Agr Forest Meteorol 150:931-940
Rodríguez-Rajo FJ, Jato V, Aira MJ (2005) Relationship between meteorology and Castanea airborne pollen. Belg J Bot 138:129-140
Štefanič E, Kovačevič V, Lazanin Ž (2005) Airborne ragweed pollen concentration in north-eastern Croatia and its relationship with meteorological parameters. Ann Agr Environ Med 12:75-79
Tank AMGK, Konnen GP (2003) Trends in indices of daily temperature and precipitation extremes in Europe, 1946-99. J Climate 16:3665-3680
Ziska L, Knowlton K, Rogers C, Dalan D, Tierney N, Elder MA, Filley W, Shropshire J, Ford LB, Hedberg C, Fleetwood P, Hovanky KT, Kavanaugh T, Fulford G, Vrtis RF, Patz JA, Portnoy J, Coates F, Bielory L, Frenz D (2011) Recent warming by latitude associated with increased length of ragweed pollen season in central North America. P Natl Acad Sci USA 108:4248-4251
www.pollenindex.hu