Introduction
Climate change can trigger harmful effects in urban areas as well (László, E. et al. 2016), however, the most dangerous changes are predicted for agricultural areas. A well-de- veloped soil can take and keep even 200–300 mm precipitation at one time depending on its land-use, porosity, aggregation and can- opy cover. However, soils especially those
of crop fields and vineyards are highly de- graded; therefore, water infiltration is inhib- ited (Jakab, G. et al. 2017; Rodrigo-Comino, J. 2019). Moreover, since the beginning of the last century, extreme rainfalls occurred more frequently in all over Europe, as a con- sequence of climate change (Fowler, H.J.
and Kilsby, C.G. 2003; Müller, M. et al. 2009;
Milosevic, D. and Savic, S. 2013; Lakatos, M. and Hoffmann, L. 2018).
1 Geographical Institute, Research Centre for Astronomy and Earth Sciences, Hungarian Academy of Sciences, Bu- dapest, Hungary. E-mails: jakab.gergely@csfk.mta.hu, szalai.zoltan@csfk.mta.hu, madarasz.balazs@csfk.mta.hu
2 Institute of Geography and Geoinformatics, University of Miskolc, Miskolc, Hungary.
3 Faculty of Water Sciences, Institute of Hydraulic Engineering and Water Management, National University of Public Service, Baja, Hungary. E-mail: biro.tibor@uni-nke.hu
4 Department of Physical Geography and Geoinformatics, Faculty of Science and Technology, University of Debrecen, Debrecen, Hungary. E-mail: szabo.szilard@science.unideb.hu
5 Department of Remote Sensing and Geographic Information Systems (RS-GIS), Asian Institute of Technology, Bangkok, Thailand. E-mail: sarawutn@ait.ac.th
6 Department of Environmentaland Landscape Geography, ELTEUniversity, Budapest, Hungary.
Spatial analysis of changes and anomalies of intense rainfalls in Hungary
Gergely JAKAB1,2,6, Tibor BÍRÓ3, Zoltán KOVÁCS4, Ádám PAPP4, Ninsawat SARAWUT5, Zoltán SZALAI1,6, Balázs MADARÁSZ1 and Szilárd SZABÓ4
Abstract
Extreme precipitation events can trigger flash flood, mass movements, pluvial flood and accelerated soil erosion.
As soil structures are highly degraded due to intensive improper cultivation water infiltration can consider- ably decrease during the vegetation period. Additional changes in canopy coverage on the soil surface cause relevant variability in infiltration and hence vulnerability against runoff related disasters. Most researchers agree that the frequency of extreme precipitations increases, however, in the Carpathian Basin the uncertain- ties are quite high. This study aims to compare daily maximum mean precipitation amounts (MMPA) predicted by the Goda-method for June and August as the most probable months of extremities. We used the CarpatClim database as input and predicted MMPAs for two periods, 1960–1985 and 1986–2010. The Goda-method uses monthly data and calculates daily results on given probability. A general increase was found between the first and second half of the period regarding daily maximum precipitation amount in both investigated months.
For August the 1-day precipitation amount increased from 56.1 mm to 61.8 mm, whereas 6-days amount from 93.8 mm to 103.2 mm at 1 per cent probability (r = 0.53; p < 0.001). Beyond this change, relevant spatial differences were found. Comparing the macro regions plains had lower increase compared to the mountains, whereas the highest increase was in the Transdanubian Hills (TH). The most endangered location is the southern part of the Transdanubian Hills where parallel with the intensive increase in MMPA both in June and August the environmental conditions such as loose parent material and the high percentage of crop fields also emphasize the potential hazard.
Keywords: extreme precipitation, climate change, soil erosion, flash flood, pluvial flood
Parallel with the increasing frequency of extreme precipitation events, rainfall occur- rence is getting more erratic (Bartholy, J. and Pongrácz, R. 2007; Mika, J. and Farkas, A.
2017; Milosevic, D. et al. 2017). An increas- ing ratio of annual precipitation will not be able to infiltrate, triggering water deficiency during the growing season in a mesic envi- ronment (Knapp, A.K. et al. 2008). The water remaining on the soil surface causes runoff and flash flood on the hillslopes (Czigány, Sz.
et al. 2010), and pluvial floods on lowlands.
Both phenomena have primary importance in soil degradation in Hungary as 49 per cent of the territory is arable field and 35 per cent of that is already eroded (Kertész, Á. and Centeri, Cs. 2006). Pluvial floods including melting snow and intense rains frequently cover considerable parts of the plains in spring (Van Leeuwen, B. et al. 2013; Pásztor, L. et al.
2015; Balázs, B. et. al. 2018). Summer rainfall events lead to pluvial floods as well for several days in high quantity. To avoid or minimal- ize damages, actual water infiltration should be increased by tillage and plant coverage. As soil infiltration capacity varies in a wide range both in time and in space, agricultural technol- ogy should adapt to it in order to fight against runoff and pluvial floods (Jakab, G. et al. 2017).
The ability of a precipitation event to de- stroy the soil surface and to generate run- off is called erosivity, which is proportional with the amount and intensity of the storm (Waltner, I. et al. 2018). Rainfall erosivi- ty (R factor) is generally calculated from these two properties according to the USLE (Wischmeier, W.H. and Smith, D.D. 1978) or the RUSLE (Renard, K.G. and Freimund, J.R.
1994) model. Traditionally, R factor values are determined for a whole calendar year in order to estimate the erosion potential of the precipitation (Panagos, P. et al. 2015).
Conversely, long-term erosion monitoring has proven that the main part of soil loss is triggered by only one or two extreme pre- cipitation events those also take the main part of the R factor. Since soil porosity and canopy cover varies in a wide range during the vegetation period the actual runoff and
soil loss volume is the function of the date of a given heavy rainstorm. Hence annual R factor needs to be divided into shorter tem- poral sections such as months (Ballabio, C.
et al. 2017), single precipitation events or even hours (Kendon, E. et al. 2014).
As the occurrence of extreme precipitation events varies in a wide range both in time and space their proper forecast is still an unsolved question (Maheras, P. et al. 2018) hence the Carpathian Basin is presumed to be the most questionable area in Europe regarding future trends (Kristóf, E. et al. 2017; Gelybó, Gy.
et al. 2018; László, E. and Salavec, P. 2018), but scientists agree that the number of intense precipitation events is expected to increase (Bartholy, J. and Pongrácz, R. 2007; Cheval, S. et al. 2016), the return time of extreme events increases by 1.2–2 times (Piecka, I. et al. 2011;
Pongrácz, R. et al. 2014). Although there is a long-term precipitation database for whole Europe, locally low spatial resolution and/or the lack of (high resolution) rainfall intensity data cause difficulties in extreme precipita- tion prognostication (Zhang, F. et al. 2006).
Consequently, models were developed to es- timate heavy storm frequency at local scales.
Some of these models need detailed mea- sured input and calibration such as ALADIN/
AROME (Ihász, I. et al. 2018), whereas simpler models use only long-term monthly (Renard, K.G. and Freimund, J.R. 1994) or daily (Goda, L. 1966) precipitation volume data. The Goda- method uses long-term observations, monthly data, but the output is the daily maximum by months at a given probability level; thus, it has the advantage to describe erosivity or the tendency for pluvial floods in a simple way.
Rapid and heavy rainstorms have direct connections with erosion and could be rep- resented as 1-day maximums. Rainfall maxi- mums (the longest statistically evaluable term is 6 days in Hungary according to Goda, L.
1966) refer to pluvial flood formation in the plains caused by the low infiltration capacity and the intense rains where the runoff is lim- ited because of the flat surface. In Hungary, precipitation maximums are in June (1–6 days maximums) and August when mainly extreme
1-day rainfalls occur, hence these months are presumed to have the most important role in soil erosion and partly in pluvial flood forma- tion (Szűcs, P. et al. 2006; Jakab, G. et al. 2015).
The aim of the present study is to quantify changes in maximum daily precipitation vol- umes at the time of the annual precipitation peaks (in June and August) in Hungary. Our hypotheses to be tested are i.) maximum dai- ly precipitation maximums are in strong cor- relation with elevation; ii) the maximum daily precipitation volume has increased since 1960 in Hungary; iii.) the spatial distribution of the average change has a high standard deviation;
iv.) there are significant differences among the macro regions regarding the mean maximum precipitation amount (MMPA) changes.
Methods Datasets
We used the precipitation data of the Car- patClim (CC) database (Szalai, S. et al. 2013;
Spinoni, J. et al. 2015). CC is a climatic data- set which is the result of the contribution of nine countries. We filtered out the Hungarian data points, however, the database did not
cover the westernmost part of the country.
The dataset is a homogenized time series of 50 years from 1960 to 2010 with the Multi- ple Analysis of Series for Homogenization (MASH) method, based on measured data but the final product is an interpolated 10 km x 10 km grid network with the Meteor- ological Interpolation based on the Surface Homogenized Data Basis (MISH) meth- od (Szentimrey, T. and Bihari, Z. 2007;
Szentimrey, T. 2011; Szentimrey, T. et al. 2012).
Calculation of intense rainfalls
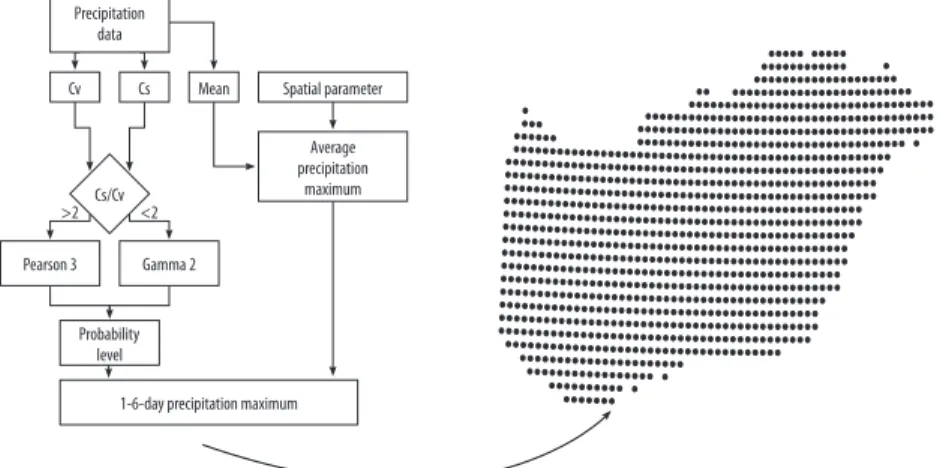
We applied the method of Goda, L. (1966) to determine the intensive rainfalls. The meth- od uses monthly data and calculates daily results on a given probability. Firstly, we had to determine whether the time series follows a Pearson-3 or Gamma-2 distribution, and then, by applying the univariate statistics, the constants of the chosen distributions and probability level, and the spatially pre- defined parameter of the region and apply- ing the appropriate function, we get the final result regarding 1 and 6 days (Figure 1). The process of the workflow is described after Goda, L. (1966).
Fig. 1. Workflow of data management. – Cv = coefficient of variation; Cs = coefficient of asymmetry. Pearson 3 and Gamma 2 are distribution types.
Firstly, we determine the mean (x) and standard deviation (σ) of the time series, then the next is the calculation of the coefficient of variation (cv, Eq. 1) and asymmetry (cs, Eq. 2).
where cv is the coefficient of variation, σ is the standard deviation, x is the mean of the time series.
where cs is the coefficient of asymmetry, ki is the ratio of xi and x, xi is the ith element, cv is the coefficient of variation of the time series.
If then the time series follows a Pearson III. (Foster-Ribkin variation) distribution, and if the distribution can be described with the Gamma II. (Krickij-Menkelj variation) dis- tribution.
Goda, L. (1966) provided a formula for the T = 1–6 days mean precipitation maximums (Eq. 3):
where is the mean precipitation maxi- mum of 1 day, for see Eq. 5; the general formula for T = 1–6 days is (Eq. 4):
where is the mean of T = i days-long pre- cipitation maximums, is the spatial factor with the following formula (Eq. 5):
where is a factor describing the means of i-days-long (T = 1–6) precipitation maximums, is the change for the precipitation maxi- mum as a function of the number of days.
The final step is the calculation of the pre- cipitation maximums on a given probability level. If the cs/cv is larger than 2 we use the Φ-value from the Foster-Ribkin table, if it is smaller, we use the K-value from the Krickij- Menkelj table with the formulas of Eq. 6 and 7:
where is the mean precipitation maximum on a given probability level, Φ can be deter- mined from the Foster-Ribkin table using the cs and probability (e.g. 1% or 5%) values.
where is the mean precipitation maxi- mum on a given probability level, K can be determined from the Krickij-Menkelj table using the cv and probability (e.g. 1% or 5%).
The procedure was implemented in R 3.5.1 (R Core Team, 2017) environment with the ti- dyr (Wickham, H. and Henry, L. 2018) pack- age, and the calculations were completely automated.
Statistical analysis
We divided the 50-year dataset into two peri- ods: 1960–1985 and 1986-2010; thus, we were able to identify whether there is a trend in this time range considering the maximums of the intense rainfalls. Even though, Mika, J. and Farkas, A. (2017) have pointed out, that many weather extremities have already occurred in the 1960s.
From various possible outcomes, we choose the following combinations: 1- and 6-day maximums with 1 per cent and 5 per cent probability regarding June and August.
We checked the variables for normal distri- bution with the Shapiro-Wilk test and, as some variables were skewed, we applied the non-parametric Wilcoxon-test to reveal if there was a significant difference between the two time periods.
We also determined the effect sizes for the comparisons, to get a standardized and comparable value of the magnitude of dif- ferences. Effect size ranges from 0 to 1, and 0 means complete similarity and the increase of the value indicates a larger difference: 0.1 denotes weak, 0.3 moderate while 0.5 large difference (Field, A. 2009; Sullivan, G.M.
and Feinn, R. 2012).
(1)
(2)
(3)
(4)
(5)
(6)
(7) ,
,
,
,
,
, ,
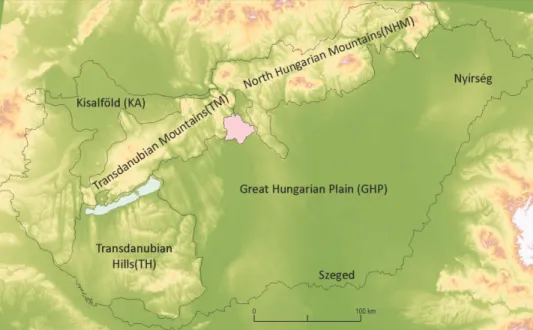
For spatial comparison purposes, we appli- ed the macro regions of Hungary (Dövényi, Z.
2010), even though this classification was land- scape based, resulting units with heterogene- ous climatic conditions (Figure 2).
Comparisons were conducted between each macro region pairs to highlight the spatial differences in MMPA change be- tween the two investigated periods (2 x 25 years). On one hand, macro regions reflect the spatial character of changes (absolute situation), on the other hand, all macro re- gions have different average surface height.
Thus, a hypothesis testing, carried out with the robust ANOVA test, was able to reveal whether these differences were significant and characteristic in a region, or they hap- pened just by chance having a random distri- bution. The results were presented in a visual form on the diagram: where the mean and 95 per cent confidence intervals coincide with the zero value, the difference was not consid- ered to be significant. We conducted correla- tion analysis between elevation and the dif- ferent representations of the intense rainfalls,
using Spearman rank correlation. Terrain height was derived from SRTM data at each pixel centre of the CC database. Statistical analyses were conducted with R 3.5.1 (R Core Team, 2018) with the coin (Hothorn, T. et al.
2008) and the walrus (Love, J. and Mair, P.
2017) packages.
Results
Intense rainfall maximum changes on country level
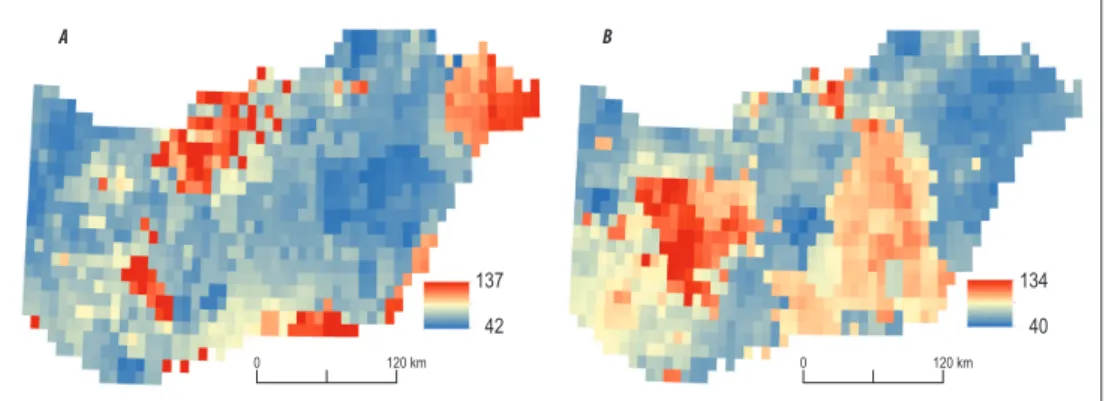
Daily MMPAs during the investigated fifty years changed between 40 and 137 mm depending on time and spatial location (Figure 3). The precipitation range was the same for the whole country in June and August, whereas the maxima were found at four individual locations in June (Figure 3, a) and in central Transdanubia in August (Figure 3, b). The less extreme daily rainfall amounts were in Kisalföld and in North Hungary.
Fig. 2. Macro regions and other spatial units appearing in the study
Correlation analysis revealed that the 1- and 6-days as well as the 1 per cent and 5 per cent probability intense rainfall maximums were strongly correlated, but the correla- tion between June and August was weak.
Accordingly, we focused on the monthly dif- ferences, but also analysed the 6-day events because of the higher values.
Based on 50-year data a general increase was found between the first and second half of the period regarding daily maximum precipitation amount in both investigated months. However, the difference was not significant in any case in June on a country level (Table 1).
Taking a more detailed spatial resolution into account it is clear that locally significant differences were found in 6-days’ MMPA in June (Figure 4). In central Hungary, the 6-day
MMPA decreases, whereas the highest decrease was in the TH. The increase is located in the western part of the country, in the Northern part of GHP and in the South near Szeged.
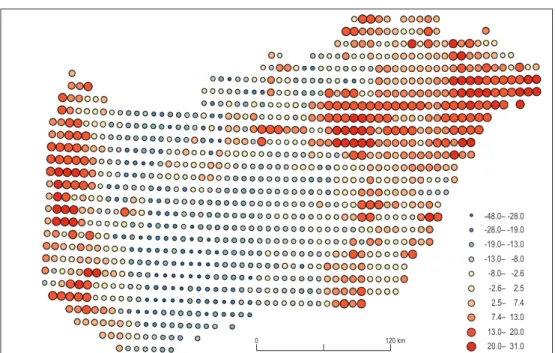
Conversely, in August the increase is clear and significant concerning both duration and prob- ability. Beyond this general trend again explicit spatial differences exist (Figure 5).
On the major part of the country the ex- tremity decreased, in the central part of the GHP and in Transdanubia the average dropped more than 20 mm. In contrast, in the southern part of Transdanubia, the rain- fall amount increased more than 10 mm, which corresponded to a 5–25 per cent rise (compare to Figure 3, b). Therefore, it is not enough to compare the country means, for the identification of the most endangered lo- cations a higher spatial resolution is needed.
Fig. 3. Spatial distribution of daily MMPAs in June (a) and August (b) derived from the CC using the Goda-method
Table 1. Mean and standard variation of the intense rainfall data (mm) by the number of rainy days, months and probabilities in the studied periods
Variation Day Month 1960–1985 1986–2010 p* Effect size (r)
Mean ± SD 1%
11 66
JuneAugust June August
56.5 ± 6.7 56.1 ± 10.6 99.1 ± 10.4 93.8 ± 16.9
57.6 ± 9.1 61.8 ± 10.1 100.9 ± 13.6 103.2 ± 15.7
<0.001
<0.001
<0.001
<0.001
0.130.53 0.120.53
Mean ± SD 5%
11 66
JuneAugust June August
46.5 ± 5.2 45.1 ± 8.4 81.6 ± 7.7 75.5 ± 13.5
46.8 ± 7.1 49.0 ± 7.6 81.9 ± 10.6 81.9 ± 11.8
<0.0010.33
<0.0010.52
0.030.52 0.020.52
*p = significance of the pairwise comparison with the Wilcoxon test; italics highlights = p < 0.01.
Fig. 4. Change in average 6-days MMPA in June. Differences between averages of 1960–1985 and 1986–2010 in mm at 1 per cent probability level.
Fig. 5. Change in MMPA in August. Differences between averages of 1960–1985 and 1986–2010 in mm at 1 per cent probability level.
Areal comparison of differences of intense rainfall maximums by macro-regions
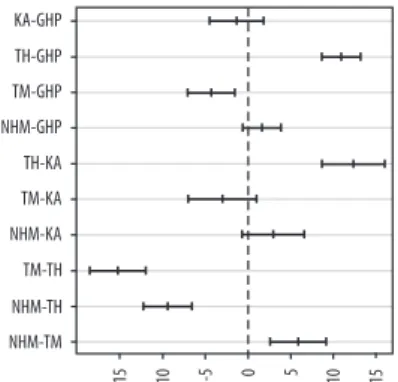
In June, regarding the 1-day MMPA, the increase in TH was a significantly higher increase than in the other macro region ex- cept TM, which was a neighbouring region.
In contrast, the increase was significantly lower in KA than in the other macro region except GHP (Figure 6, above). Thus, the high- est difference was found between TH and KA (~ 8 mm), which was more than 13 per cent of the KA value (~ 60 mm). As the calcula- tion is derived from the same database the
differences between 6-days long MMPA showed the same pattern with higher values (Figure 6, below).
In August, the largest difference was higher (~15 mm) in the 1-day MMPA case, which was almost 25 per cent difference compared to the KA basis value of KA. This difference was found between TM and TH. Moreover, TH had a sig- nificantly higher increase than any other macro region, whereas TM had a lower increase than any other macro regions, even though the differ- ence between TM and KA was not significant.
Correlation analysis revealed significant correlations between elevation and different
Fig. 6. Mean differences (mm) of 1-day and 6-day MMPA at 1 % probability level in June and August by macro- regions (95% confidence intervals coinciding with 0 are not significant differences, p > 0.05). GHP = Great Hungarian Plain; KA = Kisalföld (Little Plain); TH = Transdanubian Hills; TM = Transdanubian Mountains;
NHM = North Hungarian Mountains.
intense rainfall measures (Figure 7). The best correlations were found in the case of August regardless of the probability level (1% or 5%);
nevertheless, the largest value belonged to a 1 per cent representation (but it was only 0.03 larger than the next one which was a 5%
representation).
Generally, correlations were > 0.5 in the case of the period of 1960–1985 for 6-day events of Augusts, but for 1-day events in June for the same period, r values were below 0.3. For the period of 1986–2010, correlations ranged between 0.32–0.46, and the largest value belonged to the 6-day events in August on 5 per cent probability. However, we did not detect relevant correlation considering the changes between the intense rainfalls and elevation regarding daily MMPA in June.
Discussion
Reasons for spatial differences
The increase of MMPA is in line with the mainstream measurement and model re- sults (Bartholy, J. and Pongrátz, R. 2007),
although, Pirkhoffer, E. et al. (2009) did not find an increase in the annual number of extreme precipitation events regarding Sze- ged and Budapest, except Debrecen in the 1901–2000 temporal range. Pirkhoffer, E.
et al. (2009) performed an analysis based on the annual dataset, thus, their findings can be different from our outcomes relating June and August. Our results are calculated from monthly data and this can be the explanation for the differences, too. They found that the majority of years had lower frequency of ex- treme events than the average. These longer periods were interrupted by short periods with a high number of extreme events.
In the countywide context, daily precipi- tation maximums in June showed hotspots.
As the main wind direction is NW to SE the maximums are concentrated in the NW foothills of the Börzsöny Mountains and of the Western Carpathians, even though ad- ditional maxima appear in central TH and in the vicinity of Szeged. Conversely, in August, this trend is obscured probably by the occur- rence of convective precipitation events in the centre of GHP. This theory is supported by the results of Kendon, E. et al. (2014) who concluded the highlighted role of convective precipitations in model efficiency in the sum- mer. This is also in line with the results of Mezősi, G. et al. (2013), who modelled the highest increase in precipitation extremities on the GHP. In contrast, the correlation be- tween MMPA and topography was strong in August and weak in June for the 1960–1985 period for the whole country.
Turning to the period 1986–2010 moderate to weak correlations were found without any structure in months or period length. This could partly be the result of spatial resolu- tion, county borders are not identical with topographic elements. The general tendency is that most trends disappear due to the in- creasing extremities (Gelybó, Gy. et al. 2018).
As a consequence of this, certain phenomena e.g. the occurrence of convective precipita- tion events would be less typical for one par- ticular time period or location and diversity is expected to increase.
Fig. 7. Spearman correlation coefficients between ele- vation and different maximum precipitation amounts.
M06 = June; M08 = August; p01 = 1%, p05 = 5% prob- ability. Periods: 1960–1985 (red); 1986–2010 (blue)
Risky and neutral areas of changes in intense rainfalls
Most differences in MMPA changes between the macro regions were significant in June and August pointing to regional variations of heavy rainfalls. Regarding the 6-days long MMPA in June the lowest increase was de- tected on the GHP. The maximum increase was in Nyírség. Since Nyírség already had the highest values (100 mm <) the most ex- treme 6-days precipitation conditions are presumed to appear here. However, in the Nyírség, the ratio of forest land cover is high (Négyesi, G. et al. 2015; Négyesi, G. 2018) and the soil texture is sandy (Pásztor, L. et al.
2016a,b), the probability of pluvial flood oc- currence remains still low. As in this region the most dangerous soil degrading factor is wind erosion, an increasing soil mois- ture content in early summer could provide defense against deflation (Négyesi, G. et al.
2016; Pásztor, L. et al. 2016c). In contrast, at the vicinity of Szeged the highest increase, parallel with the highest precipitation vol- umes, triggers increasing pluvial flood risk as a result of loamy soil texture and of the highly degraded structure of the soils due to inten- sive agricultural cultivation (Van Leeuwen, B.
et al. 2013). The largest change in the northern part of GHP (approx. + 30 mm) increased the original amount of ~ 65 mm leading only to moderate hazard.
Concerning the western part of the coun- try and especially the southern part of the Transdanubian Hills, these long-term heavy precipitation, particularly after a very wet win- ter and spring, can trigger mass movements.
For instance, landslides, bank failures along the shore of Danube are presumed to be the results of the precipitation pattern and the role of water level fluctuations and geological struc- ture is less important (Újvári, G. et al. 2009).
Increasing precipitation extremity is a poten- tial hazard to river bank stability in southern Hungary. Some parts of the southern TH have the highest increase both in June and August whereas the annual precipitation amount does not change. This underlines the importance of
water storage in the soil. Eekhout, J.P.C. et al.
(2018) presumed a considerable decline in soil water storage capacity due to climate change in Europe. Hence, surface pools are going to have a special role in this region.
In August, daily MMPA increases in south- ern part of the Transdanubian Hills, central Hungary and northern Hungary. Generally, these parts of the country had moderate MMPAs, except the already discussed south- ern part of the TH. In this region, the ratio of crop fields is around 30 per cent. In August, the crop fields after wheat harvest have no canopy cover protection against heavy show- ers and the surface is generally covered by soil crust that minimizes infiltration leading to high runoff volume. Due to the hilly land- scape and the loose parent material (loess) this region (Lóki, J. 2010) would be the hot spot of the country not just from hydrolog- ical aspect, but from the aspect of erosion as well. Moreover, the southern part of the TH was found to be extremely vulnerable to flash flood hazard (Pirkhoffer, E. et al. 2009;
Lóczy, D. et al. 2012), which is in line with our results as flash floods are the direct con- sequences of intense rainfalls.
Conclusions
The Goda-method applied on the CC data- base was found an effective tool for MMPAs for the temporal comparison. The next step has to be the validation of the predictions using local scale measured or country scale modelled data. The approach ensured us to reveal temporal and spatial differences in the changes of the mean maximum precipitation amount. Effect size pointed to the largest dif- ferences, and only the changes in August had large effects considering the differences be- tween 1961–1985 and 1986–2010 both for the 1 and 5 per cent probabilities.
Regarding the spatial pattern of the south- ern part of the Transdanubian Hills, this is pre- sumed to be the most endangered location as a result of the changing hydraulic circumstanc- es. In this region, the probability of flash flood,
soil erosion, and mass movements increases, whereas the environmental conditions such as loose parent material and the high percentage of crop fields also point to potential danger.
Therefore, the protection strategy has to con- centrate on this part of the country. However, more detailed spatial and temporal resolution is needed in order to gain more reliable data at local scale. More frequent flash flood phe- nomena and the increasing erosion require the establishment of a storm monitoring system with high temporal resolution measurements.
This seems to be necessary to track the chang- ing intensity rainfall events and to prepare an adequate conservation strategy.
Acknowledgements: The research was supported by the National Research, Development and Innovation Office (NKFIH 108755).
REFERENCES
Balázs, B., Bíró, T., Dyke, G.J., Singh, S.K. and Szabó, Sz. 2018. Extracting water-related features using reflectance data and principal component analysis of Landsat images. Hydrological Sciences Journal 63.
(2): 269–284. Doi: 10.1080/02626667.2018.1425802 Ballabio, C., Borelli, P., Spinoni, J., Meusburger,
K., Michaelides, S., Begueria, S., Klik, A., Petan, S., Janeček, M., Olsen, P., Aalto, J., Lakatos, M., Rymszewicz, A., Dumitrescu, A., Perčec Tadić, M., Diodato, M., Kostalova, J., Rousseva, S., Banasik, K., Alewell, C. and Panagos, P. 2017. Mapping monthly rainfall erosivity in Europe. Science of the Total Environment 579. 1298–1315.
Bartholy, J. and Pongrácz, R. 2007. Regional analysis of extreme temperature and precipitation indices for the Carpathian Basin from 1946 to 2001. Global and Planetary Change 57. (1–2): 83–95.
Cheval, S., Dumitrescu, A.M. and Birsan, V. 2016.
Variability of the aridity in the South Eastern Europe over 1961–2050. Catena 151. 74–86 Czigány, Sz., Pirkhoffer, E. and Geresdi, I. 2010.
Impact of extreme rainfall and soil moisture on flash flood generation. Időjárás 114. (1–2): 79–100.
Dővényi, Z. (ed.) 2010. Magyarország kistájainak katasztere (Inventory of microregions in Hungary).
Budapest, MTA Földrajztudományi Kutatóintézet.
Eekhout, J.P.C., Hunink, J.E., Terink, W., De Vente, J. and San Diego, C. 2018. Why increased extreme precipitation under climate change negatively affects water security. Hydrology and Earth System Sciences 22. 5935–5946.
Field, A. 2009. Discovering statistics. London, SAGE Publications.
Fowler, H.J. and Kilsby, C.G. 2003. Implications of changes in seasonal and annual extreme rainfall.
Geophysical Research Letters 30. (13): 17–20. Available at https://doi.org/10.1029/2003GL017327
Gelybó, Gy., Tóth, E., Farkas, Cs., Horel, Á., Kása, I.
and Bakacsi, Zs. 2018. Potential impacts of climate change on soil properties. Agrokémia és Talajtan 67.
(1): 121–141.
Goda, L. 1966. Frequency of several days long precipitations.
Tanulmányok és kutatási eredmények 20. Budapest, VITUKI, 6–15. (in Hungarian)
Hothorn, T., Hornik, K., Van de Wiel, M.A. and Zeileis, A. 2008. Implementing a class of permutation tests: The coin package. Journal of Statistical Software 28. (8): 1–23. URL http://www.jstatsoft.org/v28/i08/
Ihász, I., Mátrai, A., Szintai, B., Szűcs, M. and Bonta, I. 2018. Application of European numerical weather prediction models for hydrological purposes. Időjárás 122. (1): 59–79. Doi:10.28974/idojaras.2018.1.5 Jakab, G., Madarász, B., Szabó, J.A., Tóth, A., Zacháry,
D., Szalai, Z., Kertész, Á. and Dyson, J. 2017.
Infiltration and soil loss changes during the growing season under ploughing and conservation tillage.
Sustainability 9. (1726): 1–13. Doi: 10.3390/su9101726 Jakab, G., Szabó, J. and Szalai, Z. 2015. A review on
sheet erosion measurements in Hungary. Journal of Landscape Ecology 13. (1): 89–103.
Kendon, E.J., Roberts, N.M., Fowler, H.J., Roberts, M.J., Chan, S.C. and Senior, C.A. 2014. Heavier summer downpours with climate change revealed by weather forecast resolution model. Natural Climate Change 4. (7): 570–576.
Kertész, Á. and Centeri, Cs. 2006. Hungary. In Soil erosion in Europe. Eds.: Boardman, J. and Poesen, J., Chichester, John Wiley & Sons, 139–153.
Knapp, A.K., Beier, C., Briske, D.D., Classen, A.T., Luo, Y., Reichstein, M., Smith, M.D., Smith, S.D., Bell, J.E., Fay, P.A., Heisler, J.L., Leawitt, S.V., Sherry, R., Smith, B. and Weng, E. 2008. Consequences of more extreme precipitation regimes for terrestrial ecosystems. BioScience 58. (9): 811–821. Available at https://doi.org./10.1641/B580908
Kristóf, E., Pongrácz, R. and Bartholy, J. 2017.
Távkapcsolati rendszerek hatása a Kárpát-medence térségére (Impact of distant connection systems on the surroundings of the Carpathian Basin). In HUNGEO 2017. Bányászat és környezet – harmóniában.
Eds.: Cserny, T. and Alpek, B.L., Budapest, Magyar- honi Földtani Társulat, 75–76.
Lakatos, M. and Hoffmann, L. 2018. Növekvő csapa- dékintenzitás, magasabb mértékadó csapadékok a változó klímában (Increasing precipitation intensity, higher standard precipitations in changing climate).
In Országos Települési Csapadékvíz-gazdálkodási Konferencia Tanulmányai. Ed.: Bíró, T., Budapest, Dialóg Campus Kiadó, 8–16.
László, E. and Salavec, P. 2018. Relationship be- tween weather conditions advantageous for the development of urban heat island and atmospheric macro-circulation changes. International Journal of Climatology 38. 3224–3232.
László, E., Bottyán, Z. and Szegedi, S. 2016. Long- term changes of meteorological conditions of urban heat island development in the region of Debrecen, Hungary. Theoretical and Applied Climatology 124.
(1): 365–373.
Lóczy, D., Czigány, Sz. and Pirkhoffer, E. 2012. Flash flood hazards. In Studies on Water Management Issues.
Ed.: Kumarasamy, M., Rijeka, InTech, 57–72. Doi:
10.5772/28775
Lóki, J. 2010. Agriculture: Crop Cultivation and Horticulture. In Anthropogenic Geomorphology: A Guide to Man-Made Landforms. Eds.: Szabó, J., Dávid, L. and Lóczy, D., Dordrecht–Heidelberg–New York, Springer, 55–71.
Love, J. and Mair, P. 2017. Walrus: Robust Statistical Methods. (R package version 1.0.1.). Available at https://
cran.r-project.org/package=walrus
Maheras, P., Tolika, K., Anagnostopoulou, C., Makra, L., Szpirosz, K. and Károssy, Cs. 2018.
Relationship between mean and extreme pre- cipitation and circulation types over Hungary.
International Journal of Climatology 38. (12): 4518–4532.
Doi: 10.1002/joc.5684
Mezősi, G., Meyer, B.C., Loibl, W., Aubrecht, C., Csorba, P. and Bata, T. 2013. Assessment of regional climate change impacts on Hungarian landscapes.
Regional Environmental Change 13. (4): 797–811.
Doi:10.1007/s10113-012-0326-1
Mika, J. and Farkas, A. 2017. Sensitivity of inland water bodies, natural vegetation and agriculture to weath- er extremes and to climate change. Tájökológiai Lapok 15. (2): 85–90. (in Hungarian with English abstract) Milosevic, D. and Savic, S. 2013. Analysis of pre- cipitation quantities and trends from Pannonian and Peripannonian parts of Serbia. Dela 39. 125–139.
Milosevic, D., Savic, S., Pantelic, M., Stankov, U., Ziberna, I., Dolinaj, D. and Lescesen, I. 2017.
Variability of seasonal and annual precipitation in Slovenia and its correlation with large-scale atmos- pheric circulation. Open Geosciences 8. (1): 593–605.
Müller, M., Kašpar, M. and Matschullat, J. 2009.
Heavy rains and extreme rainfall-runoff events in Central Europe from 1951 to 2002. Natural Hazards and Earth System Sciences 9. 441–450. Available at https://doi.org/10.5194/nhess-9-441-2009
Négyesi, G. 2018. Surveying the spatiotemporal chang- es of afforestation in the Nyírség – from the aspect of wind erosion. Tájökológiai Lapok 16. (2): 113–128.
(in Hungarian with English abstract)
Négyesi, G., Lóki, J., Buró, B. and Szabó, Sz. 2016. Effect of soil parameters on the threshold wind velocity and maximum eroded mass in a dry environment.
Arabian Journal of Geosciences 9. 588–599.
Négyesi, G., Lóki, J., Buró, B., Szabó, J., Bakacsi, Zs.
and Pásztor, L. 2015. The potential wind erosion map of an area covered by sandy and loamy soils – based on wind tunnel measurements. Zeitschrift für Geomorphologie 59. (1): 59–77.
Panagos, P., Ballabio, C., Borelli, P., Meusburger, K., Klik, A., Rousseva, S., Perčec Tadić, M., Michaelides, S., Hrabalíková, M., Olsen, P., Aalto, J., Lakatos, M., Rymszewicz, A., Dumitrescu, A., Begueria, S. and Alewell, C. 2015. Rainfall erosiv- ity in Europe. Science of the Total Environment 511.
801–814.
Pásztor, L., Körösparti, J., Bozán, Cs., Laborczi, A.
and Takács, K. 2015. Spatial risk assessment of hy- drological extremities: Inland excess water hazard, Szabolcs-Szatmár-Bereg county, Hungary. Journal of Maps 11. (4): 636–644.
Pásztor, L., Négyesi, G., Laborczi, A., Kovács, T., László, E. and Bihari, Z. 2016a. Integrated spatial assessment of wind erosion risk in Hungary. Natural Hazards and Earth System Sciences 16. 2421–2432.
Pásztor, L., Laborczi, A., Takács, K., Szatmári, G., Illés, G., Fodor, N., Négyesi, G., Bakacsi, Zs. and Szabó, J. 2016b. Spatial distribution of selected soil features in Hajdú-Bihar county represented by digi- tal soil maps. Acta Geographica Debrecina. Landscape and Environment 10. (3–4): 203–213.
Pásztor, L., Waltner, I., Centeri, Cs., Belényesi, M.
and Takács, K. 2016c. Soil erosion of Hungary as- sessed by spatially explicit modelling. Journal of Maps 12. (1): 407–414. Doi: 10.1080/17445647.2016.1233913 Pieczka, I., Pongrácz, R. and Bartholy, J. 2011.
Expected trends of regional climate change for the Carpathian Basin for the 21st century. International Journal of Environment and Pollution 46. (1–2): 6–17.
Pirkhoffer, E., Czigány, Sz. and Geresdi, I. 2009.
Impact of rainfall pattern on the occurrence of flash floods in Hungary. Zeistschrift für Geomorphologie N.
F. 53. Supplement 2. 139–157.
Pongrácz, R., Bartholy, J. and Kis, A. 2014. Estimation of future precipitation conditions for Hungary with special focus on dry periods. Időjárás 118. (4):
305–321.
R. Core Team 2017. R: A Language and Environment for Statistical Computing. Vienna, R Foundation for Statistical Computing. Available at https://ww- w.R-project.org/
Renard, K.G. and Freimund, J.R. 1994. Using monthly precipitation data to estimate the R-factor in the re- vised USLE. Journal of Hydrology 157. (1–4): 287–306.
Rodrigo-Comino, J., Neumann, M., Remke, A. and Ries, J.B. 2019. Assessing environmental changes in abandoned German vineyards. Understanding key issues for restoration management plans. Hungarian Geographical Bulletin 67. (4): 319–332.
Spinoni, J., Lakatos, M., Szentimrey, T., Bihari, Z., Szalai, S., Vogt, J. and Antofie, T. 2015. Heat and cold waves trends in the Carpathian Region from
1961 to 2010. International Journal of Climatology 35.
(14): 4197–4209. Doi:10.1002/joc.4279
Sullivan, G.M. and Feinn, R. 2012. Using effect size – or why the P value is not enough. Journal of Graduate Medical Education 4. (3): 279–282. Doi:
10.4300/JGME-D-12-00156.1
Szalai, S., Auer, I., Hiebl, J., Milkovich, J., Radim, T., Stepanek, P., Zahradnicek, P., Bihari, Z., Lakatos, M., Szentimrey, T., Limanowka, D., Kilar, P., Cheval, S., Deák, Gy., Mihic, D., Antolovic, I., Nejedlik, P., Stastny, P., Mikulova, K., Nabyvanets, I., Skyryk, O. and Krakovskaya, S. 2013. Climate of the Greater Carpathian Region. Final technical report.
Available at http://www.carpatclim-eu.org Szentimrey, T. 2011. Manual of homogenization software
MASHv3. 03. Budapest, Hungarian Meteorological Service.
Szentimrey, T. and Bihari, Z. 2007. Mathematical background of spatial interpolation, Meteorological interpolation based on surface homogenized data bases (MISH). In COST Action 719. Budapest, COST Office, 17–27.
Szentimrey, T., Lakatos, M., Bihari, Z., Kovacs, T., Szalai, S., Auer, I., Hiebl, J., Milkovic, J., Stepanek, P. and Zahradnicek, P. 2012. Final Report on Quality Control and Data Homogenization Measures Applied per Country, Including QC Protocols and Measures to Determine the Achieved Increase in Data Quality. 12.
CARPATCLIM Project Deliverable D1. Available at http://www.CARPATCLIM-eu.org/docs/ deliv- erables/D1_12.pdf
Szűcs, P., Csepinszky, B., Sisák, I. and Jakab, G. 2006.
Rainfall simulation in wheat culture at harvest.
Cereal Research Communications 34. (1): 81–84.
Újvári, G., Mentes, Gy., Bányai, L., Kraft, J., Gyimóthy, A. and Kovács, J. 2009. Evolution of a bank failure along the River Danube at Dunaszekcső, Hungary.
Geomorphology 109. 197–209.
Van Leeuwen, B., Henits, L., Mészáros, M., Szatmári, J., Tobak, Z., Pavić, D., Savić, S. and Dolinaj, D.
2013. RapidEye satellite imagery for inland excess water identification. Hidrológiai Közlöny 93. (3):
17–24. (in Hungarian with English abstract) Waltner, I., Pásztor, L., Centeri, Cs., Takács, K.,
Pirkó, B., Koós, S. and László, P. 2018. Evaluating the new soil erosion map of Hungary – a semi-quan- titative approach. Land Degradation & Development 29. (4): 1295–1302.
Wickham, H. and Henry, L. 2018. Tidyr: Easily tidy data with ’spread ()’ and ’gather ()’ functions. R package version 0.8.0. Available at https://CRAN.R-project.
org/package=tidyr
Wischmeier, W.H. and Smith, D.D. 1978. Predicting rainfall erosion losses: A guide to conservation planning.
USDA Agricultural Handbook 537. Washington D.
C., US Government Printing Office.
Zhang, F., Odins, A.M. and Nielsen-Gammon, J.W. 2006. Mesoscale predictability of an extreme warm-season precipitation event. Weather and Forecasting 21. 149–166. Available at https://doi.
org/10.1175/WAF909.1