Article
Sedimentological-Geochemical Data Based Reconstruction of Climate Changes and Human Impacts from the Peat Sequence of Round Lake in the Western Foothill Area of the Eastern
Carpathians, Romania
Réka Orsolya Tapody1, Pál Sümegi1,*, Dávid Molnár1 , MátéKarlik2,3, Tünde Tör ˝ocsik1, Péter Cseh1 and LászlóMakó1
Citation: Tapody, R.O.; Sümegi, P.;
Molnár, D.; Karlik, M.; Tör˝ocsik, T.;
Cseh, P.; Makó, L.
Sedimentological-Geochemical Data Based Reconstruction of Climate Changes and Human Impacts from the Peat Sequence of Round Lake in the Western Foothill Area of the Eastern Carpathians, Romania.
Quaternary2021,4, 18.
https://doi.org/10.3390/quat4020018
Academic Editor: Simon M. Hutchinson
Received: 17 March 2021 Accepted: 28 May 2021 Published: 10 June 2021
Publisher’s Note:MDPI stays neutral with regard to jurisdictional claims in published maps and institutional affil- iations.
Copyright: © 2021 by the authors.
Licensee MDPI, Basel, Switzerland.
This article is an open access article distributed under the terms and conditions of the Creative Commons Attribution (CC BY) license (https://
creativecommons.org/licenses/by/
4.0/).
1 Department of Geology and Palaeontology, University of Szeged, Egyetem Str. 2-6, H-6722 Szeged, Hungary;
tapody@geo.u-szeged.hu (R.O.T.); molnard@geo.u-szeged.hu (D.M.); t.torocsik@geo.u-szeged.hu (T.T.);
cspeti94@gmail.com (P.C.); makolacy@gmail.com (L.M.)
2 Isotope Climatology and Environmental Research Centre, Institute for Nuclear Research, Bem Square 18/c, H-4026 Debrecen, Hungary; karlik.mate@csfk.mta.hu
3 Institute for Geological and Geochemical Research, RCAES, Budaörsi Str. 45, H-1112 Budapest, Hungary
* Correspondence: sumegi@geo.u-szeged.hu
Abstract:This paper presents the results of comparative sedimentological and geochemical analysis of the mire at Sânpaul, Round Lake (Kerek-tó). The palaeoecological site is situated in the western foothill area of the Eastern Carpathians in Romania. The primary objective of this study was to analyse the accumulation of major and trace elements in a 7500 year-long peat and lake deposition.
The concentrations of 13 elements were determined by using handheld XRF. This paper presents the results of a multidisciplinary study, for which the principal aims were to examine the long- term relationship between land degradation in the Homoród Hills using various palaeoecological techniques, primarily comparative geochemical analyses. The PCA of elemental concentrations suggests that Round Lake is mainly controlled by the input of inorganic mineral matter and the LOI550 of peat. However, some elements are influenced by biological processes of vegetation and groundwater. Geohistorical studies compared with vegetation changes and elemental distribution helped the detection of erosion phases in the level of 12 prehistoric cultures.
Keywords:handheld XRF; geochemistry; human impact; peat; paleoenvironment reconstruction
1. Introduction
Peats are accumulated and formed by the partial decomposition of mosses and other bryophytes, sedges, grasses, shrubs and trees under waterlogged conditions [1]. Peatlands are important paleoenvironmental archives, enclosing plant matter, soil deposition, atmo- spheric particles and anthropogenic aerosols. Geochemical analysis of these objects has an important role in paleoenvironmental and palaeoclimatological investigations because major and trace elements are the indicators of natural environmental and anthropogenic processes. Their presence can be attributed to the soil, vegetation, atmospheric precipitation and groundwater supply [1–7].
Round Lake is a dried-up, human-made rainwater reservoir lake, used for watering livestock at the end of the 19th century. This protected the Holocene 7500 year-long peat and lake record from dehydration and degradation, rendering it ideal for absolute dated palaeoecological and paleoenvironmental studies. Moreover, as there are Medieval, Roman Imperial and even older settlements in the vicinity of the site, potential records of human impact on the site must have been preserved as well. The peat and sediment layers of the lake basin provide a record of climatic, palaeoecological and hydrological changes and are suitable to reconstruct the relationship between prehistoric human communities and
Quaternary2021,4, 18. https://doi.org/10.3390/quat4020018 https://www.mdpi.com/journal/quaternary
Quaternary2021,4, 18 2 of 29
their surrounding environment. Today Round Lake is surrounded by a wet meadow with shrubs and trees [8]. Our work was mainly motivated by the fact that the examined site is located near the lower part of the mid-mountain zone and up to now Transylvanian environmental historical works, based on geochemistry and pollen analyses, focused solely on high mountains or hilly-alluvial areas [9–20].
2. Materials and Methods 2.1. Site Location
Round Lake is situated in the southwestern foothills of Hargita Mountains in the Eastern Carpathians at an altitude of 547 m above sea level (Figure1). The area of the former lake, which was located 2 km northeast of Sânpaul (Transylvania, Romania), may have been approximately 2–3 hectares. The wider surrounding of the bedrock consists of tertiary silty clay layers at the bottom, overlain by Late Tertiary-Quaternary volcanic tuff and tuffite [21,22].
of the lake basin provide a record of climatic, palaeoecological and hydrological changes and are suitable to reconstruct the relationship between prehistoric human communities and their surrounding environment. Today Round Lake is surrounded by a wet meadow with shrubs and trees [8]. Our work was mainly motivated by the fact that the examined site is located near the lower part of the mid-mountain zone and up to now Transylvanian environmental historical works, based on geochemistry and pollen analyses, focused solely on high mountains or hilly-alluvial areas [9–20].
2. Materials and Methods 2.1. Site Location
Round Lake is situated in the southwestern foothills of Hargita Mountains in the Eastern Carpathians at an altitude of 547 m above sea level (Figure 1). The area of the former lake, which was located 2 km northeast of Sânpaul (Transylvania, Romania), may have been approximately 2–3 hectares. The wider surrounding of the bedrock consists of tertiary silty clay layers at the bottom, overlain by Late Tertiary-Quaternary volcanic tuff and tuffite [21,22].
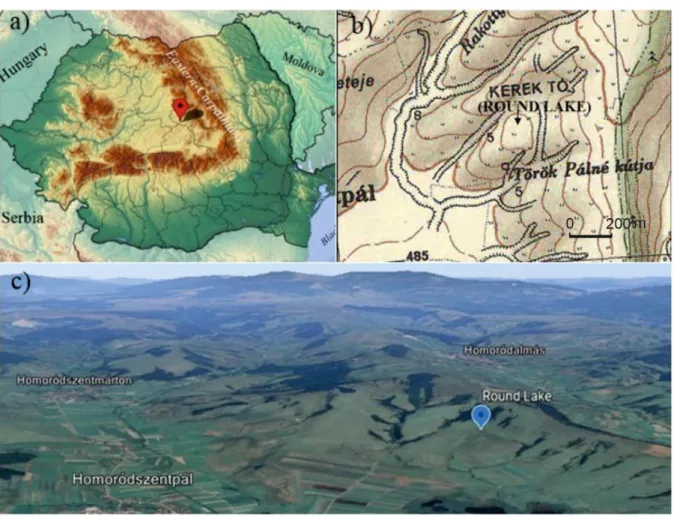
Figure 1. Map of Romania within the studied site Round Lake at Sănpaul (edited by Réka Orsolya Tapody adapted from:
mapsland.com and Google Maps—accessed on 30 April 2021). (a) The location of the site in Romania (b) The vicinity of the site in a topographic map (which is roughly 1 × 1 km); (c) and in an aerial view (the distance of the site and Homoród- szentpál (Sânpaul) is 2 km)
The foothill surfaces around Sânpaul are comprised of middle Miocene (primary Sar- matian) siliciclastics, while along the valleys Quaternary alluvial deposits occur (Figure 2). The topmost part of the hills, hence the limbs of the anticline consist of Sarmatian marls, sandstone and few centimetre-thick tuff layers [23,24]. The folds, observable around Sânpaul, were formed as a result of a large, basin-scale late Miocene (primary Sarmatian) Figure 1.Map of Romania within the studied site Round Lake at Sănpaul (edited by Réka Orsolya Tapody adapted from:
mapsland.comand Google Maps—accessed on 30 April 2021). (a) The location of the site in Romania (b) The vicinity of the site in a topographic map (which is roughly 1×1 km2); (c) and in an aerial view (the distance of the site and Homoródszentpál (Sânpaul) is 2 km).
The foothill surfaces around Sânpaul are comprised of middle Miocene (primary Sar- matian) siliciclastics, while along the valleys Quaternary alluvial deposits occur (Figure2).
The topmost part of the hills, hence the limbs of the anticline consist of Sarmatian marls, sandstone and few centimetre-thick tuff layers [23,24]. The folds, observable around Sânpaul, were formed as a result of a large, basin-scale late Miocene (primary Sarmatian) gravitational slide which affected the whole Transylvanian Basin [24]. The salt pushed
the covering Sarmatian sedimentary record on different scales, but in several places, like Sânpaul, the salty subsoil water extruded to the surface [25] in the alluvial surfaces of the Quaternary valleys. During the Quaternary the climate changes and the sediment supply vs. rivers low base level and transport capacity filled up the valleys, generating wetlands in the floodplain (lakes and swamps within salty lakes) [26–28]. The catchment basin of Round Lake is surrounded by an extensive pastureland surface with some pine forests and degraded, eroded soil blanket. Based on the excavations at the edge of the pastureland, the original soil may have been brown earth. The original vegetation has been completely changed to pastures and subordinately arable land. The current vegetation of the surroundings of the catchment basin can be defined as a mixture of pine patches and strips, and overgrazed meadows. In addition to the deforestation activities as basic human impact [29], the soil erosion intensified–similar to the regressive valley evolution, can be observed in the area–by the strong tectonic uplift of the Eastern Carpathians-including Seklerland and Subcarpatii Homoroadelor regions [30–32].
gravitational slide which affected the whole Transylvanian Basin [24]. The salt pushed the covering Sarmatian sedimentary record on different scales, but in several places, like Sânpaul, the salty subsoil water extruded to the surface [25] in the alluvial surfaces of the Quaternary valleys. During the Quaternary the climate changes and the sediment supply vs. rivers low base level and transport capacity filled up the valleys, generating wetlands in the floodplain (lakes and swamps within salty lakes) [26–28]. The catchment basin of Round Lake is surrounded by an extensive pastureland surface with some pine forests and degraded, eroded soil blanket. Based on the excavations at the edge of the pas- tureland, the original soil may have been brown earth. The original vegetation has been completely changed to pastures and subordinately arable land. The current vegetation of the surroundings of the catchment basin can be defined as a mixture of pine patches and strips, and overgrazed meadows. In addition to the deforestation activities as basic human impact [29], the soil erosion intensified–similar to the regressive valley evolution, can be observed in the area–by the strong tectonic uplift of the Eastern Carpathians-including Seklerland and Subcarpatii Homoroadelor regions [30–32].
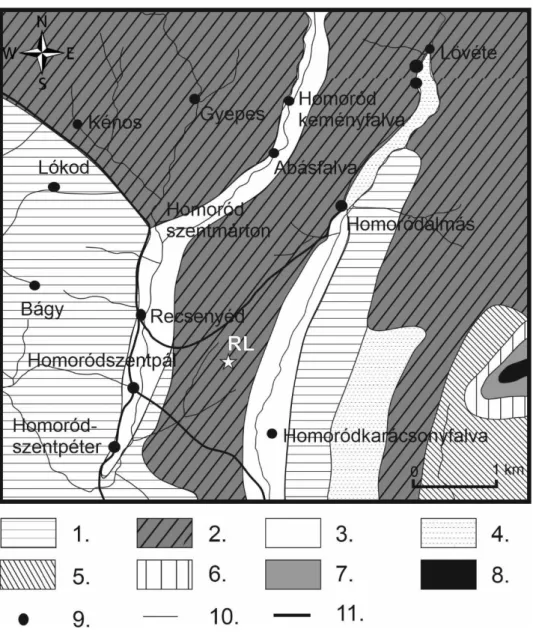
Figure 2. The 6 × 6 km2 geology map of the environment of the Round Lake. Symbols 1: Miocene marin marl, 2: Miocene marin marl with dacite tuff layers, 3: Holocene alluvia, 4: Dacite tuff and conglomerate, 5: Capronita bearing limestone and conglomerate, 6: Tithonian limestone 7: Kim- meridgian limestone, 8: Triassic limestone, 9: Settlement, 10: Creek, 11: Road, Star: points the inves- tigated site, RL: the abbreviation of Round Lake
Figure 2.The 6×6 km2geology map of the environment of the Round Lake. Symbols 1: Miocene marin marl, 2: Miocene marin marl with dacite tuff layers, 3: Holocene alluvia, 4: Dacite tuff and conglomerate, 5: Capronita bearing limestone and conglomerate, 6: Tithonian limestone, 7: Kim- meridgian limestone, 8: Triassic limestone, 9: Settlement, 10: Creek, 11: Road, Star: points the investigated site, RL: the abbreviation of Round Lake.
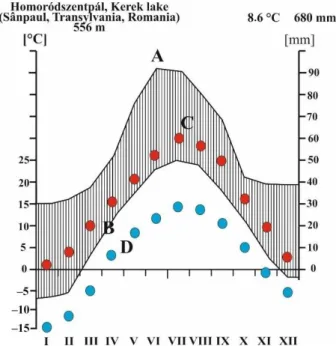
This region forms a contact area between the so-called Transylvanian Plain and the foothill region of the Hargita Mountains, characterized by 500–700 m high hills, and a large antecedent valley system within fishponds and a few salty lakes. Today, the climate in the region is temperate continental, and can be characterized by 7–9◦C annual mean tempera- ture and 550–600 mm annual mean precipitation (Figure3) with the highest values in boreal spring and summer [26]. The climate data on which the Walter-Lieth diagram is based, have been interpreted for the Round Lake of Sânpaul l because there is no climate station with standard, public data. Based on the climate data, the natural vegetation–without human impact–would be suggested as a temperate closed forest (beeches, hornbeam with beeches) with well-developed brown forest soil. Due to the human impact, the natural forest cover is completely missing. The soil cover has been transformed into anthrasol and earthy barren soil [33].
This region forms a contact area between the so-called Transylvanian Plain and the foothill region of the Hargita Mountains, characterized by 500–700 m high hills, and a large antecedent valley system within fishponds and a few salty lakes. Today, the climate in the region is temperate continental, and can be characterized by 7–9 °C annual mean temperature and 550–600 mm annual mean precipitation (Figure 3) with the highest val- ues in boreal spring and summer [26]. The climate data on which the Walter-Lieth dia- gram is based, have been interpreted for the Round Lake of Sânpaul l because there is no climate station with standard, public data. Based on the climate data, the natural vegeta- tion–without human impact–would be suggested as a temperate closed forest (beeches, hornbeam with beeches) with well-developed brown forest soil. Due to the human impact, the natural forest cover is completely missing. The soil cover has been transformed into anthrasol and earthy barren soil [33].
Figure 3. Climate data on Walter-Lieth diagram of the Round Lake (A: mean maximum precipita- tion, B: mean minimum precipitation, C: mean maximum temperatures, D: mean minimum tem- peratures)
2.2. Sampling
Coring was accomplished by a 5 cm diameter sealed liner tube Russian peat corer [34,35] in the centre of the former lake in June 2015. Two overlapping cores were extracted, conforming to the general practice in Quaternary paleoenvironmental studies [35]. After transportation to the lab, they were cut in half lengthwise. Sections for sedimentological, geochemical and palaeobotanical analysis were stored at 4 °C by the international stand- ard. The core was sliced into 4-cm intervals for geochemical analysis.
2.3. Magnetic Susceptibility Analysis
Environmental magnetic analyses were carried out on bulk samples [36–39]. Samples were collected at 1–4 cm intervals. Before the start of the measurement, all samples were crushed in a glass mortar after weighing. At that time samples were cased in plastic boxes and dried in air in an oven at 40 °C for 24 h. Afterwards, magnetic susceptibilities were measured at a frequency of 2 kHz using an MS2 Bartington magnetic susceptibility meter with an MS2E high-resolution sensor [40,41]. All of the samples were measured three times, and the average values of magnetic susceptibility were computed and reported.
The MS is used to detect paleosol layers in loess sediments [36,39,42–44]. In our case, the Figure 3.Climate data on Walter-Lieth diagram of the Round Lake (A: mean maximum precipitation, B: mean minimum precipitation, C: mean maximum temperatures, D: mean minimum temperatures).
2.2. Sampling
Coring was accomplished by a 5 cm diameter sealed liner tube Russian peat corer [34,35]
in the centre of the former lake in June 2015. Two overlapping cores were extracted, con- forming to the general practice in Quaternary paleoenvironmental studies [35]. After transportation to the lab, they were cut in half lengthwise. Sections for sedimentological, geochemical and palaeobotanical analysis were stored at 4◦C by the international standard.
The core was sliced into 4-cm intervals for geochemical analysis.
2.3. Magnetic Susceptibility Analysis
Environmental magnetic analyses were carried out on bulk samples [36–39]. Samples were collected at 1–4 cm intervals. Before the start of the measurement, all samples were crushed in a glass mortar after weighing. At that time samples were cased in plastic boxes and dried in air in an oven at 40◦C for 24 h. Afterwards, magnetic susceptibilities were measured at a frequency of 2 kHz using an MS2 Bartington magnetic susceptibility meter with an MS2E high-resolution sensor [40,41]. All of the samples were measured three times, and the average values of magnetic susceptibility were computed and reported. The MS is used to detect paleosol layers in loess sediments [36,39,42–44]. In our case, the presence of magnetic minerals in the mire was used for the appearance of soil and rock erosion [45].
2.4. Sedimentological Analysis and Lithological Description
Grain-size composition was determined using the Mie method. Samples were pre- treated with 1 M HCl and H2O2 to remove CaCO3 and LOI550, respectively. For a more detailed description of the pre-treatment process, see [46]. All the samples were measured for 42 size intervals between 0.0001 and 0.5 mm using a Laser Particle Size Analyzer type Easy Sizer 2.0 and Fritsch sieves at the Geoarchaeological and Palaeoecological Lab of the Department of Geology and Palaeontology, University of Szeged, Hungary.
The lithostratigraphic description of the samples followed the system of Troels- Smith [47–49], which was developed for unconsolidated sediments. The basis of the system is the consideration of Quaternary lake, swamp and peat sediments as a mixture of a specified number of components and grouping them into six categories according to their genetics.
2.5. Loss-On Ignition
For LOI examination sub-samples were taken at every 2 cm intervals and the loss on ignition method was applied, commonly used for the analysis of LOI550 and carbonate content of calcareous sediments [50–52]. In the first step, the samples are prepared for analysis by drying (60◦C) and grounding. Approximately 1 g of sample was weighed accurately into a porcelain crucible, which was weighed before and after heating and the two weights compared. The sample placed in a previously weighed crucible, and oven-drying at 105◦C (24 h) to constant weight. The cooled samples are then weighed to obtain the weight of the air-dry sample. In the second phase, the samples are heated at 550◦C (2.5 h), to combust the LOI550. The LOI550 content is calculated from the the following equation.
LOI550 = ((DW105−DW550)/DW105)×100
In the third and final phase, the sample is heated at 950◦C (DEAN 1974, HEIRI et al., 2001) [52,53], to evolve the carbonate content. Calculated as:
LOI950 = ((DW550−DW950)/DW105)×100
According to Santiteban et al., 2004. [54] we use LOI550, LOI950 and LOI res (residum) expressions for different stages of measurements.
2.6. Sample Preparation and Geochemical Analysis
The element composition analysis of samples was performed with Spectro xSort COMBI HH03 handheld X-ray fluorescence spectrometer (pXRF), equipped with a Rh tube and SSD detector. During the measurements, the handheld XRF was placed in a docking station. The element compositions (Mg to U) were measured with Mining FP calibration.
This calibration tested with certificated CRM geological standards samples.
Samples were prepared for measurement by drying at 105◦C to constant weight, then grinded to less than 63 micrometre particle size. Each sample prepared 3 times to parallel measurements. To the measurement 5 gram sample infused to the plastic sample holder following the Spectro sample preparation guide. The uniform density of the samples was guaranteed by pressure. The measurement time with two filter 180 s/sample. Measurement results were evaluated using the XRF Analyzer Pro program. After each sample series we plotted the cal. concentration and net count data as a cross plot. The fitted equation R2 parameter more than 0.9.
2.7. Statistical Analysis and PCA
Statistical analysis was performed by using SPSS 25.0 statistical software package and PAST 3X Paleontological Data Analysis [53]. Spearman rho correlation coefficient was used for the XRF data. Principal Component analysis was used to identify the main factors that control elemental distribution in the core section. The PCA was performed in the correlation
mode and a varimax rotation to maximize the loadings of the variables in the components.
Before analysis all data were converted to Z-scores calculated as (Xi−Xavg)/Xstd, where Xi is the variable and Xavgand Xstdare the series average and standard deviation, respectively, of the variable Xi[54,55].
2.8. Radiocarbon Dating
AMS14C dating was performed in the Hertelendi Laboratory of Environmental Stud- ies in the Nuclear Research Center of the Hungarian Academy of Sciences in Debrecen (Hungary) and Direct AMS Laboratory in Seattle (USA) on ten samples for plants and peat samples from the core sequence. The preparation of the samples and the actual steps of the measurement followed the methods of Hertelendi et al. [56–68] and Molnár et al. [59]).
The-depth model was generated using Bacon [60,61]. Conventional radiocarbon ages were converted to calendar ages using IntCal20 calibration curve [62]. Calibrated ages are reported at the 2-sigma confidence level (95.4%).
2.9. Pollen Analysis
The undisturbed core sequence was sampled for pollen at 4-cm intervals. Samples of 1 cm3wet sediment were prepared for pollen analysis in the pollen laboratory of the Department of Geology and Palaeontology at Szeged University using standard methods and micro-sieving at 10 um [63]. Lycopodium spore tablets of known concentrations were added to each sample [64] to work out pollen concentrations. Pollen and spores were identified and counted under a light microscope at 400–1000×magnification. Minimum 500 pollen grains were counted. For the identification of pollen and spores, the reference database of the Department of Geology and Palaeontology at Szeged University and pollen atlases and keys were used [65–68]. The palaeovegetation was reconstructed using the works of Sugita [69], Soepboer et al. [70], Jacobson and Bradshaw [71], Prentice [72] and Magyari et al. [73,74]. Statistical analysis and plotting of the pollen data were done using the software package Psimpoll [75,76].
3. Results
The characteristics of Round Lake peat are various; thus, 6 different sediment types and 16 layers can be distinguished [77]. The dominant botanical composition of the peat is reed and sedge peat, and two Sphagnum peat layers present in two sections (320–362 cm and 510–530 cm). In terms of its evolution, the sequence can be divided into a lake sediment zone (0–104 cm), a mire zone (198–560 cm) and the upper part of the mire zone can be defined as a geochemical transition zone (104–198 cm).
3.1. Sedimentological Results and Undisturbed Core Sequence Description
Based on the macroscopic observations on the profile, the particle size distribution, the loss on ignition and magnetic susceptibility measurements (279 samples), 16 sedimentary units could be distinguished (Table1).
The bottom layer of the borehole consists of slightly carbonaceous peat (Troels-Smith:
Th3As1) with 75%–82% organic content by LOI550 (Table1). Unfortunately, despite the extraordinary effort made during the fieldwork [77] it was not possible to drill through the peat layer and reach the bottom layer of the peat series of the lake because of the extreme pressure and groundwater effect. The bottom of the borehole can be defined as the slightly pelitic carbonaceous peat layer which was formed between 7500 and 7000 cal BP (5500–5000 cal BC).
Peat formation continued between 530 and 510 cm but the composition of the peat changed. Sphagnum taxa appeared in the profile and a dark brown, slightly pelitic car- bonaceous peat level with significant LOI550 content of more than 80% developed between 7000 and 6500 cal BP/5000–4500 cal BC in the Late Neolithic phase (Table1).
The third layer, between 510–392 cm (6500 and 5000 cal BP/4500–3000 cal BC), also consists of peat (Table1) but Sphagnum disappeared at this level and slightly carbonaceous,
pelitic-fine silty peat layer developed (Th2Lc1As1) with an LOI550 content of over 80%
from flowering plants (Figure4).
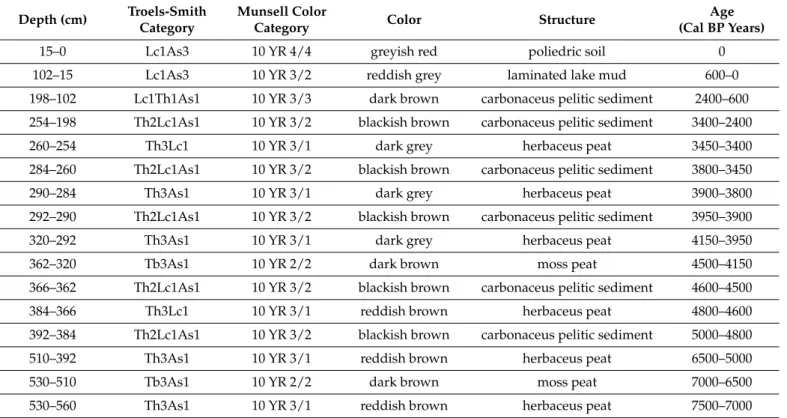
Table 1. Sediment layers and their description from the undisturbed core sequence of Round Lake. Th: Turfa herbacea Tb:turfa bryophitica Lc: Limus calcareus As: Agrilla steatodes (Troels-Smith scheme available onhttps://pg-du.org/troels- smith-scheme/(accessed on 19 April 2021)).
Depth (cm) Troels-Smith Category
Munsell Color
Category Color Structure Age
(Cal BP Years)
15–0 Lc1As3 10 YR 4/4 greyish red poliedric soil 0
102–15 Lc1As3 10 YR 3/2 reddish grey laminated lake mud 600–0
198–102 Lc1Th1As1 10 YR 3/3 dark brown carbonaceus pelitic sediment 2400–600
254–198 Th2Lc1As1 10 YR 3/2 blackish brown carbonaceus pelitic sediment 3400–2400
260–254 Th3Lc1 10 YR 3/1 dark grey herbaceus peat 3450–3400
284–260 Th2Lc1As1 10 YR 3/2 blackish brown carbonaceus pelitic sediment 3800–3450
290–284 Th3As1 10 YR 3/1 dark grey herbaceus peat 3900–3800
292–290 Th2Lc1As1 10 YR 3/2 blackish brown carbonaceus pelitic sediment 3950–3900
320–292 Th3As1 10 YR 3/1 dark grey herbaceus peat 4150–3950
362–320 Tb3As1 10 YR 2/2 dark brown moss peat 4500–4150
366–362 Th2Lc1As1 10 YR 3/2 blackish brown carbonaceus pelitic sediment 4600–4500
384–366 Th3Lc1 10 YR 3/1 reddish brown herbaceus peat 4800–4600
392–384 Th2Lc1As1 10 YR 3/2 blackish brown carbonaceus pelitic sediment 5000–4800
510–392 Th3As1 10 YR 3/1 reddish brown herbaceus peat 6500–5000
530–510 Tb3As1 10 YR 2/2 dark brown moss peat 7000–6500
530–560 Th3As1 10 YR 3/1 reddish brown herbaceus peat 7500–7000
The fourth level (392–384 cm) consisted of a characteristic leaching, degradation- accumulation level with notable carbonate content, increased fine silt, coarse silt and sand content, and less significant (below 40%) LOI550 (Figure4, Table1). This characteristic erosion-accumulation level (392–384 cm) developed between 5000 and 4800 cal BP (3000 to 2800 cal BC) years, at the level of the Late Copper and Early Bronze Age Co¸tofeni culture [78].
The erosional sediment level was ended, and peat formation continued in the fifth level (384–366) (Figure4, Table1). As a result, a reddish-brown layer of peat developed, predominantly consists of flowering plants remains. The LOI550 exceeded 70% and the LOI950 occurred below 8% in this level (Figure4).
Between 366–362 cm (4600–4500 cal BP/2600–2500 cal BC years) an erosion-accumulation level developed again. The development of the erosional level is also supported by the mag- netic susceptibility (MS signal) values. After the erosion level spans over about 100 calendar years, peat formation continued in the catchment basin of Round Lake with the development of a Sphagnum peat level (Tb3As1) between 362–320 cm (4500–4181 cal BP/2500–2181 cal BC years). The Sphagnum peat level was slightly carbonaceous with a carbonate content of 4%–5% (Figure3).
The development of peat levels continued between 320–292 cm (4181–3950 cal BP/
2181–1950 cal BC), however instead of Sphagnum remains, flowering plants provided the major material of this peat level (Th3As1).
Between 292–290 cm (3950–3900 cal BP/1950–1900 cal BC years), a significant erosion- accumulation level developed with the sharp increase of coarse silt and LOIres. The presence of this erosion level is also supported by the values of magnetic susceptibility.
This short-term erosion level is very significant, the decrease of both LOI550, clay and fine silt is more than 20% (Figure4).
Quaternary 2021, 4, x FOR PEER REVIEW 8 of 32
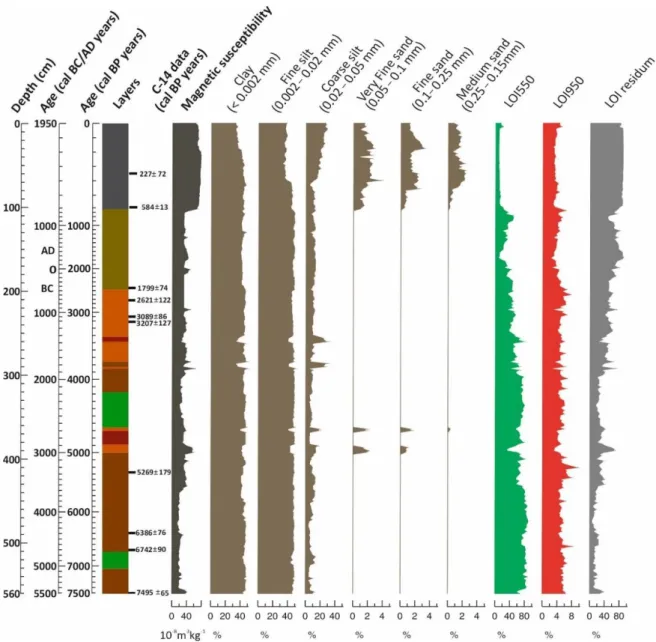
Figure 4. Magnetic susceptibility, grain size and loss on ignition of the Round Lake at Homoródszentpál (Sânpaul, Roma- nia).
The fourth level (392–384 cm) consisted of a characteristic leaching, degradation-ac- cumulation level with notable carbonate content, increased fine silt, coarse silt and sand content, and less significant (below 40%) LOI550 (Figure 4, Table 1). This characteristic erosion-accumulation level (392–384 cm) developed between 5000 and 4800 cal BP (3000 to 2800 cal BC) years, at the level of the Late Copper and Early Bronze Age Coţofeni cul- ture [78].
The erosional sediment level was ended, and peat formation continued in the fifth level (384–366) (Figure 4, Table 1). As a result, a reddish-brown layer of peat developed, predominantly consists of flowering plants remains. The LOI550 exceeded 70% and the LOI950 occurred below 8% in this level (Figure 4).
Between 366–362 cm (4600–4500 cal BP/2600–2500 cal BC years) an erosion-accumu- lation level developed again. The development of the erosional level is also supported by the magnetic susceptibility (MS signal) values. After the erosion level spans over about 100 calendar years, peat formation continued in the catchment basin of Round Lake with the development of a Sphagnum peat level (Tb3As1) between 362–320 cm (4500–4181 cal BP/2500–2181 cal BC years). The Sphagnum peat level was slightly carbonaceous with a carbonate content of 4%–5% (Figure 3).
Figure 4.Magnetic susceptibility, grain size and loss on ignition of the Round Lake at Homoródszentpál (Sânpaul, Romania).
Between 290–284 cm (3900–3800 cal BP/1900–1800 cal BC years), the intensity of erosion decreased and peat formation continued. As a result, a dark gray peat layer developed with significant LOI550 content (above 60%). Compared to the previous erosion level, the coarse silt content decreased and fine silt increased with the decrease of the MS signal.
Between 284–260 cm (3800–3450 cal BP/1800–1840 cal BC), a significant erosion- accumulation level developed with sharply increased in LOI550, coarse silt and decreased LOI550 content. This erosion level is also supported by the values of magnetic susceptibility.
This strong-developed erosion level, which has lasted for more than 300 years, can be characterized by decreased LOI550, clay, fine silt more than 20% (Figure4).
A peat formation started again between 260–254 cm (3450–3400 cal BP/1450–1400 cal BC) and a slightly carbonaceous peat level (Th3Lc1) developed with a significant LOI550 content (Figure4and Table1).
Between 254–198 cm (3400–1400 cal BP/1400–400 cal BC), dark brown, slightly car- bonaceous, pelitic peat layer (Th2LcAs1) developed with finely dispersed clay and fine silt content in it. The LOI550 content gradually decreased in the peat layer, but at this level, it is still exceeded 40% and fluctuated between 40%–50% with smaller cycles on a decade scale (Figure4and Table1). This represents a 30%–40% reduction in LOI550 compared to the bottom peat layer developed at the beginning of the Middle Holocene. In parallel, the LOI550 content varied between 30%–40%.
The last peat layer of the undisturbed profile can be found between 189–102 cm (Figure4and Table1). In this layer, the LOI550 content heavily decreased, although it fluctuates between 10 and 50%. In parallel, inLOI550 and carbonate content also showed changes (Figure4and Table1).
From 102 cm to 15 cm (between the 14th and 20th centuries AD) finely laminated pelitic fine silt (containing subordinate LOI550 and carbonaceous clay) accumulated in the catchment basin.
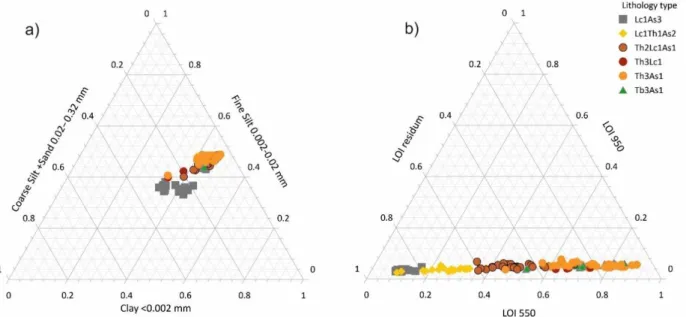
Characterization of the macroscopical sedimentological layers and loss on ignition values were interpreted by using the triangular method [79,80]. Clearly visible trends can be detected on the triangular diagram created by using LOI values (Figure5). The LOI950 was relatively similar in all samples (varied between 4% and 6%) due to the effect of the bedrock (marine marl deposited in the Miocene). The most significant LOI550 content can be detected in the herbaceous peat layer (Th3Lc1, Th3As1,), from which, samples of Sphagnum peat layers (Tb3As1) cannot be separated. The most significant LOI550 content (60%–90%) could be detected in the oldest peat layer.
Quaternary 2021, 4, x FOR PEER REVIEW 10 of 32
Figure 5. (a) The grain-size composition shown on a triangle diagram for each sample in lithology type. (b) LOI550, LOI950 and LOI residum shown on a triangle diagram for each sample in lithology type.
3.2. Descriptive Statistics and PCA Analysis
The geochemical development of the undisturbed profile was described using the changes in the composition of 13 elements (Table 2). Spearman’s rank correlation coeffi- cients matrix was constructed on the basis of the changes in element composition, which resulted in the definition of two different sedimentary environments on a geochemical basis.
Table 2. Major and trace elements mean concentration in the Round Lake whole section, compared to the lake and the peat phases (the positive deviations from the average concentrations are re- marked with bold numbers).
Total Section (0–560 cm)
Lake Phase (0–104 cm)
Peat Phase (104–560 cm)
Si (%) 16.61 27.40 14.06
Al (%) 4.84 7.52 4.21
Fe (%) 3.78 4.87 3.52
K (%) 1.04 1.71 0.88
Ca (%) 0.87 0.67 0.91
Ti (ppm) 3067.48 5504.38 2491.48
S (%) 0.13 0.00 0.16
P (%) 0.06 0.00 0.07
Mn (ppm) 124.97 348.07 72.24
Cr (ppm) 90.45 106.74 85.95
Rb (ppm) 72.66 113.26 63.06
Zr (ppm) 72.54 161.83 51.43
Sr (ppm) 66.33 95.17 59.51
The two sedimentary environments with different structures show different geo- chemical properties, which depend on various conditions. According to the elemental concentration, the major and trace elements in the whole sediment section can be arranged in a sequence: Si >Al > Fe > K > Ca > Ti > S > P > Mn > Cr > Rb > Zr > Sr. In comparison with the peat sequence (104–560 cm) calcium (Ca) and potassium (K) changed their place and Figure 5.(a) The grain-size composition shown on a triangle diagram for each sample in lithology type. (b) LOI550, LOI950 and LOI residum shown on a triangle diagram for each sample in lithology type.
3.2. Descriptive Statistics and PCA Analysis
The geochemical development of the undisturbed profile was described using the changes in the composition of 13 elements (Table2). Spearman’s rank correlation coeffi- cients matrix was constructed on the basis of the changes in element composition, which resulted in the definition of two different sedimentary environments on a geochemical basis.
Table 2.Major and trace elements mean concentration in the Round Lake whole section, compared to the lake and the peat phases (the positive deviations from the average concentrations are remarked with bold numbers).
Total Section (0–560 cm) Lake Phase (0–104 cm) Peat Phase (104–560 cm)
Si(%) 16.61 27.40 14.06
Al(%) 4.84 7.52 4.21
Fe(%) 3.78 4.87 3.52
K(%) 1.04 1.71 0.88
Ca(%) 0.87 0.67 0.91
Ti(ppm) 3067.48 5504.38 2491.48
S(%) 0.13 0.00 0.16
P(%) 0.06 0.00 0.07
Mn(ppm) 124.97 348.07 72.24
Cr(ppm) 90.45 106.74 85.95
Rb(ppm) 72.66 113.26 63.06
Zr(ppm) 72.54 161.83 51.43
Sr(ppm) 66.33 95.17 59.51
The two sedimentary environments with different structures show different geo- chemical properties, which depend on various conditions. According to the elemental concentration, the major and trace elements in the whole sediment section can be arranged in a sequence: Si >Al > Fe > K > Ca > Ti > S > P > Mn > Cr > Rb > Zr > Sr. In comparison with the peat sequence (104–560 cm) calcium (Ca) and potassium (K) changed their place and zirconium (Zr) with rubidium (Rb), therefore the arranged sequence in the mire section:
Si >Al > Fe > Ca > K > Ti > S > P > Mn > Cr > Rb > Zr. At the lake phase (0–104 cm) the last seven elements have been completely reordered: Si >Al > Fe > K > Ca > Ti > Mn > Zr > Rb
> Cr > S > P.
The same sedimentological picture is confirmed by the principal component analysis of the sedimentological and geochemical data of the samples (PCA), which makes clear the differences between the samples (279 pcs) described in detail macroscopically (Figure6).
We applied PCA to the MS, LOI550. LOI950, LOIres, all grainsize data and all analysed elements. We applied Z—Score transformation in the SPSS 25.0 statistical software package and PAST 3X. The two components have explained 78.9% of the total variance. The PC1 accounted for 63.45% of the total variance and PC2 component accounted for 15.45% the factor loading in Table3. The results are well supported by the Cluster analysis of variables performed in PAST 3X using the Paired Group (UPGMA) algorithm and the Manhattan similarity index. (Figure6).
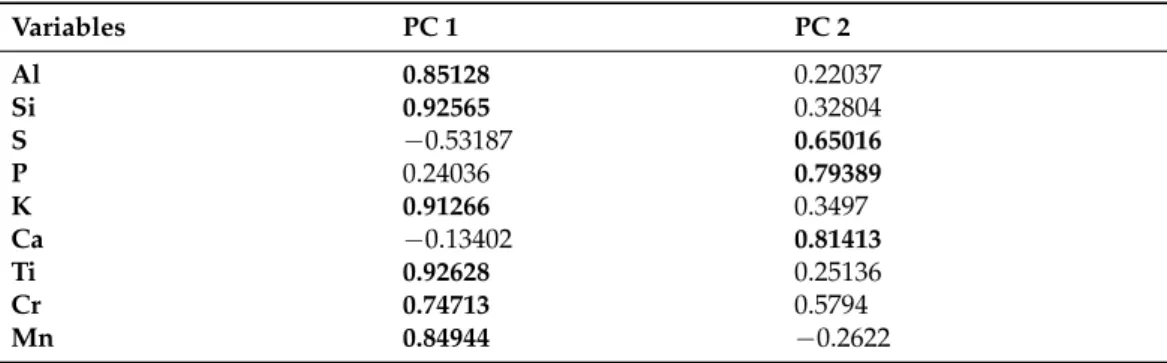
Table 3.Factor loadings for PC1 and PC2 (PC1 represents the lake phase, PC2 represents the peat phase, based on the higher values (bold) of loading values.
Variables PC 1 PC 2
Al 0.85128 0.22037
Si 0.92565 0.32804
S −0.53187 0.65016
P 0.24036 0.79389
K 0.91266 0.3497
Ca −0.13402 0.81413
Ti 0.92628 0.25136
Cr 0.74713 0.5794
Mn 0.84944 −0.2622
Table 3.Cont.
Variables PC 1 PC 2
Fe 0.77234 0.50753
Rb 0.90968 0.28342
Sr 0.89265 0.32182
Zr 0.97298 −0.063781
MS 0.92041 −0.15484
LOI550 −0.94313 0.025909
LOI950 −0.72301 0.17593
LOIres 0.94396 −0.031808
Clay −0.57733 0.21615
Fine silt −0.78114 0.36674
Coarse silt 0.68392 −0.28212
Vf sand 0.80249 −0.37068
Fine sand 0.77815 −0.38445
M. sand 0.7565 −0.39059
Quaternary 2021, 4, x FOR PEER REVIEW 12 of 32
Figure 6. Dendrogram obtained (UPGMA method with Manhattan similarity by PAST 3X) for cluster analysis of observa- tions.
3.3. Chronological Results
Results from the 12 radiocarbon (AMS) dates (Table 4, Figures 7 and 8) indicate an almost linear relationship of sediment deposition with time. The age-depth model with sedimentation rates (SR) was established by linear interpolation between the calibrated radiocarbon dates (Table 4). When indicating the age of a level where no radiocarbon date is available, we refer to the results of the linear interpolation.
Figure 6.Dendrogram obtained (UPGMA method with Manhattan similarity by PAST 3X) for cluster analysis of observations.
3.3. Chronological Results
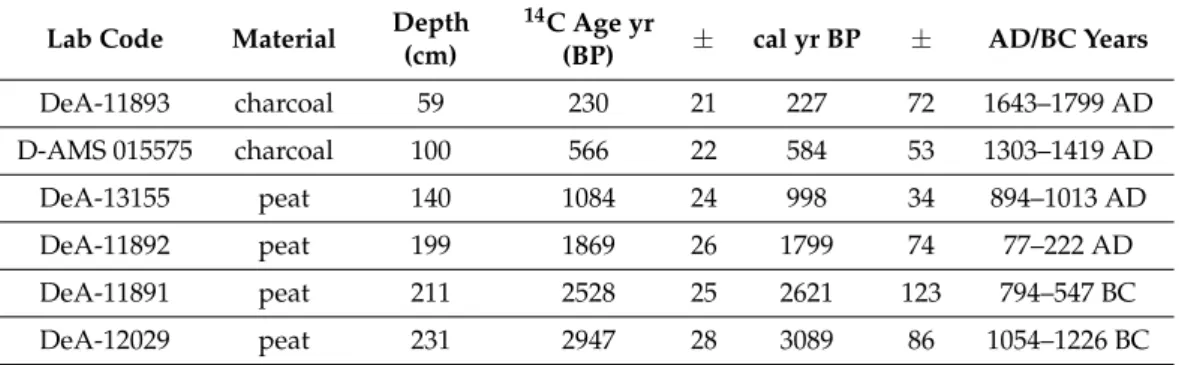
Results from the 12 radiocarbon (AMS) dates (Table4, Figures7and8) indicate an almost linear relationship of sediment deposition with time. The age-depth model with sedimentation rates (SR) was established by linear interpolation between the calibrated radiocarbon dates (Table4). When indicating the age of a level where no radiocarbon date is available, we refer to the results of the linear interpolation.
Table 4.12 AMS data from undisturbing core sequence of the Round Lake.
Lab Code Material Depth (cm)
14C Age yr
(BP) ± cal yr BP ± AD/BC Years
DeA-11893 charcoal 59 230 21 227 72 1643–1799 AD
D-AMS 015575 charcoal 100 566 22 584 53 1303–1419 AD
DeA-13155 peat 140 1084 24 998 34 894–1013 AD
DeA-11892 peat 199 1869 26 1799 74 77–222 AD
DeA-11891 peat 211 2528 25 2621 123 794–547 BC
DeA-12029 peat 231 2947 28 3089 86 1054–1226 BC
Table 4.Cont.
Lab Code Material Depth (cm)
14C Age yr
(BP) ± cal yr BP ± AD/BC Years
D-AMS 015574 peat 236 3015 26 3207 127 1131–1385 BC
DeA-13157 peat 320 3799 28 4183 53 4283–4090 BC
D-AMS 015577 peat 416 4602 28 5269 179 3141–3499 BC
DeA-11889 peat 489 5615 31 6386 76 4361–4512 BC
DeA-11888 peat 511 5916 33 6742 90 4713–4892 BC
D-AMS 015576 peat 560 6575 29 7495 65 5480–5610 BC
Quaternary 2021, 4, x FOR PEER REVIEW 13 of 32
Figure 7. Bayesian age-depth model using 14C age tie points and calculated sedimentation rates for sampled intervals using Bacon [60] for core Round Lake at Sânpaul, Romania. Top left: Markov Chain Monte Carlo model iterations. Top middle: prior (green line) and posterior (solid gray) dis- tribution of accumulation rate. Top right: prior (heavy green line) and posterior (solid gray) distri- bution of the model memory. Bottom, calibrated 14C dates in blue and the age–depth model. Grey stippled lines show 95% confidence intervals. The central dotted red curve is the ‘best’ model based on the weighted mean age.
Figure 7.Bayesian age-depth model using14C age tie points and calculated sedimentation rates for sampled intervals using Bacon [60] for core Round Lake at Sânpaul, Romania. Top left: Markov Chain Monte Carlo model iterations. Top middle: prior (green line) and posterior (solid gray) distribution of accumulation rate. Top right: prior (heavy green line) and posterior (solid gray) distribution of the model memory. Bottom, calibrated 14C dates in blue and the age–depth model. Grey stippled lines show 95% confidence intervals. The central dotted red curve is the ‘best’ model based on the weighted mean age.
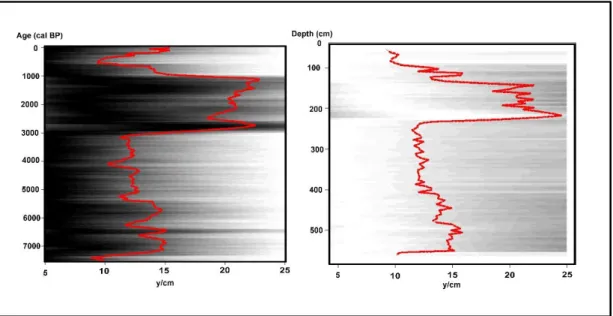
Figure 8. Calculated sedimentation times (yr/cm) (inverse accumulation rate) were estimated from Markov Chain Monte Carlo (MCMC) iterations against age and depth using the Bacon model (red dotted lines: mean values).
Table 4. 12 AMS data from undisturbing core sequence of the Round Lake.
Lab Code Material Depth (cm)
14C Age yr
(BP) ± cal yr
BP ± AD/BC Years DeA-11893 charcoal 59 230 21 227 72 1643–1799 AD D-AMS 015575 charcoal 100 566 22 584 53 1303–1419 AD
DeA-13155 peat 140 1084 24 998 34 894–1013 AD
DeA-11892 peat 199 1869 26 1799 74 77–222 AD
DeA-11891 peat 211 2528 25 2621 123 794–547 BC DeA-12029 peat 231 2947 28 3089 86 1054–1226 BC D-AMS 015574 peat 236 3015 26 3207 127 1131–1385 BC DeA-13157 peat 320 3799 28 4183 53 4283–4090 BC D-AMS 015577 peat 416 4602 28 5269 179 3141–3499 BC DeA-11889 peat 489 5615 31 6386 76 4361–4512 BC DeA-11888 peat 511 5916 33 6742 90 4713–4892 BC D-AMS 015576 peat 560 6575 29 7495 65 5480–5610 BC The 560 cm long sequence involved approximately 7500 cal BP years (5500 cal BC years), Accumulation rates were estimated at the 1-cm resolution along with 95% CI to assess uncertainty, which gave the best result. Prior accumulations rates of 10yr/cm with a gamma distribution of 1.5 shows a good correspondence with and the calculated 12 y/cm. Based on the chronological data and sedimentation rates, four levels of different accumulation rates were detected in the profile covers the last 7500 calendars [8]. In Figure 8, Inverse accumulation rates (sedimentation times expressed as year/cm) were estimated from Markov Chain Monte Carlo (MCMC) iterations, and these rates form the age-depth model. Accordingly, as the sedimentation time increases then the rate of accumulation decreases. It can be seen in the figure that within the different stages there are several SR decreases (AR increases) around 7300 cal BP, 6300 cal BP 4000 and 500 cal BP.
4. Discussion
Figure 8.Calculated sedimentation times (yr/cm) (inverse accumulation rate) were estimated from Markov Chain Monte Carlo (MCMC) iterations against age and depth using the Bacon model (red dotted lines: mean values).
The 560 cm long sequence involved approximately 7500 cal BP years (5500 cal BC years), Accumulation rates were estimated at the 1-cm resolution along with 95% CI to assess un- certainty, which gave the best result. Prior accumulations rates of 10 yr/cm with a gamma distribution of 1.5 shows a good correspondence with and the calculated 12 y/cm. Based on the chronological data and sedimentation rates, four levels of different accumulation rates were detected in the profile covers the last 7500 calendars [8]. In Figure8, Inverse accumula- tion rates (sedimentation times expressed as year/cm) were estimated from Markov Chain Monte Carlo (MCMC) iterations, and these rates form the age-depth model. Accordingly, as the sedimentation time increases then the rate of accumulation decreases. It can be seen in the figure that within the different stages there are several SR decreases (AR increases) around 7300 cal BP, 6300 cal BP 4000 and 500 cal BP.
4. Discussion
The two different sediment records of Round Lake indicate many interesting changes and processes in stratigraphy and geochemistry. In this study, using the elements ex- amined above, we attempted to use environmental proxies that have been accepted in previous studies.
4.1. Factors Affecting the Elemental Composition of the Round Lake
The correlation matrix was calculated for 13 elements from the total section of Round Lake (Table5). A strong positive correlation can be noticed between the elements with inor- ganic mineral origin: Si, Al, K, Ti, Mn, Fe, Zr, Cr, Rb, Sr and between the plant-derived ele- ments: S, P, Ca. Therefore, the elements can be classified into two groups, an allochthonous terrigenous fraction which correlates with the in LOIres content and an autochthonous chemically biogenically deposited fraction which correlate with LOI550 content.
Based on the PCA, the macroscopic description of the samples was correct, thus Troels-Smith [35] categories indicate an unconsolidated sediment environment in the mars- lake-swamp area indeed. The samples of the medieval-modern lake phase, the peat levels and the pelitic layers formed by different degrees of erosion, were excellently separated and reflect clearly the former sedimentary environment (Figure9).
Table 5.Spearman’s rank correlation coefficients matrix between the concentrations of analysed elements. Bold fond shows a significant correlation at the 0.01 level (2-tailed). The underlined correlation coefficients are higher than 0.6.
Al Si P S K Ca Ti Cr Mn Fe Rb Sr
Si 0.913
P −0.513 −0.472
S −0.704 −0.626 0.896
K 0.877 0.967 −0.455 −0.560
Ca −0.456 −0.352 0.905 0.873 −0.325
Ti 0.844 0.946 −0.448 −0.567 0.965 −0.310
Cr 0.787 0.766 −0.324 −0.446 0.788 −0.243 0.777
Mn 0.683 0.798 −0.417 −0.528 0.794 −0.270 0.855 0.604
Fe 0.777 0.759 −0.339 −0.558 0.712 −0.234 0.661 0.679 0.568
Rb 0.932 0.911 −0.602 −0.746 0.901 −0.520 0.857 0.775 0.679 0.816
Sr 0.710 0.879 −0.360 −0.482 0.861 −0.178 0.867 0.607 0.768 0.678 0.764
Zr 0.897 0.925 −0.616 −0.780 0.880 −0.516 0.883 0.712 0.747 0.771 0.952 0.819
Quaternary 2021, 4, x FOR PEER REVIEW 16 of 32
Figure 9. Principal components analysis (PCA) biplot of selected environmental variables and samples with Troels-Smith [35] categories (1. laminated lacustrine mud, 2. calcareous pelitic peat, 3. herbaceous peat, 4. moss peat).
Figure 9 demonstrates that PCA1 has the greatest positive loadings with minerogenic -binding elements, MS and coarse particle size. Therefore, this refers to mineral sediment input from soil and rock erosion. At the same time, PCA1 has four significant negative weights for, LOI550, LOI950 and the finer fractions (fine silt, clay). PC2 has a high positive loading of P, S, Ca. All this indicates that LOI550 binds to organic matter (P, S), and a similar direction of Ca, fine particles and LOI 950 may indicate the local plant origin of carbonate. The figure shows the 95% CI ellipses associated with the data of the 4 litholog- ical groups (1. laminated lacustrine mud, 2. calcareous pelitic peat, 3. herbaceous peat, 4.
moss peat). Ellipses 3 and 4 overlaps well, 1 is connected to the lake sediments which are separate and represent only the upper 1 m.
4.2. Major and Trace Element Distribution
The P, S are tightly bound to the LOI550 (Figure S1) and their concentration profiles have similar trends. The P, S are tightly bound to the LOI550 (Figure S1) and their concen- tration profiles have similar trends. Ca follows P and S with a similar trend. They show a relatively low concentration at the bottom of the peat section between 560–450 cm except for two peaks at 560 cm and at the border of Tb3As1 and Th3As1layer between 500–510 cm. They reached the highest concentration between 400 and 300 cm. In this section the peat composition is various and there are several significant peaks (394–400 cm, 380–385 cm, 355–360 cm 255–260 cm) which is the same for all three biogenic elements. In the geo- chemical transition zone (198–100 cm), the concentration of these three elements de- creased. Between 104 and 115 cm, there is a significant peak in P and Ca concentration which coincidence the water table level (at 104 cm). In the Lake phase (0–104 cm) the P and S fell below the detection limit therefore they were not traceable, and the Ca shows the lowest concentration (0.5%–0.8%) here.
It is conspicuous that both LOI550 and LOI950 decreased in parallel with the increase of LOIres. LOI950 does not appear to be related to surface erosion, it is more likely that Figure 9. Principal components analysis (PCA) biplot of selected environmental variables and
samples with Troels-Smith [35] categories (1. laminated lacustrine mud, 2. calcareous pelitic peat, 3. herbaceous peat, 4. moss peat).
Figure9demonstrates that PCA1 has the greatest positive loadings with minerogenic -binding elements, MS and coarse particle size. Therefore, this refers to mineral sediment input from soil and rock erosion. At the same time, PCA1 has four significant negative weights for, LOI550, LOI950 and the finer fractions (fine silt, clay). PC2 has a high positive loading of P, S, Ca. All this indicates that LOI550 binds to organic matter (P, S), and a similar direction of Ca, fine particles and LOI 950 may indicate the local plant origin of carbonate.
The figure shows the 95% CI ellipses associated with the data of the 4 lithological groups (1. laminated lacustrine mud, 2. calcareous pelitic peat, 3. herbaceous peat, 4. moss peat).
Ellipses 3 and 4 overlaps well, 1 is connected to the lake sediments which are separate and represent only the upper 1 m.
4.2. Major and Trace Element Distribution
The P, S are tightly bound to the LOI550 (Figure S1) and their concentration profiles have similar trends. The P, S are tightly bound to the LOI550 (Figure S1) and their con- centration profiles have similar trends. Ca follows P and S with a similar trend. They show a relatively low concentration at the bottom of the peat section between 560–450 cm except for two peaks at 560 cm and at the border of Tb3As1 and Th3As1layer between 500–510 cm. They reached the highest concentration between 400 and 300 cm. In this section the peat composition is various and there are several significant peaks (394–400 cm, 380–385 cm, 355–360 cm 255–260 cm) which is the same for all three biogenic elements. In the geochemical transition zone (198–100 cm), the concentration of these three elements decreased. Between 104 and 115 cm, there is a significant peak in P and Ca concentration which coincidence the water table level (at 104 cm). In the Lake phase (0–104 cm) the P and S fell below the detection limit therefore they were not traceable, and the Ca shows the lowest concentration (0.5%–0.8%) here.
It is conspicuous that both LOI550 and LOI950 decreased in parallel with the increase of LOIres. LOI950 does not appear to be related to surface erosion, it is more likely that the wall of the catchment basin was formed by Miocene marine calcareous marl where the carbonate originated from. Furthermore, Ca is a well-known biophilic element [81].
The terrigenous, mineral-derived elements in the peat section (560–198 cm) show a similar distribution trend, while, from the level of the geochemical transition zone (198 cm), they show different fluctuations. Between 560–450 cm the elements remain low (Si 5%, K 0.2%, Al 2%) but above the Tb3As1 layer (−500–490 cm) there is a sharp peak, similar with biogenic elements. The highest LOI550 and plant composition in the peat section (between 450–325 cm) have several significant peaks. The double peak between 392–362 cm coincides with the Th2Lc1As1 levels where the sand fraction also appears (Figure S1 and Figure4). In the transition zone, there is a double peak between 190–210 cm and a sharp peak between 150–160 cm which correlates with the organic elements (P, S, Ca). At the water table level, all three elements drop due to diluting. This decline can also be traced in the fine-grained sediment. In the lake phase Si, K, Al, graphs are similar in the whole section. They maintain the same level (Si 27%, Al 7%, K 1,7%) no significant fluctuations were observed.
The Ti, Zr, Cr concentration are decreasing with depth. In the peat and transition zone, their distribution is parallel with other inorganic elements. Cr shows a different trend in the transition phase than the other mineral elements. There is no significant peak like Ti, Zr in the Lc1Th1As2 layer (between 150–160 cm), its concentration ranges from 90 to 120 ppm. In the Lake phase the three elements drop in the water table level, in the upper 80 cm maintain in the same level (Ti 550 ppm, Zr 160 ppm, Cr 107 ppm).
In the peat phase, between 560 and 280 cm, the Fe content is below 4%. At this stage, the LOI550 content is over 75%. Significant peaks are found between 500–490 cm and coincide with the appearance of Th2Lc1As2 layers where a coarse-grained fraction appears.
In the lake phase, the iron (Fe) content is stable between 4%–6%, falling only at the water level (104 cm).
Mn is stable throughout the peat layer, falling to 6 ppm between 506–502 cm at the top of the Tb3As1 layer. From the transition phase (Lc1Th1As2), Mn increase from 40 ppm to 350 ppm. In the lake phase, the highest values of Mn can be detected above the water level (500–350 ppm).
As Rb can bind to potassium [82], its trend is very similar. In contrast, Sr binds to Ca-containing minerals [82], but a significant correlation was detected between them. The two elements Sr Rb are similar in the mire phase, while they differ in the lake phase. In the peat phase, Rb and Sr increase continuously from bottom to top, with significant peaks coinciding with other minerogens. At the water table level Rb drops significantly, Sr shows no significant change. Rb is stable in the lake phase (100–120 ppm), Sr rises from 80 to 120 ppm towards the surface.
4.3. Comparative Analyses of Geochemical and Pollen Results
Pollen analyses were not performed as a stand-alone study, but to understand the background of the geochemical changes from a perspective of vegetation. It is necessary as climate-induced vegetational changes and the anthropogenic impacts of it can be described more accurately based on pollen analytical data than from a geochemical viewpoint [83–94].
A comparative analysis of the geochemical and pollen analytical samples, converted from the meter scale to the time scale by 12 radiocarbon measurements [8], was performed based on literature [89,90,95,96]. The bases of the comparisons were the works of Willis et al. [88,94,95], and one of our aims was to test the suggestion of Willis et al. [90] about the connection between human impact and erosion levels based on the analysis of a simi- lar mars-lake catchment basin with sedimentological, pollen analytical and geochemical methods. Land degradation is the physical and chemical depletion of the soil resulted from processes such as erosion, acidification, depletion of plant nutrients and reduction of LOI550 content [88,96]. The following palaeoecological phases can be separated on a chronological scale by the comparative analyses of geochemical-pollen analytical data. To make it com- parable with other studies, the relative abundance of the studied elements expressed as concentration of oxides per sediment volume are given in Supplementary Figure S2.
The first geohistorical level formed between 7500–6500 cal BP (Figure10). Inorganic geochemical components of mineral origin show low values at this level, except for Al2O3. It can be connected to the continuous clay deposition from the degradation of the brown forest soil formed under closed deciduous forest (reconstructed based on pollen data (Supplementary Figure S2) [88,95,97,98] in the vicinity of the Round Lake catchment basin.
The Ca content can be related to the effect of the bedrock and the element content of the significant plant phytomass that forms peat [95,99,100]. Elements depend on the organic components in the forms of CaCO3and P2O5, have three maxima in this stage, which show three maxima in biogenic accumulation and peat formation [101,102]. SO3 and MnO2content were also significant in these levels [88,103–105]. Based on the elemental composition, the reductive mire environment can be characterized by rich vegetation, the appearance of Sphagnum plants, negligible element transport and significant water coverage on the surface [88,95,104–107]. In this phase, the catchment basin was dominated by biogenic sediment accumulation and peat formation.
Quaternary 2021, 4, x FOR PEER REVIEW 18 of 32
make it comparable with other studies, the relative abundance of the studied elements expressed as concentration of oxides per sediment volume are given in Supplementary Figure S2.
The first geohistorical level formed between 7500–6500 cal BP (Figure 10). Inorganic geochemical components of mineral origin show low values at this level, except for Al2O3. It can be connected to the continuous clay deposition from the degradation of the brown forest soil formed under closed deciduous forest (reconstructed based on pollen data (Supplementary Figure S2) [88,95,97,98] in the vicinity of the Round Lake catchment basin.
The Ca content can be related to the effect of the bedrock and the element content of the significant plant phytomass that forms peat [95,99,100]. Elements depend on the organic components in the forms of CaCO3 and P2O5, have three maxima in this stage, which show three maxima in biogenic accumulation and peat formation [101,102]. SO3 and MnO2 con- tent were also significant in these levels [88,103–105]. Based on the elemental composition, the reductive mire environment can be characterized by rich vegetation, the appearance of Sphagnum plants, negligible element transport and significant water coverage on the surface [88,95,104–107]. In this phase, the catchment basin was dominated by biogenic sediment accumulation and peat formation.
Figure 10. Summary of palaeovegetation phase and pollen taxa correlated with the Blytt-Sernander system.
Between 6750–6500 cal BP years, the quantity of elements of mineral origin (Al, Si, K, Cr, Rb) increased, and organic components decreased in the erosion phase deposited to the peat level (Figure 10). The proportion of pollen of deciduous woody plants also de-
Figure 10. Summary of palaeovegetation phase and pollen taxa correlated with the Blytt- Sernander system.
Between 6750–6500 cal BP years, the quantity of elements of mineral origin (Al, Si, K, Cr, Rb) increased, and organic components decreased in the erosion phase deposited to the peat level (Figure10). The proportion of pollen of deciduous woody plants also decreased during this period, indicating a decrease in forest cover. The stability of the surface vegetation cover was changed [88,108], which resulted in the leaching of several inorganic components towards the mire. This change was obviously the result of human impact by deforesting the woody plants [88]. In addition to the decrease in the proportion of arboreal elements (Figure S2), and the advance of herbaceous plants, an erosion phase developed in the sediment.
Between 6500–6000 cal BP years, the maximum of the maximum of SO3, MnO2and CaO developed, the proportion of the elements correlated to inorganic sediment and erosion decreased. The proportion of arboreal pollen also increased. These attributes indicate a phase of forest regeneration and the reduction of erosional sediment supply to the Round Lake catchment basin. At this time the mire can be characterized by high water level and intensive biogenic accumulation. This is also supported by the presence of Sphagnum taxa detected at this level [109–111].
Between 6000–4750 cal BP years the quantity of the elements released from the washing in of inorganic sediment increase continuously in parallel with the decrease of the reductive mire environment-indicator elements Fe2O3and MnO2[88,95,104–107]. Arboreal pollen proportion also decreased drastically (Figure S1) in addition to the sharp increase of the proportion of herbaceous pollen. The element content indicating an erosion and degradation of the soils covering the surroundings and the decrease of mire environment- indicator elements suggest another erosion level and vegetation breakdown.
In the subsequently early Bronze Age level (between 4750–4250 cal BP years), the catchment basin is characterized by environmental stability. The erosion-indicator element content was in its average and based on the pollen analysis (Figure S2), the forest environ- ment was regenerated. The continuous peat formation is also confirmed by the presence ofSphagnumremains in the sediment (Tb3As1). The beech pollen maximum in the pollen composition and the appearance of Sphagnum suggested cooler and wetter climate in the terminal phase of Co¸tofen culture in the transition of the early and middle Bronze Age.
Similar cooler and wetter climate phase were detected, based on isotope analyses, in Asia Minor [112] and the Middle East [113] in the same chronological zone.
Sphagnum remains disappeared from the sediment between 4250–4000 cal BP years (Figure10). Sharp changes also can be observed in the pollen material. Arboreal pollen propor- tion (Alnus,Betula,Tilia,Quercus) decreased below 60% (Supplementary Figure S3) [73,74,114–116].
Among herbaceous plants, the proportion of Artemisia, Chenopodicea, Secale, Cyperecea began to increase. Mineral content suddenly dropped, then started to increase for a short time. The in- creased proportion of MnO2indicates oxidative conditions, and the maximum of P2O5suggests decomposition processes-although this may also come from the vicinity of the catchment basin by the intensification of soil leaching [95] (Figure S2). This latter is also indicated by an increase in magnetic susceptibility (Figure4). The changes in the pollen composition, the decrease of arboreal pollen and the appearance of cereals, rye (Secale) among the herbaceous pollens clearly show the agricultural production in the surroundings of the mire.
Geochemical analyses suggest the drying up of the mire environment, which may be related to a global event at 4.3 kyr [117]. The available AMS-based chronological data also support this idea (Table2). Global investigations dated the Meghalayan phase (4250–4050 cal BP/2250–2050 cal BC years), identified in the northeast of India by us- ing isotope analyses on stalagmites, approximately to this chronological-climatic phase.
This climatic event had an extraordinary impact on the high cultures of Africa and Eura- sia [118–120]. In any case, the global dry event of the mentioned Meghalayan phase coincides with the transition of early and middle Bronze Age in the Carpathian Basin.
Based on the archaeological and environmental historical analyses [121–128] it is evident, that human communities respond to environmental impact and crises with cultural and technical transformations and a coincidence can be noted between the dry climate event of
the Meghalayan phase and the transition of early/middle Bronze Age phase. In our cases, this coincidence requires further investigation.
At the next level, between 350–300 cm (4000–3500 cal BP/2000–1500 cal BC years), the pollen proportion of arboreal species ranged between 60%–70%. The closed forest, stabilized at the early Holocene, was replaced by a forest-steppe with loose hornbeam- beech forests, grazed and herbaceous patches [73,74,114–116]. As a result of this loosely structured vegetation cover, erosion became continuous in this stage, identifiable with the Middle Bronze Age. Two smaller stages of mire regeneration also can be detected. The geochemical parameters indicate a constant surface erosion (Figure S1) in parallel with the continuous decrease of arboreal species (Figures S2 and S3), and the strong soil leaching and deposition resulted in the formation of pelitic peat levels.
4.4. Paleoenvironmental Changes during the Past 7500 Years
The distribution of P, S and Ca elements are influenced by the composition of LOI550 and the surrounding vegetation. Even though calcium is originally derived from bedrock, it still correlates better with LOI550. Presumably because Ca is a well-known biophilic element [81] it is essential for growth in plants which could derive from the deciduous tree fallen leaves [83]. It can be noticed that the peaks of the biogenic elements (P, S, Ca) can be found in the middle part of a thicker, homogeneous peat layer. This can be influenced by several factors, including the sedimentation rate, which affects the deposition and depth of the stratum, thus can be related to decomposition and maturation processes. Shifts and fluctuations of geochemical elements can be attributed to plant uptake and transport. Some peaks coincide with elements from the mineral grain. The observed peaks correlate with layer boundaries, indicating the transformation of the mire environment.
The Si, Al, K, Ti are strongly correlated with mineral matter. Si and Al are the most abundant elements in the Earth’s crust and principle constituents of rock-forming minerals.
Potassium is essential to growing plants, therefore it rapidly lost from peats [2].
The Mn and Fe are highly mobile in anoxic environments from very acidic to moder- ately alkaline pH [129–132]. This can be observed in the peat section between 560–150 cm.
In addition, the distribution of Mn can be related to the activity of microbes and can take part in the degradation of organic and inorganic compounds [133–135]. Fe shows no significant change between both oxic and anoxic conditions, while Mn shows the highest concentration above the water table level (104 cm). The distribution of Cr can be controlled by the botanical composition and LOI550. In anoxic conditions, organic compounds can reduce in aqueous solution [7,82]. The highest concentration of Cr was detected between 150–400 cm, and it was not detectable at the bottom of the core section.
4.5. Paleoenvironment Changes from the Aspect of Human Impact
One of our aims was to examine the possibility of reconstructing the productive activity of former cultures and communities [88] by study the erosion development of the catchment basin on the basis of sedimentological, geochemical and pollen analytical results dated by radiocarbon data. By using this method, the agricultural activity and the impact of the civilization on the environment at the level of the given cultures can be reconstructed.
Even though the depth of the Round Lake catchment basin did not reach the depth of the Kis-Mohos, detailed in the works of [88,95], and the sedimentation cannot date back to the end of the Ice Age, comparison can be carried out in the last 7500 calendar years. It must be noted that archaeological database on the topographic survey of sites in the vicinity of Kelemér are not available.
Nonetheless, the following erosion events and mire-forest-regeneration phases could be separated by sedimentological, geochemical and pollen analytical methods, in the undisturbed borehole profile of the Round Lake at Homoródszentpál (Table6).
Previous studies [89,95,108,136] have indicated that increases in the abundance of ele- ments such as Si, Al, K, Rb, Cr, Sr and inorganic material are indicative of both physical and chemical weathering associated with soil erosion. These elements represent silicate miner-
![Figure 7. Bayesian age-depth model using 14 C age tie points and calculated sedimentation rates for sampled intervals using Bacon [60] for core Round Lake at Sânpaul, Romania](https://thumb-eu.123doks.com/thumbv2/9dokorg/967850.57553/12.892.256.830.302.959/figure-bayesian-calculated-sedimentation-sampled-intervals-sânpaul-romania.webp)