QUARTERLY REPORT ON INFLATION
June 2010
2
Published by the Magyar Nemzeti Bank Publisher in charge: Dr András Simon
1850 Budapest, 8–9 Szabadság tér www.mnb.hu
ISSN 1585-0161 (print) ISSN 1418-8716 (online)
1
Act LVIII of 2001 on the Magyar Nemzeti Bank, which entered into effect on 13 July 2001, defines the primary objective of Hungary’s central bank as the achievement and maintenance of price stability. Low inflation allows the economy to function more effectively, contributes to better economic growth over time and helps to moderate cyclical fluctuations in output and employment.
In the inflation targeting system, since August 2005 the Bank has sought to attain price stability by ensuring an inflation rate near the 3% medium-term objective. The Monetary Council, the supreme decision-making body of the Magyar Nemzeti Bank, performs a comprehensive review of the expected development of inflation every three months, in order to establish the monetary conditions consistent with achieving the inflation target. The Council’s decision is the result of careful consideration of a wide range of factors, including an assessment of prospective economic developments, the inflation outlook, money and capital market trends and risks to stability.
In order to provide the public with clear insight into the operation of monetary policy and to enhance transparency, the Bank publishes the information available at the time of making its monetary policy decisions. The Report presents the inflation forecasts prepared by the Monetary Strategy and Economic Analysis and Financial Analysis Departments, as well as the macroeconomic developments underlying these forecasts. The Report is published biannually, with partial updates to the forecasts also prepared twice a year. The forecasts of the Monetary Strategy and Economic Analysis and Financial Analysis Departments are based on certain assumptions. Hence, in producing its forecasts, the Directorate assumes an unchanged monetary and fiscal policy. In respect of economic variables exogenous to monetary policy, the forecasting rules used in previous issues of the Report are applied.
The analyses in this Report were prepared by staff in the MNB’s Monetary Strategy and Economic Analysis and Financial Analysis Departments and Financial Stability Departments under the general direction of Ágnes Csermely, Director. The project was managed by Barnabás Virág, Senior Economist of Monetary Strategy and Economic Analysis, with the help of Viktor Várpalotai. The Report was approved for publication by Ferenc Karvalits, Deputy Governor.
Primary contributors to this Report include: Judit Antal, Gergely Baksay, Péter Bauer, Katalin Bodnár, Mihály Hoffmann, Ágnes Horváth, András Hudecz, Gábor Kiss, Balázs Krusper, Rita Lénárt- Odorán, Zsolt Lovas, Miklós Lukács, Ádám Martonosi, Benedek Nobilis, Gábor Pellényi, Zoltán Reppa, István Schindler, Róbert Szemere, Béla Szörfi, Judit Várhegyi, Timea Várnai. Other contributors to the analyses and forecasts in this Report include various staff members of the Monetary Strategy and Economic Analysis and the Financial Analysis Departments.
The Report incorporates valuable input from the Monetary Council’s comments and suggestions following its meetings on 17 th May and 31 st May 2010. The projections and policy considerations, however, reflect the views of staff in the Monetary Strategy and Economic Analysis and the Financial Analysis Departments and do not necessarily reflect those of the Monetary Council or the MNB.
2 Contants
SUMMARY 3
1.EVALUATION OF MACRO-ECONOMIC DATA 9
1. 1. Steady recovery in global economic activity and strengthening imported inflation effects 10
1. 2. Recession in Hungary that has lasted for nearly two years came to an end 15
1. 3. The external balance adjustment was significant in regional comparison as well 23 1. 4. Increasing unemployment coupled with strong wage growth at industrial companies 27 1. 5. Mounting imported price pressure in inflation developments 31
2.FINANCIAL MARKETS AND LENDING 35
2. 1. Uncertainty about the euro area has increased significantly with deepening of the Greek debt crisis 35
2. 2. Monetary conditions still characterised by low real interest rates and a strengthening real exchange
rate 42
2. 3. Lending to the private sector continues to be very subdued 43
3.INFLATION AND REAL ECONOMY OUTLOOK 51
3. 1. Following the international business activity, the domestic recovery may begin in early 2010 53 3. 2. Persistently high unemployment is expected, despite improving economic activity 58
3. 3. Achieving the inflation target will be delayed, due to strengthening imported inflationary pressure 59
3. 4. Upturn in domestic demand may result in a gradual deterioration in the external balance from 2011 on 61
3. 5. Inflation and growth risks 62
3. 6. Developments in the general government balance 69
3. 7. Items outside general government continue to pose considerable risk 74
3
Summary
The domestic economy began to recover at the beginning of the year, buoyed by robust global activity
The outlook for growth and inflation in Hungary continues to be shaped by the pick-up in global economic activity and the slow recovery in domestic demand. In the conditional forecast, which has been produced on the assumption that the central bank base rate and the exchange rate remain unchanged at the April levels (5.25% and EUR/HUF 265.4, respectively), the strong expansion of exports and faster corporate stockbuilding may be able to offset the decline in consumption in 2010 and, consequently, the recession in Hungary may end this year. The economy is expected to grow at rates above 3% over the next two years, with the pick-up in domestic demand making an increasingly positive contribution. Despite the sharp increase in capacity utilisation, however, output is likely to remain below its potential level over the entire forecast period.
Inflation may settle around the target over the medium term
This year, the downward pressure on prices from weak domestic demand will be counterbalanced by the increase in energy prices stemming from global activity growth and depreciation of the euro.
As a result, inflation is only expected to reach the Bank’s 3% target in 2011. An upswing in domestic demand and higher imported inflation are likely to hinder a further decline in inflation in 2012, as also reflected in the upward path in core inflation.
The country’s external financing capacity may remain positive over a longer period
While the slow recovery in consumption points to higher import demand, stronger external demand may partly offset the negative impact on the external balance of the pick-up in domestic absorption. Consequently, the trade balance may be much stronger over the medium term than in previous years. Hungary’s external financing capacity may only begin to fall materially towards the end of the forecast period.
A sharp turnaround in the positive investor sentiment was caused by the spread of uncertainty related to sovereign debt problems and the stability of the euro area
Until mid-April, investor sentiment on the international financial markets was essentially positive, due mainly to the release of positive macro-economic data during the period. There was a material improvement in the assessment of risks associated with the Central and Eastern European countries, including Hungary, as reflected in exchange rate appreciation and a decline in risk premia. As a result, our baseline assumptions include i) a base rate that is below its February level, and ii) a more appreciated EUR/HUF exchange rate.
From mid-April, however, there was a reversal in investor sentiment as the Greek debt crisis widened. Risk premia in euro-area Member States with relatively weaker fiscal positions began to rise first, followed by countries with significant exposures to Greece. After this, concerns about the prospects for the entire euro area soon began to emerge, leading to a sharp decline in general risk appetite.
Even the announcement of a joint EU and IMF emergency package was insufficient to provide much relief. Investors worldwide have recently been closing-out their positions in risky assets.
The buoyant external demand was
The recession in Hungary ended in 2009, with GDP expected to begin growing on a quarterly basis this year, coupled with a likely
4 strengthened by some
temporary factors thus the current strong expansion is surrounded by some sustainability risks
increase in the annual average rate of growth. This turnaround in growth is mainly due to the development of global economic activity.
The robust expansion of demand in Asia is expected to drive up Hungarian exports both directly and indirectly, through rising exports of Hungary’s major European trading partner economies, primarily Germany. The effects of international fiscal stimulus measures and corporate stockbuilding also turned out stronger than we expected, which improves the short-term outlook for Hungarian exports as well. Due to mounting concerns about fiscal sustainability at the international level, however, countries are expected to make greater efforts to adjust their fiscal positions over the medium term.
Consequently, the current strong expansion in external demand is unlikely to be sustained over the medium term.
Domestic demand may pick up from 2011 onwards
Recent data suggest a somewhat more robust picture of household consumption growth than we previously expected. The reduction in macroeconomic uncertainty in recent months, the sharp correction in the money and capital markets over the past few quarters and the decline in real interest rates to low levels all may have been contributing factors. Nevertheless, the sector’s income prospects, persistently high unemployment and the banking sector’s much more subdued lending activity suggest that consumption will remain relatively low over the short run. Consequently, household consumption expenditure is expected to be significantly lower this year than in 2009. The recovery in consumption as an effect of rising incomes is only expected to contribute to domestic economic activity after 2011, which is likely to be supported by the banking system’s increased willingness to lend.
Gross corporate capital formation is expected to increase this year, closely related to faster-than-anticipated stockbuilding and several large investment projects. By contrast, demand in the household sector is likely to continue declining sharply in 2010. On balance, therefore, whole-economy investment is only expected to pick up materially in 2011.
Economic growth is not accompanied by a sharp fall in
unemployment, and thus labour market conditions may remain loose
During the downturn, companies retained their workforce at higher levels relative to actual demand conditions, in order to minimise the costs of hiring and firing. Consequently, and probably also because of the anticipated increase in labour productivity, the economic upturn is unlikely to initially be accompanied by employment growth on a similar order of magnitude. The number of private sector employees is only expected to start rising slowly in 2011, with unemployment likely to remain high over the entire forecast period.
Hence, the stronger-than-expected pick-up in activity and higher inflation are unlikely to be associated with a significantly faster rise in private sector earnings over the period to the end of 2011, owing to the loose labour market conditions. The wedge between domestic and external demand growth is expected to lead to differences between sectors in the labour market as well: wage inflation and employment growth in manufacturing are expected to pick up earlier than in market services.
5 The decline in lending
to companies may come to an end this year, but tighter lending conditions for households are expected to persist over the longer term
Lending to the private sector continues to be very subdued. Bank credit to the corporate sector has fallen sharply, but the rate of decline has slowed compared with the previous two quarters. Banks plan to increase their outstanding lending to companies significantly this year, which may be a sign of an imminent turnaround. Due to the tight lending standards, however, the range of companies with good creditworthiness is very narrow, and so far there are few signs that credit standards will ease over the near term. The household sector is increasingly a net repayer of debt, and it seems likely that the decline in lending to households will be protracted. One positive development, however, is that forint loans as a percentage of total new lending have been rising recently.
Inflation may reach the 3% target in 2011, due to subdued domestic demand and the impact of higher energy prices, which are being driven up by global economic activity
The outlook for inflation is shaped by rising global economic activity and the prolonged weakness in domestic demand. The disinflationary effect of the negative output gap is likely to remain in 2010, as reflected most markedly in the components of core inflation. On the other hand, energy price inflation, which is driven by rising global activity, and administered price increases are exerting upward pressure on inflation over the short term. As a result, the CPI index is likely to remain close to 4% in the second half of 2010, even after the effects of the increase in indirect taxes drops out of the index.
Despite the recessionary environment seen in recent years, achievement of the inflation target will be delayed.
Core inflation, and particularly services inflation, may fall to a historic low by the end of this year. Weak domestic demand and loose labour market conditions are conducive to low inflation. Although output will remain below potential over the entire forecast horizon, core inflation will begin rising gradually from 2011 as domestic demand picks up. All in all, over the horizon relevant for monetary policy headline inflation is likely to settle near the 3% target.
Risks to inflation are on the upside, while those to growth on the downside
In terms of the real economic forecast, the development of external demand represents the most important risk. The sharp rise in external demand in recent quarters has occurred in conjunction with a significant build-up of government debt in developed countries. As investors have started to pay increasing attention to the sustainability of debt paths in their decisions in recent months, fiscal adjustment measures may be necessary even in the near term. This would affect Hungary’s growth prospects negatively, while at the same time presumably dampening imported inflationary pressure.
The currently high level of inflation expectations, however, continues to pose an upside risk to the inflation outlook. Slow adjustment of expectations may again translate into an acceleration in inflation as the economic recovery gathers speed. In respect of the longer-term outlook for inflation, upside risks stem the possible downward bias in our oil price assumption, coupled with its overall weak predictive power. On balance, risks to external demand represent a downside risk to growth from 2011, while there are strong upward risks in relation to the baseline projection for inflation.
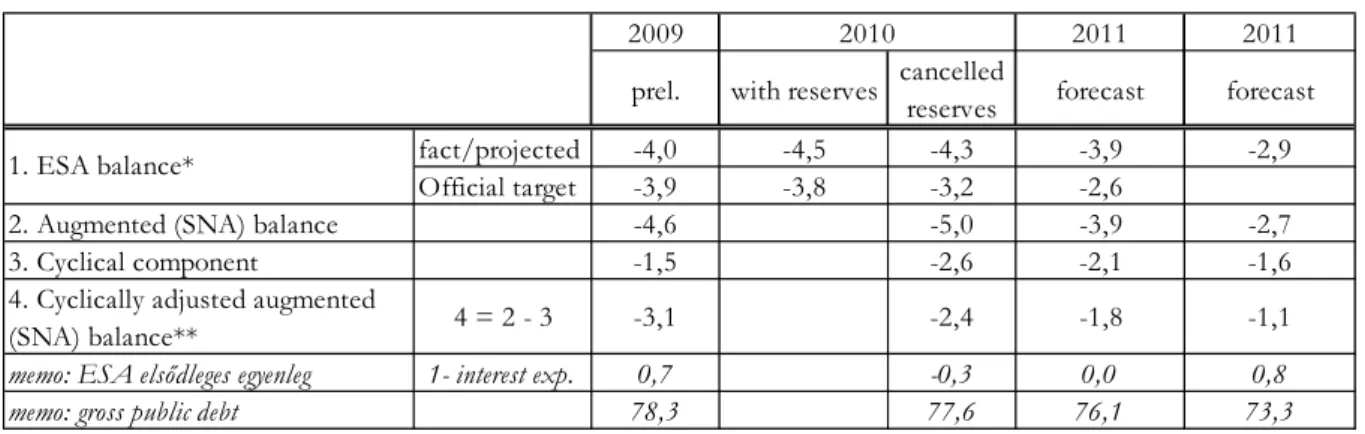
6 Rising government
revenue due to the pick-up in economic activity may result in a downward path for the deficit from 2011
According to our fiscal projection, based on the actual fiscal law and some technical assumptions for 2011-2012, higher-than-planned government expenditure and revenue shortfalls are likely to contribute to the deficit exceeding the official target by more than 0.5 percentage point in 2010. Looking forward, assuming no policy change, the government deficit is expected to fall from 2011, supported by rising revenue as the output gap closes and based on savings expected from a modest increase in expenditure, the cyclical improvement in local government balance and falling interest payments. Structural pressures in the government budget, partly related to quasi-fiscal activities, continue to pose significant risks.
Managing these pressures may lead to a higher deficit even over the short term. Public sector debt may stagnate this year, followed by a slow decline from 2011.
Chart 1: Inflation projection fan chart
-3 -2 -1 0 1 2 3 4 5 6 7 8 9
-3 -2 -1 0 1 2 3 4 5 6 7 8 9
07 Q1 07 Q2 07 Q3 07 Q4 08 Q1 08 Q2 08 Q3 08 Q4 09 Q1 09 Q2 09 Q3 09 Q4 10 Q1 10 Q2 10 Q3 10 Q4 11 Q1 11 Q2 11 Q3 11 Q4 12 Q1 12 Q2 12 Q3 12 Q4
Per cent Per cent
7
Chart 2: GDP projection fan chart (seasonally adjusted, reconciled data)
-8 -7 -6 -5 -4 -3 -2 -1 0 1 2 3 4 5 6
-8 -7 -6 -5 -4 -3 -2 -1 0 1 2 3 4 5 6
07 Q1 07 Q2 07 Q3 07 Q4 08 Q1 08 Q2 08 Q3 08 Q4 09 Q1 09 Q2 09 Q3 09 Q4 10 Q1 10 Q2 10 Q3 10 Q4 11 Q1 11 Q2 11 Q3 11 Q4 12 Q1 12 Q2 12 Q3 12 Q4
Per cent Per cent
8
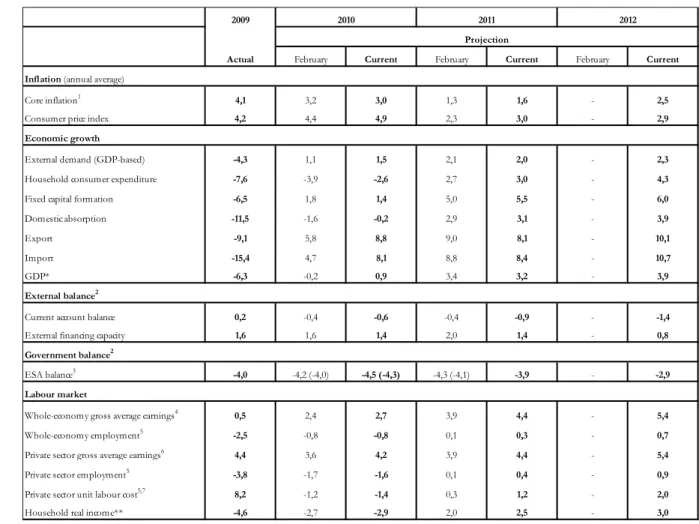
Summary table of baseline scenario
2009 2010 2011 2012
Actual Projection
Inlation (annual average)
Core inflation1 4,1 3,0 1,6 2,5
Consumer price index 4,2 4,9 3,0 2,9
Economic growth
External demand (GDP based) -4,3 1,5 2,0 2,3
Household consumption expenditure -7,6 -2,6 3,0 4,3
Gross fixed capital formation -6,5 1,4 5,5 6,0
Domestic absorption -11,5 -0,2 3,1 3,9
Export -9,1 8,8 8,1 10,1
Import -15,4 8,1 8,4 10,7
GDP* -6,3 0,9 3,2 3,9
External balance2
Current account balance 0,2 -0,6 -0,9 -1,4
External financing capacity 1,6 1,4 1,4 0,8
Government balance2
ESA balance3 -4,0 -4,5 (-4,3) -3,9 -2,9
Labour market
Whole-economy gross average earnings4 0,5 2,7 4,4 5,4
Whole-economy employment5 -2,5 -0,8 0,3 0,7
Private sector gross average earnings6 4,4 4,2 4,4 5,4
Private sector employment5 -3,8 -1,6 0,4 0,9
Unit labour costs in the private sector5,7 8,2 -1,4 1,2 2,0
Household real income** -4,6 -2,9 2,5 3,0
1From May 2009 on, calculated according to the joint methodology of the CSO and MNB. 2As a percentage of GDP 3The numbers in brackets refer to the deficit achievable in case of total blocking of budgetary reserves. In our forecast we have not taken into consideration any risk from debt assumptions. 4Calculated on a cash-flow basis. 5According to the CSO LFS data. 6According to the original CSO data for full-time employees. 7Private sector unit labour cost calculated with a wage index excluding the effect of whitening and the changed seasonality of bonuses.
* Data are not adjusted for calendar effects.
** MNB estimate.
(The forecasts are conditional: the baseline scenario represents the most probable scenario, which applies only if the assumptions presented in Chapter 3 materialise; unless otherwise indicated, it
represents percentage changes on the previus year.)
9
1. Evaluation of macro-economic data
The steady improvement in external economic activity is increasingly beneficial to the domestic export sector as well The improvement in the global economic activity observed since the middle of last year has continued in recent quarters. Although domestic demand in developed economies has continued to be extremely subdued, the dynamic increase in the demand of the Asian region has resulted in a stronger-than-expected recovery in foreign trade. The more robust external environment has also had a favourable impact on developments in domestic growth, and as a result domestic economic activity began to recover from the recession at the beginning of this year, lagging behind the global and regional trends. While external demand has been dynamic, domestic demand has remained weak.
Consequently, the heterogeneity characterising recent years may remain in 2010.
Chart 1-1 Euro area growth and the IFO confidence index (seasonally adjusted data)
The structure of domestic GDP growth in recent quarters diverged from our previous expectations.
The key components of domestic demand developed more favourably than projected in our short- term forecasts. Despite the persistently weak labour market environment and subdued lending activity, household consumption is restraining the development of domestic growth less and less. The smaller decline in consumption may be attributable to a correction in consumption–savings behaviour, which changed drastically during the crisis. Corporate and household investment activity remained subdued in recent quarters, with significant new investments only occurring in the government sector, primarily financed from EU funds. In line with the increase in demand – following the slump at the end of last year – inventories in the economy may have considerably increased at the beginning of this year.
The Hungarian export sector is also increasingly benefiting from the revival in external economic activity, and this – coupled with unchanged weak import demand and improvement in the terms of trade – has resulted in a substantial trade surplus in recent months as well.
-60 -50 -40 -30 -20 -10 0 10 20 30 40
-3,0 -2,5 -2,0 -1,5 -1,0 -0,5 0,0 0,5 1,0 1,5 2,0
00 Q2 01 Q1 01 Q4 02 Q3 03 Q2 04 Q1 04 Q4 05 Q3 06 Q2 07 Q1 07 Q4 08 Q3 09 Q2 10 Q1 Balance
per cent (quarterly change)
Final consumption GFCF
Changes in inventories Net exports
GDP quarterly growth IFO expectations (right scale) 2010. April-May average
10
Chart 1-2 Contributions of the main absorption items to changes in GDP
Labour market developments continue to be determined by companies’ adjustment to the unfavourable profit situation. Towards the end of last year a decline in layoffs was observed in the competitive sector, while the diverging trends observed in the real economy resulted in substantial differences in wage developments as well. A slowdown in wage growth is especially typical in the domestic services sectors, whereas improving sales results have already been reflected in the acceleration of wages in manufacturing.
Developments in inflation continue to be determined by the dual trends of the price-reducing effect of weak demand and the government’s indirect tax measures on the one hand, and strengthening imported inflation on the other. In spite of the significant economic downturn, the annual inflation rate was around 6 per cent at the beginning of the year, i.e. higher than the medium-term inflation target. At the same time, in line with weak domestic demand, loose labour market conditions and the forint exchange rate, which was stable in recent months, our indicators characterising the inflation trend continue to indicate historically low levels.
1. 1. Steady recovery in global economic activity and strengthening imported inflation effects
Since the turning point in mid-2009, the recovery in global economic activity has been unbroken in the past quarters. Along with the increase in key international confidence indicators, this steady pick- up has also been clearly observed in production data as well.
One of the most important factors behind this upswing was the implementation of fiscal measures to boost demand. Although these programmes have come to an end in some economies, their positive impact is still being felt in the first half of this year still. As a steep, immediate fall in demand has been observed in the countries where these programmes have already ended, e.g. the German vehicle scrapping scheme, with the gradual fading out of the programmes that are currently still in effect we can expect to see a similar decline in demand in all developed economies in the second half of the year.
-20 -15 -10 -5 0 5 10 15
-20 -15 -10 -5 0 5 10 15
01 Q1 01 Q3 02 Q1 02 Q3 03 Q1 03 Q3 04 Q1 04 Q3 05 Q1 05 Q3 06 Q1 06 Q3 07 Q1 07 Q3 08 Q1 08 Q3 09 Q1 09 Q3 10 Q1 % (Annual change)
% (Annual change)
Households' consumption Government consumption
Gross fixed capital formation Inventories and statistical discrepancies
Net exports GDP growth
11
Chart 1-3 New car registrations in Europe
Source: www.acea.be
In addition to the fiscal economic stimulation packages introduced in developed economies, the demand of Asian and developing – mostly raw material exporting – economies, which is expanding dynamically again, also contributed significantly to the recovery in world trade in recent quarters. By the beginning of this year, exports to the aforementioned regions reached or even exceeded the levels typical of the pre-crisis years. The pick-up in foreign trade with Asia improves the growth prospects of the Hungarian export sector directly and indirectly as well. The indirect channel is the increase in the exports of the euro-area economies, mainly Germany, which account for a substantial share of Hungary’s export sales. This was also facilitated by the depreciation of the exchange rate of the euro against the US dollar, which was typical of the past quarters, and the improvement in the price competitiveness of the euro area also stimulates the exports of Hungary and the region via supplier relations.
Box 1-1 Possible effects of the euro effective exchange rate on domestic activity
The exchange rate of the euro has shown significant fluctuations since the outset of the international financial crisis. In 2008 H2, the euro depreciated by nearly 24 per cent against the US dollar, which played the role of a ‘safe haven’ currency in the period of greatest uncertainty. As the crisis faded, the euro appreciated gradually, before depreciating strongly again in 2010 H1, as a result of the uncertainties related to Greek government debt.
In the past, the performance of euro-area exporters tracked changes in the exchange rate with a delay of several quarters. Accordingly, depreciation of the euro (and its predecessors) was typically coupled with an increase in export market share. The weakening euro may also allow European companies to gain market shares in those Asian markets which are recovering from the crisis most dynamically. As most Hungarian exporters are suppliers of export-oriented Western European companies, changes in the exchange rate of the euro may have a substantial effect on domestic business activity as well. This box attempts to quantify this effect.
-30 -20 -10 0 10 20 30
-30 -20 -10 0 10 20 30
Jan.06 Apr.06 July.06 Oct.06 Jan.07 Apr.07 July.07 Oct.07 Jan.08 Apr.08 July.08 Oct.08 Jan.09 Apr.09 July.09 Oct.09 Jan.10 Apr.10 Annual change (percent)
Growth contribution (percentage point)
Germany Other EU27 EU 27 (right scale)
12
Chart 1-4 Euro exchange rate and the global market share of euro-area exports*
* Global market share = goods exports volume of the euro area / goods imports volume of the world (source: CPB Netherlands). The source of the nominal effective exchange rate data is the ECB.
The direct impact of the effective exchange rate of the euro, and of the EUR/USD cross rate in particular, on Hungarian exports may be small, because more than 80 per cent of exports is settled in euro.1 The USD exchange rate may only directly affect the sales revenues of a few sectors (e.g. the pharmaceutical industry). The indirect effects, however, may be more significant. First, depreciation of the euro improves the price competitiveness of euro-area exporters, which may generate demand for their Hungarian suppliers as well. Second, the export-driven GDP growth of the euro area means market expansion for all Hungarian exporters. Finally, this may somewhat be offset by the fact that inflation in the euro area may increase with depreciation of the euro, to which the common monetary policy may react with an interest rate hike.
In order to assess the indirect effects of the euro exchange rate on the Hungarian economy, we first need to study how the exchange rate of the euro affects growth and inflation in the euro area, because these are particularly important exogenous factors for domestic business activity. An ECB analysis prepared in 20082 used several methods to examine how the exchange rate influences euro-area macroeconomic developments. In addition to using the dynamic general equilibrium Area Wide Model (AWM), they also carried out simulations with a Global VAR (GVAR) model, which took account of the interactions of 26 countries and regions. Furthermore, the study3 presenting the OECD’s new global macro model also simulates the international effects of euro depreciation. These models present the effect of the exchange rate shock with the historically usual reaction of monetary policy. In addition, with the NiGEM international macro model we simulated an exchange rate shock,
1 Goldberg, L. S. – Tille, C. (2008): Vehicle Currency Use in International Trade, Journal of International Economics, 76 (2), 177-192 (December).
2 Di Mauro, F. – Rüffer, R. – Bunda, I. (2008): The Changing Role of the Exchange Rate in a Globalised Economy, European Central Bank, Occasional Papers No. 94 (September).
3 Hervé, K. – Pain, N. – Richardson, P. – Sédillot, F. – Beffy, P. (2010): The OECD’s New Global Model, OECD Economics Department, Working Paper No. 768, ECO/WKP (2010) 24 (May).
-8 -6 -4 -2 0 2 4 6
-20 -15 -10 -5 0 5 10 15
95 Q1 95 Q4 96 Q3 97 Q2 98 Q1 98 Q4 99 Q3 00 Q2 01 Q1 01 Q4 02 Q3 03 Q2 04 Q1 04 Q4 05 Q3 06 Q2 07 Q1 07 Q4 08 Q3 09 Q2 10 Q1 Annual change (percent)
Annual change (percent)
Global market share of the exports of the euro area Euro exchange rate
depreciation April-May
average
13
the inflationary effects of which monetary policy does not react to. The underlying motive may be that with the current weak demand conditions inflationary pressure is low in the euro area.
Table 1-1 The impulse response of selected macro variables of the euro area to a 10 per cent depreciation in the nominal effective exchange rate of the euro
(percentage deviation from the baseline scenario after 1/2/3 years)
A permanent 10 per cent depreciation of the euro increases the levels of GDP and prices in all three models. In terms of magnitude, the impulse responses of the AWM and the GVAR are similar, while the reaction in GDP is stronger in the OECD model. For lack of monetary policy tightening, much stronger impulse responses result from the NiGEM simulation.
In the following, the DELPHI model (see related Box) is used to examine how the change in the growth and inflation environment of the euro area affects the Hungarian economy. External demand, euro-area inflation and the EUR/USD exchange rate are exogenous variables for us, the shocks of which are calculated from the results of the above simulations.
Chart 1-5 Impulse response of selected macro variables of the Hungarian economy to a 10 per cent depreciation in the nominal effective exchange rate of the euro
GDP (level) Inflation (year-on-year)
Note: The impulse responses show the deviation from the basic forecast of the DELPHI model. The shocks of the exogenous variables of the DELPHI model were derived from several types of models (AWM, GVAR, NiGEM and OECD).
The model simulations suggest that fluctuations in the EUR/USD exchange rate may have a significant effect on domestic economic activity, primarily through the performance of the export sector as a supplier to the euro area. Depreciation of the euro, however, raises inflation, mainly through the price of oil, which in turn reduces households’ real income and hinders consumption. On the whole, assuming a stable EUR/HUF exchange rate, a 10 per cent depreciation in the effective exchange rate of the euro may raise Hungarian GDP growth by 0.2-0.3 percentage points on average over a period of 2-3 years.
Although there have been substantial exchange rate movements in both directions in recent months, on balance the euro has depreciated since the outbreak of the global crisis. The level of the EUR/USD exchange rate assumed over our projection horizon is nearly 5 per cent weaker than the
Model Eurozone GDP Eurozone price AWM (EKB, 2008) 0.2 / 0.6 / 0.9 0.3 / 0.9 / 1.4 GVAR (EKB, 2008) 0.2 / 0.4 / 0.6 0.2 / 0.5 / 1.0
NiGEM 0.5 / 1.1 / 1.3 1.4 / 2.4 / 3.4
OECD (2010) 0.7 / 1.3 / 1.7 0.3 / 0.7 / 1.0
-0,25 0,00 0,25 0,50 0,75 1,00 1,25 1,50
0 1 2 3 4 5 6 7 8 9 10 11 12
Per cent
Quarter
AWM GVAR NIGEM OECD
0,00 0,10 0,20 0,30 0,40 0,50 0,60 0,70 0,80 0,90
0 1 2 3 4 5 6 7 8 9 10 11 12
Percentage point
Quarter
AWM GVAR NIGEM OECD
14
average exchange rate of the previous 12 months. Therefore, assuming a fixed EUR/USD exchange rate, a positive effect on the domestic export sector can be expected, which may be reflected in GDP developments as well. On the other hand, a weaker euro increases inflation mainly through the prices of energy.
Chart 1-6 Changes in the volume of goods imports of the world (seasonally adjusted levels)
Source: CPB Netherlands
The pick-up in global economic activity, especially Asian economic activity, has put global commodity prices back on an upward path again. As a result of EUR/USD exchange rate weakening, the related effects on inflation are especially strongly felt in Europe’s commodity-importing economies. The only exceptions are food prices, where, in view of the anticipation of favourable crop results, no significant increases have been observed for the time being. Overall, however, the rise in commodity prices expressed in euro may result in increasing cost-side inflationary pressure in domestic inflation as well.
70 75 80 85 90 95 100 105 110
70 75 80 85 90 95 100 105 110
Jan.08 Feb.08 Mar.08 Apr.08 May.08 June.08 July.08 Aug.08 Sept.08 Oct.08 Nov.08 Dec.08 Jan.09 Feb.09 Mar.09 Apr.09 May.09 June.09 July.09 Aug.09 Sept.09 Oct.09 Nov.09 Dec.09 Jan.10 Feb.10 2008. January=100
2008. January=100
World Developed Economies
Developing Economies Asia
15
Chart 1-7 Global commodity prices
1. 2. Recession in Hungary that has lasted for nearly two years came to an end The pick-up in international economic activity had a favourable effect on industrial production of the whole region, including Hungary. Although the recovery of the Hungarian economy followed the regional trends only with a delay, owing to the persistently subdued development of domestic demand and despite the upturn in export sales, the increase in 2010 Q1 can be considered strong even in an international comparison.
Chart 1-8 Economic growth in the region (quarterly changes)
0 50 100 150 200 250 300 350 400 450 500
0 50 100 150 200 250 300 350 400 450 500
Jan.00 July.00 Jan.01 July.01 Jan.02 July.02 Jan.03 July.03 Jan.04 July.04 Jan.05 July.05 Jan.06 July.06 Jan.07 July.07 Jan.08 July.08 Jan.09 July.09 Jan.10
2000=100 2000=100
Food Metal All commodity Petroleum
-8 -7 -6 -5 -4 -3 -2 -1 0 1 2 3 4 5 6
-8 -7 -6 -5 -4 -3 -2 -1 0 1 2 3 4 5 6
04 Q1 04 Q3 05 Q1 05 Q3 06 Q1 06 Q3 07 Q1 07 Q3 08 Q1 08 Q3 09 Q1 09 Q3 10 Q1
Per cent Per cent
Hungary Romania Czech Republic
Poland Slovakia
16
The growth in domestic demand in developed European economies continues to be restrained.
Therefore, the dynamic expansion of regional export sales typical of recent quarters is mainly related to supplier activities for the exports of Hungary’s main trading partners. At the same time, it is worth mentioning that in the case of Hungary the increase in demand in Asia does not only appear through indirect relations, but also in a direct manner. As a result of the dynamic growth in exports to Asia in the past half year, Hungary’s share of Asian markets increased in a unique way in the region, albeit from a low level. Over the short run, a gradual fading out of the European fiscal demand-stimulating programmes is expected. However, with the more depreciated euro/dollar exchange rate, the resulting negative effects may be offset by the growing Asian trade of Hungary’s main export partners, including Germany in particular. Accordingly, all in all, the external demand environment may be more favourable than our earlier expectations in the coming quarters as well, which is also expected to be increasingly beneficial for the domestic industry through supplier relations.
Chart 1-9 Exports of the countries of the region to Asia as a percentage of their total exports
As opposed to companies producing for export, the output of the main sectors producing for the domestic market has continued to decline in recent quarters, albeit at a slower and slower pace. The reasons behind this are still restrained household consumption and investment, and weak corporate willingness to invest. In the first months of this year, however, there have already been some perceptible signs that the turnaround in household consumption may take place sooner than we previously expected, which may also have a favourable impact on the performance of some services subsectors (trade, tourism). Accordingly, in the first quarter the domestic economic recovery may be borne not only by exporting companies, but by improving output in some domestic sectors as well.
Only thefinancial, real estate and other business services sector showed a continuous increase in value added during the crisis period. This phenomenon is unmatched in the region, because in parallel with the decline in lending activity and the collapse of the real estate market the performance of this sector declined everywhere, except in Hungary.
1,0 1,5 2,0 2,5 3,0 3,5 4,0
1,0 1,5 2,0 2,5 3,0 3,5 4,0
04 Q1 04 Q2 04 Q3 04 Q4 05 Q1 05 Q2 05 Q3 05 Q4 06 Q1 06 Q2 06 Q3 06 Q4 07 Q1 07 Q2 07 Q3 07 Q4 08 Q1 08 Q2 08 Q3 08 Q4 09 Q1 09 Q2 09 Q3 09 Q4
Percent Per cent
Hungary Czech Republic Slovakia Poland Romania
17
Chart 1-10 Performance of the main sectors in the region (compared to 2008 Q4)
Of the sectors with a lower weight, the value added of agriculture exceeded the average in 2009 as well. But in view of the outstanding harvest results in 2008, the contribution of the sector to the development of domestic GDP was negative last year. The performance of the construction industry declined steadily last year. There were striking differences behind the decline within this sector. While the fall in household and corporate building investment was significant, government investment in infrastructure, which was mostly financed from EU sources, somewhat offset the magnitude of the decline. Data for the first months of 2010 indicate that this trend is continuing. Based on developments in the total number of contracts in the construction industry and housing market indicators (construction of new homes and permits issued), we expect a further sharp fall in household investment over the short run, the negative effects of which may be mitigated by investment based on EU funds and the implementation of some large individual projects.
The substantial differences between the outputs of individual sectors are quite visible in the main use items of GDP as well. Household consumption declined significantly at the end of 2009 as well, but the magnitude of the decline was smaller than we had projected. Based on Q1 retail trade figures, the more favourable consumption path may remain in place in the first half of this year as well, and accordingly the turnaround in household consumption may happen earlier. Considering that the developments in the main economic variables determining household consumption (labour market data, lending activity of financial intermediaries) were in conformity with our expectations, the underlying reason for the more favourable consumption figure must be sought in other factors that influence households’ consumption–savings decisions.
In this regard, factors deserving mention include the decline in general macroeconomic uncertainty, the favourable effects of the strong money and capital market adjustment on households’ financial wealth, the considerable personal income tax reduction at the beginning of the year and the decline in the real interest rate to a low level by the end of last year (see the box below). In line with these effects, households’ rapid balance sheet adjustment observed in the crisis period did not continue in the past quarters. The favourable shift in household consumption demand may have remained typical
-20 -15 -10 -5 0 5 10
CZ HU PL SK RO CZ HU PL SK RO CZ HU PL SK RO CZ HU PL SK RO CZ HU PL SK RO
GDP Industry Construction Retail Financial and real estate services Per cent
till 2009 Q2 till 2009 Q4
18
in the first months of this year as well, although this may still be accompanied by a slight decline in consumption.4
Chart 1-11 The developments in retail sales and consumer confidence indicator
Box 1-2 Main factors determining households’ consumption–savings behaviour during the crisis Remarkable changes have been observed in households’ consumption–savings behaviour since the autumn of 2008. Owing to the labour market adjustment, government measures, the increased uncertainty and developments in bank conditions, from 2008 the household sector, which had produced a rapid increase in debt in 2006 and 2007, was compelled to significantly adjust its earlier consumption path, which was coupled with an increase in the savings rate. At the end of last year, however, the signs observed in the developments in consumption were already more positive than earlier, in spite of the still declining consumption expenditures. This box summarises the changes in the factors that may have had the greatest effect on households’ consumption–savings decisions.
According to our theoretical framework, i.e. the permanent income hypothesis, households reduce their consumption when they foresee a decline in income expected over the long term, and increase consumption when they expect an increase in income. Permanent income may best be approached by stable, predictable incomes, such as labour incomes and cash transfers received from the government.
However, these income elements had already declined in the pre-crisis years as well, and this process intensified in the period following the crisis in line with labour market developments (increasing wage adjustment and unemployment) and government measures (freezing of wages, termination of the 13th-month salaries in the public sector, termination of the 13th-month pension, abandoning the planned pension adjustment etc.). At the same time, the personal income tax reduction at the
4 It is important to note, that there were greater difference between the indicators of household’s consumption in the last quarters than earlier. In 2009 Q4 the difference was significant between the consumption and the retail sales data, while in 2010 Q1 the same phenomenon could be observed between the number of new registrated cars, and the retail sales of cars and car parts. Because of the great uncertainty of the data, our point of view about the household’s consumption- savings decisions are more uncertain.
-80 -70 -60 -50 -40 -30 -20 -10 0 10
-20 -15 -10 -5 0 5 10 15 20 25
Mar.95 Sept.95 Mar.96 Sept.96 Mar.97 Sept.97 Mar.98 Sept.98 Mar.99 Sept.99 Mar.00 Sept.00 Mar.01 Sept.01 Mar.02 Sept.02 Mar.03 Sept.03 Mar.04 Sept.04 Mar.05 Sept.05 Mar.06 Sept.06 Mar.07 Sept.07 Mar.08 Sept.08 Mar.09 Sept.09 Balance
Percent (Annualized monthly change)
Retail sales (moveing average) Retail sales (HP trend) GKI confidence indicies (right scale)
GKI confidence index
HP trend
19
beginning of this year may have had a perceptible positive effect among a wide range of employees.
This may have a positive impact on expectations related to the expected income path as well, which, based on past experiences, become more favourable in the period of parliamentary elections anyway.
In the months of the crisis, income declined with a simultaneous increase in its uncertainty. This stemmed from the increasing riskiness of the real-economic environment (fall in production, increase in unemployment), from money and capital market developments (exchange rate changes, asset prices) as well as from the behaviour of the budget and the banking sector. The developments are well demonstrated by our indicators calculated to quantify uncertainty. By end-2009, however, the uncertainty indicators had fallen back close to the level of the pre-crisis period. All this is in line with the developments in households’ consumption–savings decisions: the motives of precautionary savings strengthened in the period of high uncertainty, but by the end of the year they weakened again.
20
Chart 1-12 Changes in uncertainty indicators5
* MNB estimate
In the first quarters of the crisis, the turbulent money and capital market developments substantially devaluated households’ financial wealth, which may have increased households’ savings initially. As a result of the developments in the last half year (adjustment in stock exchanges, appreciation of the forint exchange rate), however, the decline in households’ net financial wealth was already offset.
Accordingly, the further improvement of the financial situation may have forced households to increase their propensity to save to a smaller extent than in the previous quarters.
Finally, bank conditions may also have influenced households’ behaviour significantly. In the first months of the crisis, owing to the decline in credit supply and the high deposit interest rates in real terms, households reduced their consumption and increased their bank deposits. With the decline in the central bank base rate, the improvement in risk perception and the easing in commercial banks’
dependency on internal sources, however, the net real interest rate attainable on new deposits declined to almost zero, making bank deposits less attractive, which also fosters an increase in consumption expenditures.
5 – MAX: MAX is the quarterly dispersion calculated from the daily data of the index containing domestic bonds with a maturity of over one year. It is related to the shocks to households’ financial wealth, which have a significant impact on consumption–savings decisions.
– EUR/HUF: The quarterly dispersion calculated from the daily EUR/HUF exchange rates. The fluctuations in the instalments of those who borrowed in foreign currency can be approached with it, which influence debtors’ disposable income and thus their consumption decisions as well. In addition, through companies’ exchange rate exposure, it has an indirect effect on households’ income.
– BUX: Quarterly GARCH dispersion indicator calculated on the basis of the daily data of the BUX index. It may be related to the shocks to households’ financial wealth.
– IP: Quarterly GARCH dispersion indicator calculated from the month-on-month increase in industrial production.
– CI7: Question 7 of the confidence indicator survey of GKI, regarding expected developments in unemployment (standardised balance indicator). Expectations regarding the probability of unemployment may measure income prospects and their uncertainty.
-2 -1 0 1 2 3 4 5 6 7
-2 -1 0 1 2 3 4 5 6 7
05 Q1 05 Q4 06 Q3 07 Q2 08 Q1 08 Q4 09 Q3 10 Q2 01 Q1 01 Q4 02 Q3 03 Q2 04 Q1 04 Q4 05 Q3 06 Q2 07 Q1 07 Q4 08 Q3 09 Q2 standard deviation
standard deviation
MAX EURHUF BUX IP CCI7
21
Chart 1-13 Households’ net financial wealth and the net real interest rate
In summary, several factors can be identified that accelerated the adjustment of households’
consumption–savings behaviour in the initial period of the crisis, but have had the opposite effect in recent months.
The decline in whole-economy investment continued to worsen at the end of 2009. In parallel with the still historically low level of capacity utilisation, the sharpest falls continued to be recorded in investment in machinery (primarily by corporations), but in the second half of the year building investment also showed a deepening decline. This latter development is mainly the result of the significant decline in household investment. The tightening of the government housing support scheme in the middle of the year and commercial banks’ subdued lending activity resulted in a strong reduction in the construction of new homes and housing purchases among households. Based on this year’s available housing market indicators, the decline in household investment may continue over the short run as well, while with an increase in external demand – in parallel with a rise in capacity utilisation – the implementation of new investment may already become necessary in manufacturing industries. Government investment financed from EU funds will remain decisive in the coming quarters as well.
-21 -18 -15 -12 -9 -6 -3 0 3 6
85 90 95 100 105 110 115 120 125 130
00 Q1 00 Q2 00 Q3 00 Q4 01 Q1 01 Q2 01 Q3 01 Q4 02 Q1 02 Q2 02 Q3 02 Q4 03 Q1 03 Q2 03 Q3 03 Q4 04 Q1 04 Q2 04 Q3 04 Q4 05 Q1 05 Q2 05 Q3 05 Q4 06 Q1 06 Q2 06 Q3 06 Q4 07 Q1 07 Q2 07 Q3 07 Q4 08 Q1 08 Q2 08 Q3 08 Q4 09 Q1 09 Q2 09 Q3 09 Q4
Per cent Per cent
Net real interest rate Net financial wealth/PDI