1 The original published PDF available in this website:
1
https://onlinelibrary.wiley.com/doi/abs/10.1111/jvs.12738 2
Carbon forms, nutrients and water velocity filter hydrophyte and river-bank species 3
differently: A trait-based study 4
5
Running title: Community assembly of macrophytes in rivers 6
7
Balázs András Lukács 1, Anna E-Vojtkó 2,6#, Tibor Erős 3, Attila Molnár V. 4, Sándor Szabó 5 8
& Lars Götzenberger6 9
10
1 Department of Tisza Research, MTA Centre for Ecological Research-DRI, 4026 Debrecen, 11
Hungary 12
2 University of South Bohemia, České Budĕjovice, Czech Republic 13
3 Department of Zoology, MTA Centre for Ecological Research-DRI, 8270 Tihany, Hungary 14
4 Department of Botany, University of Debrecen, Debrecen, Hungary 15
5 Department of Environmental Sciences, University of Nyiregyhaza, Nyiregyhaza, Hungary 16
6 Institute of Botany, Czech Academy of Sciences, Třeboň, Czech Republic 17
18
Correspondence 19
Balázs András Lukács, Department of Tisza Research, MTA Centre for Ecological Research- 20
DRI, 4026 Debrecen, Hungary 21
Email: lukacs.balazs@okologia.mta.hu 22
23
# Lukács, B.A. and E-Vojtkó, A. should be considered joint first author.
24 25
Funding information: This study was financially supported by National Research, 26
Development and Innovation Office grants (OTKA K104279 to TE, OTKA K108992 to 27
AMV, OTKA KH129520 to BAL, OTKA PD120775 to BAL and OTKA FK127939 to 28
BAL); by TÁMOP-4.2.4.A/2-11/1-2012-0001 ‘National Excellence Program’ to BAL &
29
AMV; by GINOP-2.3.2-15-2016-00019 project to TE; by Bolyai János Research Scholarship 30
of the Hungarian Academy of Sciences to BAL; by UNKP-18-4 New National Excellence 31
Program of the Ministry of Human Capacities to BAL; by GACR 16-15012S from the Czech 32
Science Foundation to LG & AEV.
33 34
2 Abstract
35 36
Questions: The majority of theories of trait-based plant community assembly have been 37
developed and tested predominantly in terrestrial ecosystems. Studies investigating the 38
functional trait composition of aquatic plant communities and their relation to environmental 39
determinants remain scarce. Macrophytes are essential components of aquatic ecosystems, 40
and a more detailed knowledge of their trait-based assembly is crucial for their management.
41
We identified how plant functional traits respond to environmental gradients in streams and 42
rivers.
43
Location: Danube River Catchment, Hungary 44
Methods: We studied the processes governing community assembly along major 45
environmental gradients related to carbon and nutrient limiting factors as well as physical 46
strain. We used six continuous traits (leaf area, specific leaf area, leaf dry matter content, 47
seed weight, seed shape, woodiness) and calculated community weighted mean and 48
standardised effect size of functional diversity for each community. We then used stepwise 49
regression analyses for each trait along the environmental gradients to test which 50
environmental factors explain the changes in community weighted mean and functional 51
diversity. All analyses were conducted for aquatic (hydato-helophyte) and riverbank species 52
separately.
53
Results: We found that the effect of environmental filtering significantly increased toward 54
higher pH, indicating the response of functional traits to carbon limitation. Our results 55
showed trait convergence among riverbank species in rivers with higher productivity. Larger 56
functional diversity (i.e. trait divergence) among hydato-helophyte species suggests an 57
increase in the diversity of resource acquisition strategies under higher productivity.
58
Conclusions: Here we have shown that the functional trait distribution of aquatic and 59
riverbank plant communities respond to major environmental drivers related to nutrient and 60
carbon availability. The understanding of how community assembly mechanisms varied 61
along environmental gradients might be useful when proposing future management and 62
restoration plans and actions towards the conservation of the aquatic vegetation in streams 63
and rivers.
64 65
Keywords: macrophytes, hydrophytes, functional traits, environmental filtering, community 66
assembly 67
3 Introduction
68
There is a growing consensus that trait composition and diversity of communities explain 69
functioning better than species richness per se, because filters operate on the traits of species, 70
rather than on species themselves (McGill, Enquist, Weiher, & Westoby, 2006; Díaz et al., 71
2007). The trait-based approach provides more information about the functioning of species 72
within and across communities, therefore it is a widely used tool to explore community 73
assembly (Götzenberger et al., 2012). Plant community composition in a given site is a result 74
of abiotic and biotic filters including dispersal limitation, environmental suitability and 75
species interactions that determine which traits, and consequently which species, can persist 76
at a site from an available species pool (Weiher & Keddy, 1995). It is generally accepted that 77
on the community scale species coexistence is mainly driven by two distinct non-random 78
processes: environmental filtering and niche differentiation. These community assembly 79
processes are thought to shape the mean, spread and spacing of functional trait values 80
differently within and among communities (Cornwell & Ackerly, 2009).
81
Theoretically, abiotic conditions act as filters selecting on species with the suitable 82
functional traits that can persist in the given habitat. Thus, environmental filtering causes 83
convergence in traits and reduces functional diversity, therefore, species tend to be more 84
similar within a community (Kraft, Valencia, & Ackerly, 2008). Niche differentiation is 85
supposed to prevail on a finer scale, where co-existing species are prevented from being too 86
similar in their resource use strategies (i.e. have small overlap in functional niches), most 87
commonly by competitive exclusion. This process leads to divergent traits and increased 88
functional diversity, supporting the limiting similarity hypothesis (MacArthur & Levins 89
1967, Stubbs & Wilson, 2004).
90
The distribution of aquatic plants in rivers is mainly determined by the prevailing 91
environmental conditions mediated by the surrounding water. The most important factors are 92
water chemical variables (alkalinity, nutrient content) and water physical variables (light, 93
temperature, substrate characteristics, water movements; Riis, Sand-Jensen, & Vestergaard, 94
2000; Lacoul & Freedman, 2006; Bornette & Puijalon, 2011). In river ecosystems 95
environmental variables have a stronger effect on the trait composition of the community 96
than on its species composition (Göthe et al., 2017). There have been only few studies carried 97
out so far that investigated the influence of these environmental factors on the trait 98
distribution of aquatic plant communities. These studies have been limited by the use of 99
categorical traits (e.g. growth forms in Baattrup-Pedersen et al., 2015), studying single 100
environmental factors, or not making use of the complementary framework to study 101
4 community trait means and functional diversity in combination (Göthe et al., 2017). We 102
therefore, have a more detailed knowledge on functional trait responses only along indirect 103
gradients of water depth, soil depth, and water availability gradients (Fu et al., 2014b;
104
Baastrup-Spohr, Sand-Jensen, Nicolajsen, & Bruun, 2015; Rocarpin, Gachet, Metzner, &
105
Saatkamp, 2016). Understanding the functional trait responses of aquatic plants to other 106
relevant environmental variables of lakes and rivers, such as alkalinity, pH, water velocity 107
and trophic conditions, as well as applying a more comprehensive approach regarding trait 108
distributions, would refine our knowledge about the environment driven assembly of these 109
communities (Moor et al., 2017).
110
The aim of this study was to investigate the effect of environmental filtering on the 111
composition of species traits along the above mentioned environmental gradients in a set of 112
aquatic vegetation samples of streams and rivers in the Danube River catchment. The stress- 113
dominance hypothesis predicts that environmental filtering is important under stressful 114
conditions, while competitive interactions will be more important in benign environments 115
(Weiher & Keddy, 1995; Swenson & Enquist, 2007). According to that, we suggest that 116
under nutrient limited and physically harsh conditions plant growth is limited, leading to a 117
change in dominant traits and decrease of trait diversity among co-existing species, but under 118
optimal conditions competition for light and nutrients becomes more intense. While our 119
general aim was to detect the environmental gradients that filter species into local 120
communities, we put forward a number of hypotheses predicting relationships between 121
particular gradients and traits:
122 123
(1) Increased current velocity leads to a selection of species that are more resistant to physical 124
stress through a more resistant structure, such as higher stem woodiness, stronger leaf tissues, 125
and smaller leaf size (Puijalon et al., 2011).
126 127
(2) Submerged aquatic plants obtain carbon for photosynthesis through direct exchange with 128
the surrounding water. In water carbon is available in three main inorganic forms (carbon- 129
dioxide, bicarbonate and carbonate) that are transformed to each other along the pH gradient.
130
Therefore, the availability of carbon changes with different pH levels (Pedersen et al., 2013).
131
As for most plants carbon uptake is most efficient from carbon-dioxide, we hypothesize a 132
convergence in CO2 uptake strategies at lower pH (when this is the only available inorganic 133
carbon form), whereas a higher diversity in traits related to carbon exchange, growth rate and 134
nutrient acquisition with increasing pH (decreasing CO2, increasing HCO3-).
135
5 136
(3) Higher nutrient content in the water as well as in the soil favour a higher number of 137
strategies to exploit these resources (Reich et al., 2003). Therefore, we suggest higher 138
diversity in traits related to nutrient acquisition and growth. At the same time, species in 139
nutrient poor environments are constrained to a smaller range of these strategies.
140 141
(4) Although many aquatic plants have the ability to grow and reproduce clonally, they are 142
still capable of long distance seed dispersal. In running waters, seed size and seed shape 143
potentially determine seed dispersal ability: smaller and lighter seeds, or seeds with non- 144
spherical shapes, being able to spread further (Sousa et al., 2007). We therefore, predict seeds 145
with these characteristics to be dominant in aquatic communities.
146 147
Although our hypotheses concern aquatic plants in running waters in general, we divided the 148
species in the sampled communities into “true” aquatic species (hydato-helophytes) and 149
riverbank species, expecting that some of the postulated relationships will not hold, or do so 150
weaker for the latter group.
151 152
Materials and methods 153
Study sites 154
We selected altogether 48 sampling sites in the Danube River catchment within the Pannon 155
ecoregion, Hungary. Sites were selected using geoinformatic maps in relatively intact 156
catchments in a way that large artificial barriers (e.g. large reservoir dams) do not constrain 157
the dispersal of organisms.
158 159
Environmental variables 160
Site surveys were conducted from July to August 2013, during relatively low water level 161
conditions. In streams, 6‒15 transects (depending on the complexity of the habitat, for details 162
see Erős, Takács, Specziár, Schmera, & Sály, 2017) were placed perpendicularly to the main 163
channel at each sampling site to characterise physical features of the environment. A list of 164
the environmental variables and their descriptive values can be found in Table 1.
165
The sampled lowland and highland rivers and streams can be ordered along a stream size 166
gradient (see Schmera et al., 2017). Orders 1 and 2 refer to lowland and highland rivers 167
respectively, while type 3 and 4 refer to lowland and highland streams respectively. We used 168
the map and typological system of Hungarian running waters to distinguish these four 169
6 different running water types (Ministry of Environment and Water 2004). Stream sites (n = 170
27) were wadeable and had a mean width of 2.8 ± 0.8 m and a mean depth of 34.5 ± 19.1 cm, 171
and a catchment size <1000 km2. Rivers (n = 21) had a mean width of 29.7 ± 32.2 m and a 172
mean depth of 84.6 ± 54.3 cm, and a catchment size >1000 km2. Lowland sites (n = 23) were 173
located between 85 and 180 m a.s.l., and their proportion of coarse substrate was 1.87 ± 3.6 174
%. Highland sites (n = 25) were located between 109 and 261 m a.s.l., and their proportion of 175
coarse substrate was 35.1 ± 19.2 %.
176
Mean width of large rivers was measured using the landscape images from Google 177
Earth, while mean velocity and water depth were measured along the sampling reach at 10–
178
15 points. Visual estimates of percentage substratum cover were assessed following the 179
AQEM protocol (AQEM Consortium, 2002). Conductivity and pH were measured with Hach 180
Lange Q40D (Loveland, Colorado, USA) portable handheld meter, and the content of 181
nitrogen forms (i.e., nitrite, nitrate and ammonium), calcium and phosphate were measured 182
using field kits (Hanna Instruments Ltd, Leighton Buzzard, UK). Total phosphorous was 183
determined by the acid molybdate method (MSZ EN ISO 6878:2004, 2004). Altitude was 184
measured in the field using a GPS device (Garmin Montana 650, Olathe, Kansas, USA).
185 186
Vegetation sampling 187
During macrophyte survey we estimated the abundance of angiosperm and gymnosperm 188
species. All submerged, free floating, amphibious and emerged plants, as well as individuals 189
attached or rooted on parts of the bank substrate were surveyed. Species abundance of 190
macrophytes was estimated visually according to a five-level descriptor scale (1, rare; 2, 191
occasional; 3, frequent; 4, abundant; 5 very abundant) along a 100 m long transect (Kohler, 192
1978). Streams were surveyed by wading the whole stream width; rivers were surveyed by 193
wading along one shore and a grapnel was used to collect plant species from deeper regions.
194
Macrophyte identification was done at the species level. Trees and shrubs were excluded 195
from the analyses to avoid bias by the different life cycle and biomass allocation strategy of 196
woody species. Species were differentiated to real aquatic (i.e. hydato-helophytes, thereafter 197
HH) and river bank species (thereafter RB) according to the Raunkiær’s life-form categories 198
and species moisture index (i.e. Ellenberg’s moisture indicator value adapted to the 199
Hungarian flora: WB; Borhidi, 1993): HH = Hydato-Helophyte life-form; RB= WB > 6 200
(excluding strictly aquatic species).
201 202
Trait selection 203
7 We chose six traits reflecting plant functions and strategies of growth, defence and dispersal 204
capabilities along the various environmental gradients in rivers. The following trait data were 205
obtained from the LEDA database (Knevel, Bekker, Bakker, & Kleyer, 2003; Kleyer et al., 206
2008):
207
(i) Leaf area (LA or leaf size) is strongly related to the energy and water balance of leaves 208
(Cornelissen et al., 2003).
209
(ii) Specific leaf area (SLA, the ratio of leaf area to leaf dry mass) is part of the leaf 210
economics spectrum (LES) and strongly correlated with photosynthetic capacity, relative 211
growth rate, nitrogen content per leaf mass and leaf life span (Reich et al., 1999, Wright et 212
al., 2004).
213
(iii) Leaf dry matter content (LDMC, the ratio of leaf dry mass to leaf fresh mass) reflects the 214
average density of leaf tissues and a trade-off between the investments in structural tissues 215
versus liquid-phase processes. LDMC is a key variable that governs the correlations among 216
the traits in the leaf economics spectrum (LES), which is considered as a ‘hard trait’ (Roche, 217
Díaz-Burlinson, & Gachet, 2004) and usually negatively correlated with relative growth rate 218
(Weiher et al., 1999).
219
(iv) Seed weight (or seed size) is the oven dry mass of a seed. Large seeds are thought to 220
have a better chance to establish seedlings. Seed weight also reflects the reproductive effort 221
of a species; under harsh environmental conditions plants put more effort in stability and 222
vegetative reproduction instead of seeds or produce smaller seeds (Leishmann, Wright, 223
Moles, & Westoby, 2000). Seed weight is also correlated with competition ability (Burke &
224
Grime, 1996).
225
(v) Seed shape is calculated from seed length, width and height (Bekker et al., 1998). Lower 226
values of seed shape reflect more spherical seeds, while higher values reflect needle- and 227
disc-shaped seeds. Seed shape is thought to reflect the dispersal ability of the species and the 228
burial ability of the seeds in the seed-bank. Seed weight and seed shape are good predictors 229
of seed persistence (‘hard trait’) in temperate-zone seed banks (Thompson, Band, &
230
Hodgson, 1993).
231
(vi) Woodiness (or stem specific density) indicates the structural strength of the stem; the 232
durability the plant needs to survive. It also reflects stem defensive ability against pathogens, 233
herbivores or physical damage (See Appendix S1).
234 235
Statistical analyses 236
Functional diversity and community weighted means 237
8 We assessed the functional composition of the studied communities through their functional 238
diversity and community weighted mean (Ricotta and Moretti 2011). Functional diversity 239
was measured as standardised effect size of abundance weighted mean pairwise distances 240
(MPD) between species for each trait (SESMPD), i.e. as a deviation of the observed functional 241
diversity from a null expectation. We used MPD as a measure of functional diversity because 242
it has been shown to be independent of species richness even for low numbers of species (de 243
Bello, Carmona, Lepš, Szava-Kovats, & Pärtel, 2016), which we observed for some of our 244
sampled communities. Standardisation was achieved by randomising the trait data across the 245
species pool 999 times and using the resulting standard deviation of the expected MPD 246
values to standardise the difference between the observed and mean expected MPD, i.e.
247
𝑆𝐸𝑆𝑀𝑃𝐷= (𝑀𝑃𝐷𝑜𝑏𝑠− 𝑚𝑒𝑎𝑛(𝑀𝑃𝐷𝑒𝑥𝑝)) 𝑠𝑑(𝑀𝑃𝐷⁄ 𝑒𝑥𝑝). 248
This allowed us to quantify if the co-existing species were more similar or more dissimilar in 249
their traits than under the null expectation that the species traits are randomly distributed 250
among the species. Positive SESMPD values indicate trait divergence, while negative values 251
indicate trait convergence, as expected under environmental filtering.
252
The community weighted mean expresses the mean trait value of a community 253
emphasising the importance of more abundant species: 𝐶𝑊𝑀 = ∑𝑆𝑖=1𝑝𝑖𝑥𝑖, with S as the 254
number of species in the community, and pi and xi being the relative abundance and trait 255
value of the ith species, respectively.
256
Trait values for SLA, LDMC, LA and seed weight were log transformed before calculating 257
SESMPD and CWM to improve normality.
258
To visualize the relationship between environmental variables for each trait’s 259
functional diversity and community weighted mean, we performed redundancy analyses 260
(RDA) and plotted the results in biplots. We chose RDA over canonical correspondence 261
analyses (CCA), because visual inspection of plots between community trait composition and 262
studied environmental gradients generally indicated linear relationships.
263
We used a stepwise regression approach to select important environmental gradients 264
for each trait’s functional diversity and community weighted mean. Because of shortcomings 265
related to collinearity and to performance of stepwise model selection with high numbers of 266
explanatory variables, we conducted principal component analyses (PCA) for two sets of 267
environmental variables to reduce the number of explanatory variables. The first set 268
contained variables related to the chemical composition of the river water (concentration of 269
nitrite, nitrate, ammonium, calcium, phosphorus, phosphate). We did not consider pH in this 270
9 PCA, as we wanted to retain it as a proxy for carbon dioxide, for which it is directly
271
indicative. It was not strongly related to any of the other chemical parameters (correlation 272
coefficients between -0.07 and 0.42). The second set was composed of the river substrate 273
properties (proportions of marl, silt, sand, fine gravel, coarse gravel, stone, rock). From PCAs 274
of both sets of variables we used the first two PCA axes scores as explanatory variables, 275
together with stream size, pH and water velocity resulting in seven explanatory variables.
276
From full models for each combination of trait, index (SESMPD, CWM) and species pool (HH, 277
RB), variables for the adequate model were selected using AIC as a criterion for retaining 278
variables in the minimum adequate model. This can lead to variables being included, 279
although their estimates are not statistically significant themselves. The R2s of these models 280
gives an indication of the strength of the relationship between the trait variation and the set of 281
selected explanatory variables. Paired t-tests were conducted to reveal differences in SESMPD
282
and CWM between HH and RB species.
283
All analyses were conducted in R version 3.2.4 (R Core Team, 2015), using packages 284
picante (Kembel et al., 2010) and vegan (Oksanen et al., 2017).
285 286 287
Results 288
In total, we obtained trait and abundance data of 155 species in 48 sites (Appendix S1). The 289
median and maximum numbers of species were higher for RB (median = 12, maximum = 44) 290
than for the HH communities (median = 6, maximum = 20). Three samples, which contained 291
only a single species were removed from the community data before conducting further 292
analyses, because functional diversity calculations are not meaningful in this case.
293
Electronic appendix S2–3 shows the PCA plots of water chemical and substrate 294
variables. For the water chemical variables, the first two PCA axis explained 59% of 295
variability in the data. While the first axis was mainly related to nitrate and nitrite, the second 296
axis was related to ammonium and calcium. Phosphorus and phosphate had lower loadings 297
on the first two axes. For the PCA of substrate properties the explained variability of the first 298
two PCA axis was 50%. The first PCA axis related to sandy silt, coarse and fine gravel, while 299
marl, stone, rock, and sand loaded mainly on the second axis.
300
The correlation of environmental variables and SESMPD and CWM values are shown 301
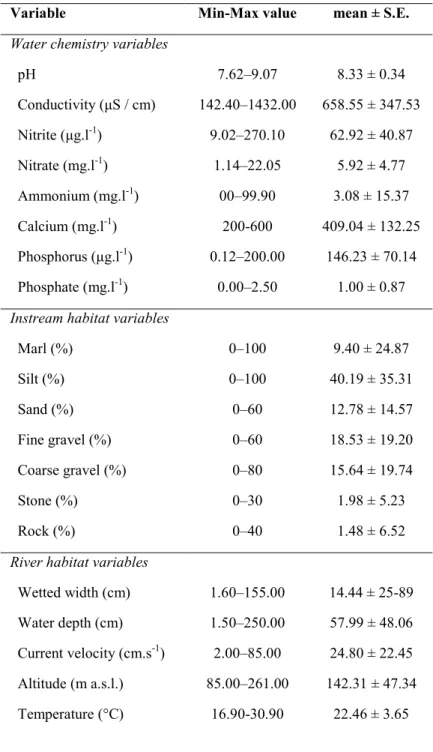
in Figure 1-4. In case of HH species we found that the diversity of leaf related traits and seed 302
shape had a positive correlation with nutrient rich fine sediment and showed negative 303
correlation with pH, current velocity and elevation (i.e. at highland sites leaves had a lower 304
10 functional diversity) (Fig 1). The opposite trend was found for seed weight. In case of RB 305
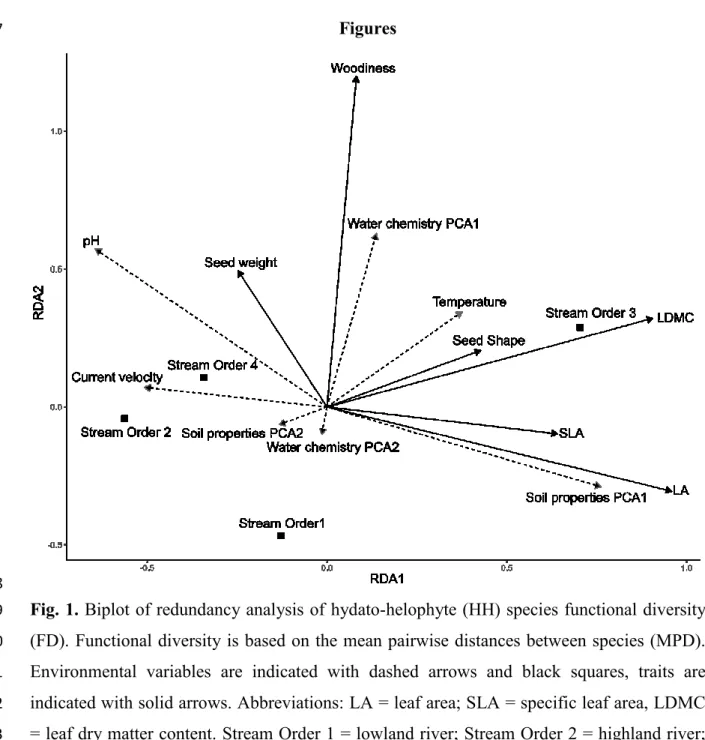
species the diversity of leaf related traits showed negative correlation with nutrient rich fine 306
sediment and elevation (i.e. at lowland sites leaves had a lower functional diversity) (Fig. 2).
307
Seed weight and woodiness showed positive correlation with pH and temperature, while seed 308
shape showed the opposite trend.
309
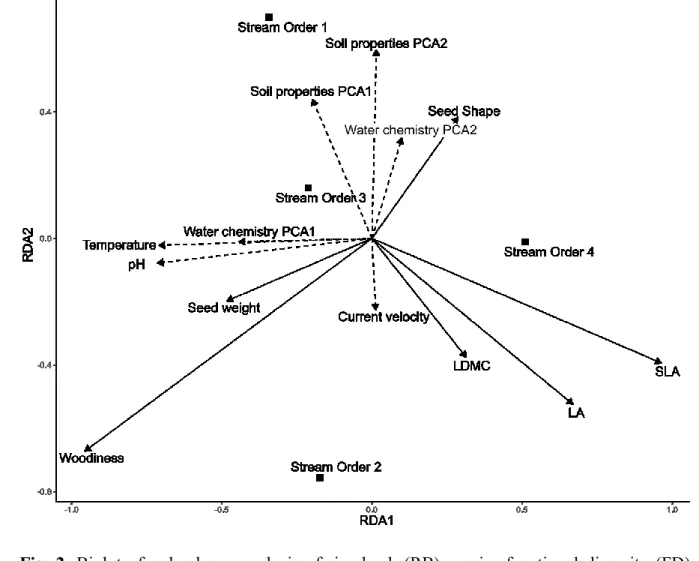
Functional composition (i.e. CWM) of HH communities shifted to higher seed weight 310
in lowland rivers (Stream Order 1) (Fig. 3) and to higher LDMC under higher pH. HH 311
communities were characterised with higher woodiness and LDMC under higher velocity and 312
in highland rivers (Stream Order 2) and lower LA and LDMC in nutrient rich fine sediment.
313
Functional composition of RB communities shifted to higher seed weight and woodiness in 314
lowland sites (Stream Order 1 and 3). The opposite trend was found for current velocity and 315
highland sites (Stream Order 2 and 4). RB communities were characterised with higher LA 316
under higher pH, but lower LA in nutrient rich fine sediment.
317
The significance of the single trait metric – environmental gradient relationships can 318
be found in Table 2, and scatterplots for each relationship in Appendix S4-7.
319 320
Plant trait – stream size relationship 321
We found a shift from trait convergence to trait divergence (i.e. from negative to positive 322
SESMPD values) along the stream order gradient for SLA among HH and RB species (Table 2, 323
Appendix S4-5). This suggests that we found decreasing trait convergence from lowland 324
rivers to highland rivers and increasing trait divergence from lowland streams to highland 325
streams. Woodiness became less converged along the stream size gradient among HH 326
species.
327
The community weighted mean of LA increased, while seed weight and woodiness decreased 328
significantly among HH species (Table 2, Appendix S6).
329 330
Plant trait – temperature relationship 331
We found a significant shift from trait convergence to trait divergence (i.e. from negative to 332
positive SESMPD values) with increasing temperature for LDMC among HH species (Table 2, 333
Appendix S3). The same trend was found for woodiness among RB species (Table 2, 334
Appendix S4). Woodiness became less converged along the temperature gradient among HH 335
species. We did not find any significant changes in the community weighted mean of the 336
traits.
337 338
11 Plant trait – water velocity gradient relationship
339
Specific leaf area became more converged (i.e. more negative SESMPD values) along the 340
velocity gradient among RB species (Table 2, Appendix S5).
341
The community weighted mean of woodiness significantly increased along the velocity 342
gradient among HH species (Table 2, Appendix S6), i.e. HH species tend to produce more 343
resilient woody stems with increasing water velocity.
344 345
Plant trait – pH gradient relationship 346
We found a significant shift from trait divergence to trait convergence (i.e. from positive to 347
negative SESMPD values) with increasing pH in the case of LA, SLA, and LDMC among HH 348
species (Table 2, Appendix S4). The same trend was found for SLA among RB species 349
(Appendix S5). Woodiness became less converged (i.e. SESMPD values were less negative) 350
with increasing pH among HH species (Appendix S4).
351
The CWM of SLA significantly decreased with increasing pH among HH and RB 352
species, which means that leaf tissue became on average denser towards higher pH (i.e.
353
where bicarbonate is the main available form of carbon) (Table 2, Appendix S6-7). The 354
CWM of LA significantly increased among HH species with increasing pH, while the same 355
trend was found for LDMC among RB species.
356 357
Plant trait – water chemical compound gradient relationship 358
Along the PC1 axis of water chemical compounds (i.e. mostly related to nitrate content) we 359
found a significant shift from trait convergence to trait divergence (i.e. shift from negative to 360
positive SESMPD values) in the case of LDMC among HH species (Table 2, Appendix S4).
361
We did not find any changes in the community weighted mean of the traits.
362 363
Plant trait – substrate properties relationship 364
Along the PC1 axis of substrate properties (i.e. nutrient rich, fine sediment) trait convergence 365
became significantly weaker (i.e. less negative SESMPD values) for SLA, while a significant 366
shift from trait convergence to trait divergence in the case of LA among HH species could be 367
observed (Table 2, Appendix S4). LA and SLA became more converged (i.e. more negative 368
SESMPD values) along the substrate property gradient among RB species (Appendix S5).
369
Along the PC2 axis of substrate properties (i.e. nutrient poor, coarse sediment) we found a 370
significant shift from trait divergence to trait convergence in the case of woodiness among 371
RB species.
372
12 The community weighted mean of LDMC significantly decreased along the PC1 axis 373
gradient among HH species (Table 2, Appendix S6), while the opposite trend was found for 374
seed weight among RB species (Appendix S7). Community weighted mean of LA 375
significantly decreased along the PC2 axis gradient among RB species.
376 377
Differences between hydato-helophyte and riverbank species 378
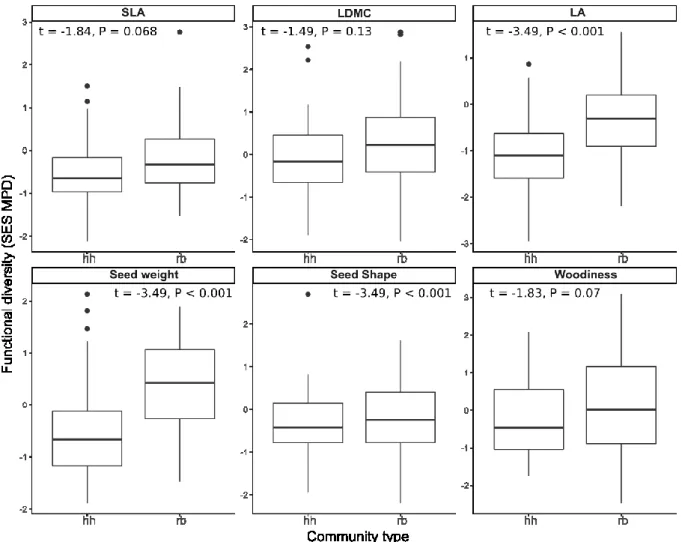
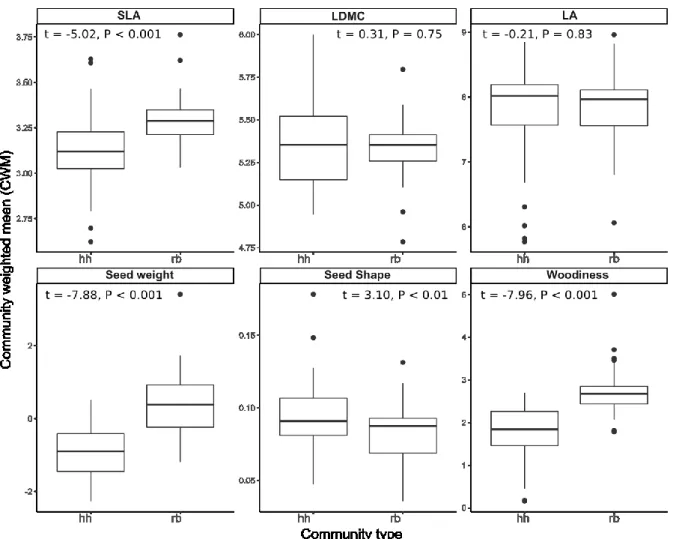
We found significantly higher functional diversity in RB communities than HH communities 379
for all traits except for seed shape We found significantly higher functional diversity in RB 380
communities than HH communities for LA, seed weight, and seed shape (Fig. 5). River bank 381
communities were characterised by significantly higher SLA, seed weight and woodiness 382
than HH communities. The opposite trend was found for seed shape (Fig. 6).
383 384
Discussion 385
The relative importance of environmental filtering and niche differentiation 386
The growth and survival of aquatic plants is determined by various environmental factors 387
(Sand-Jensen, 1989). Our study assessed the effect of environmental variables on functional 388
traits of river plants. The results suggest that functional convergence due to environmental 389
filtering acts along the studied environmental gradients. Although our analyses showed trait 390
divergence in some cases, these patterns are unlikely the result of limiting similarity.
391
Previous local scale studies have demonstrated that competition and limiting similarity (niche 392
differentiation) can both play a role in aquatic ecosystems under high productivity 393
(Engelhardt & Ritchie, 2001; Fu et al., 2014a). In our study, however, plot sizes were 394
insufficient for investigating the effect of competitive interactions, which occur on a much 395
finer scale (Weiher & Keddy 1995). Moreover, according to our results, when SES of 396
functional diversity were positive, relationships with the nutrient gradients were weak. Trait 397
divergence in our data is more likely a consequence of small scale environmental 398
heterogeneity of the river environment than of limiting similarity, as a result of sampling 399
across the entire river transect (Kraft & Ackerly, 2010).
400
Overall, we found significant differences in the case of both functional diversity and 401
dominant trait values between HH and RB communities, which underpins their different 402
resource use strategies and adaptations to occupy different habitats. We found the greatest 403
and most consistent changes of trait composition and diversity along the stream size, pH and 404
substrate property gradients, which underpins the importance of the leaf economic spectrum 405
(LA, SLA, LDMC) and two key resources: carbon and nutrients.
406
13 407
Traits response to physical properties 408
The trait based structure of macrophyte communities changed significantly with stream size.
409
We found a shift from convergence to divergence in SLA along the stream size gradient.
410
Considering that streams have higher water velocity to channel width ratio than rivers, 411
streams can represent a harsher environment, and act as a physiological (via substrate 412
characteristics and light depletion) and mechanical stress for plants (Bornette & Puijalon, 413
2011; Puijalon et al., 2011; Read & Stokes, 2006). Exposure to currents or waves can result 414
in reduced plant biomass and height (dwarfed growth form), reduced leaf area and a greater 415
allocation to below-ground organs (Doyle, 2001; Strand & Weisner, 2001). Conversely, the 416
obtained convergence of SLA in rivers and divergence of SLA in streams (irrespectively of 417
its highland or lowland position) might contradict the stress-dominance hypothesis (i.e. trait 418
convergence in harsher and trait divergence in benign conditions). Differences in the 419
competition for light in river and stream habitats might be affected by the homogeneity of 420
environmental conditions. Compared to rivers, streams offer a more heterogeneous range of 421
niches (from open to shaded), therefore, they are favoured by plants with more diverse light- 422
use strategies.
423 424
Although we cannot directly compare the continuous traits in our study and 425
categorical trait attributes (e.g. meristem position) used by others (e.g. Willby, Abernethy, &
426
Demars, 2000), our findings corroborate results of Baattrup-Pedersen et al. (2015), who also 427
found that stream size influenced the abundance weighted trait characteristics of macrophyte 428
communities. Although we didn’t find changes in the CWM of SLA along the stream size 429
gradient, Baattrup-Pedersen et al. (2015) described that plant communities in small streams 430
are characterised by a higher abundance of light-demanding species (having meristems with 431
single apical growth point). Overall, we can conclude that the size of the river habitat can 432
affect not only the growth-form composition of aquatic plant communities (i.e. categorical 433
trait attributes) but the size and composition of specific plant organs.
434
The increasing functional diversity of woodiness among HH species indicates the 435
decreasing importance of environmental filtering related to mechanical durability and 436
defences of the stems against water movement in streams compared to rivers. On the other 437
hand, the increasing CWM of woodiness among HH species indicates their ability to resist 438
mechanical fragmentation.
439 440
14 Traits response to carbon limitation
441
The pH of the sampled streams and rivers was between 7.62 and 9.07, which lies in the 442
middle of the section of the pH gradient where the relative distribution of the three main 443
inorganic carbon types (carbon-dioxide, bicarbonate and carbonate) is transformed because 444
they are converted into each other (Pedersen et al., 2013). Below pH 6, dissolved inorganic 445
carbon is present as CO2. In general, this carbon form is more readily used for underwater 446
photosynthesis than bicarbonate. However, above pH 8, CO2 gradually disappears from 447
waters, because between pH 7 and 10 it is converted into bicarbonate (HCO3-). Bicarbonate is 448
an additional carbon source among most of the aquatic plants except for pteridophytes and 449
mosses.
450
Decreasing functional diversity of SLA, LA, and LDMC among HH species, and SLA 451
among RB species along the pH gradient suggests that the effect of environmental filtering 452
significantly increased toward higher pH (i.e. CO2 limitation). Moreover, the observed 453
pattern of functional diversity does support our expectation of a stronger filtering in HH 454
communities, compared to RB. On the contrary, HH communities became less converged on 455
woodiness (i.e. SES values of functional diversity became less negative) along the pH 456
gradient, indicating weaker environmental filtering toward higher pH. Overall, the observed 457
variation of leaf and woodiness traits along the pH gradient suggests that HH communities 458
have only a small range of leaf „structure”, which can be characterised with high LDMC and 459
low SLA (i.e. tough leaf syndrome, details see later) under higher concentration of 460
bicarbonate, while woodiness (and physical resistance) became less important. In that way 461
species can reallocate nutrients and energy from the stem to the leaves with increasing pH, 462
which indicates a functional shift from resistance into photosynthesis.
463
Regarding CWM of leaf traits, SLA significantly decreased among HH and RB 464
species, LDMC significantly increased among RB species, whereas LA significantly 465
increased among HH species. These trends indicate denser leaf tissue (i.e. tough leaf 466
syndrome) towards higher pH, where only the bicarbonate form of inorganic carbon is 467
available. Aquatic plants with the ability to use bicarbonate have major competitive 468
advantage over obligate CO2 users under CO2 limited conditions (Maberly & Madsen, 2002).
469
Our results suggest a negative correlation between SLA and bicarbonate use ability (or 470
efficiency) among HH species. Moreover, these results indicate different adaptive 471
mechanisms for higher pH between HH and RB species. Hydato-helophyte species attain low 472
SLA by producing larger and denser leaves, while RB species tend to invest more only in 473
tissue density, i.e. produce denser leaves under higher pH conditions. This is confirmed by 474
15 the fact that LDMC converged to higher values in both HH and RB species, but LA
475
converged to higher values only among HH species.
476
According to Poorter, Niinemets, Poorter, Wright, & Villar (2009) high SLA is 477
typical for aquatic plants, as investment in supportive structures counteracting gravity is not 478
needed in aquatic plants. However, Pierce, Brusa, Sartori, & Cerabolini (2012) and Lukács et 479
al. (2017) demonstrated that not all aquatic plants lie at the acquisitive end of the leaf 480
economics spectrum. In general, species with low SLA are geared for the conservation of 481
acquired resources (Cornelissen et al., 2003). Due to the higher dry matter content they are 482
characterised by lower growth rates, higher concentration of cell walls and secondary 483
metabolites; overall, their leaves contain more carbon and are more resistant. Therefore, low 484
SLA in aquatic plants might reflect the dominance of bicarbonate users on the community 485
level..
486 487
Traits response to nutrient limitation 488
Changes in trait patterns along the first axis of substrate property support our second 489
hypothesis for HH, but not for RB communities. For HH communities, we found significant 490
changes of the functional diversity of LA and SLA along the PC1 substrate property gradient, 491
with higher diversity in these traits in finer, more nutrient rich sediments. For RB 492
communities, the pattern was opposite, with less diversity of LA and SLA in communities 493
towards nutrient enrichment.
494
There are contrasting views in the literature regarding how the strength of trait 495
divergence and convergence varies along productivity gradients. The trends depend mainly 496
on the studied traits (Bernard-Verdier et al., 2012; Spasojevic & Suding, 2012) and the size 497
of the gradient (Bernard-Verdier et al., 2012). Some authors (Pakeman, 2011; e.g. Mason et 498
al., 2012; Carboni, et al. 2014) found increasing trait convergence toward higher productivity, 499
others (Lhotsky et al., 2016) found the opposite trend, while Navas & Violle (2009) argued 500
that trait convergence is expected at both ends of the productivity gradient. Here, we found 501
decreasing convergence of SLA and LA towards higher nutrient content among HH, and the 502
opposite, increasing convergence of SLA and LA among RB species along the same gradient.
503
These results would suggest that more productive aquatic habitats enable and maintain a 504
higher diversity in growth rate and nutrient acquisition strategies (Cornelissen et al., 2003), 505
supporting the idea of stronger filtering under more stressful conditions, in this case, low 506
nutrient levels (Weiher & Keddy, 1995; Swenson & Enquist, 2009). Changes in CWM of 507
SLA and LA along the nutrient gradients, however, were not significant, indicating that the 508
16 diversified strategies in nutrient richer environments are achieved from similar “average 509
communities” for these traits.
510
On the other hand, the trait convergence of RB species are in line with Grime’s (2006) 511
hypothesis that higher productivity leads to trait convergence. However, this interpretation 512
needs to be made with caution, since the used sample scale is not the most appropriate to 513
infer competition based patterns, and smaller scale studies would be needed to clarify this 514
issue.
515 516
Conclusion 517
In this study, we identified how functional traits of macrophytes respond to the carbon 518
(related to pH), soil nutrient and current velocity gradients in streams and rivers and how 519
these relationships vary between HH and RB communities. The variation in communities’
520
functional composition in terms of functional diversity (SESMPD) and dominant traits (CWM) 521
mirrored significant trends and adaptation mechanisms to nutrient and carbon sources among 522
macrophytes, with strength and direction largely depending on the specific trait. Overall, 523
traits showed stronger associations with the carbon (i.e. pH) gradient compared to nutrient 524
gradients. We can therefore conclude that mechanisms underlying changes in stream plant 525
communities are related mostly to light capture and utilization and not to nutrient 526
preferences. This clearly underpins the results of Baattrup-Pedersen at al. (2015) who 527
detected similar trends through the composition of growth-forms. Our use of more precise 528
continuous traits and specific relevant gradients has led to an improved understanding of 529
aquatic community assembly in river habitats.
530 531
Acknowledgement 532
The authors would like to thank Joan Mattia Ph.D. for improving the language of the 533
manuscript. We thank Gabriella Bodnár, Kristóf Süveges and Endre Bajka for their 534
contribution to field sampling. We also acknowledge the suggestions of three anonymous 535
reviewers.
536
The authors have no conflict of interest to declare.
537 538
Authors’ contributions 539
The study was planned by BAL; fieldwork was organized and performed mostly by BAL, 540
AEV and AMV; statistical analyses were performed by LG; the manuscript was written by 541
BAL, LG and AEV, all other authors made essential contributions to revise the text.
542
17 543
Data accessibility 544
Data used in the analyses are to be deposited in the Dryad repository.
545 546
References 547
AQEM Consortium (2002). Manual for the application of the AQEM method. A 548
comprehensive method to assess European streams using benthic macroinvertebrates, 549
developed for the purpose of the Water Framework Directive. Version 1.0.
550
Baastrup-Spohr, L., Sand-Jensen, K., Nicolajsen, S.V. & Bruun, H.H. (2015). From soaking 551
wet to bone dry: predicting plant community composition along a steep hydrological 552
gradient. Journal of Vegetation Science, 26, 619–630.
553
Baattrup-Pedersen, A., Göthe, E., Larsen, S.E., O'Hare, M., Birk, S., Riis, T. & Friberg, N.
554
(2015). Plant trait characteristics vary with size and eutrophication in European lowland 555
streams. Journal of Applied Ecology, 52, 1617–1628.
556
Bekker, R. M., Bakker, J. P., Grandin, U., Kalamees, R., Milberg, P., Poschlod, P., 557
Thompson K. & Willems, J. H. (1998). Seed size, shape and vertical distribution in the soil:
558
indicators of seed longevity. Functional Ecology, 12, 834–842.
559
Bernard-Verdier, M., Navas, M.-L., Vellend, M., Violle, C., Fayolle, A. & Garnier, E.
560
(2012). Community assembly along a soil depth gradient: contrasting patterns of plant trait 561
convergence and divergence in a Mediterranean rangeland. Journal of Ecology, 100, 1422–
562
1433.
563
Borhidi, A. (1993). Social behaviour types of the Hungarian flora, its naturalness and relative 564
ecological indicator values. University of Janus Pannonius. 39 pp.
565
Bornette, G. & Puijalon, S. (2011). Response of aquatic plants to abiotic factors: a review.
566
Aquatic Sciences, 73, 1–14.
567
Burke, M.J.W. & Grime, J.P. (1996). An experimental study of plant community invasibility.
568
Ecology, 77, 776–790.
569
Carboni , M. , de Bello , F. , Janeček , Š. , Doležal , J. , Horník , J. , Lepš , J. , Reitalu, T. &
570
Klimešová , J. ( 2014 ). Changes in trait divergence and convergence along a productivity 571
gradient in wet meadows . Agriculture, Ecosystems and Environment , 182 , 96–105.
572
Cornelissen, J.H.C., Lavorel, S., Garnier, E., Díaz, S., Buchmann, N., Gurvich, D.E., Reich, 573
P.B., … Poorter, H. (2003). Handbook of protocols for standardized and easy measurement 574
of plant functional traits worldwide. Australian Journal of Botany, 51, 335-380.
575
18 Cornwell, W.K. & Ackerly, D.D. (2009). Community assembly and shifts in plant trait 576
distributions across an environmental gradient in coastal California. Ecological 577
Monographs, 79, 109–126.
578
de Bello, F., Carmona, C.P., Lepš, J., Szava-Kovats, R. & Pärtel, M. (2016). Functional 579
diversity through the mean trait dissimilarity: resolving shortcomings with existing 580
paradigms and algorithms. Oecologia, 180, 933–940.
581
Díaz, S., Lavorel, S., de Bello, F., Quétier, F., Grigulis, K. & Robson T.M. (2007).
582
Incorporating plant functional diversity effects in ecosystem service assessments.
583
Proceedings of the National Academy of Sciences of the United States of America, 104, 584
20684–20689.
585
Doyle, R.D. (2001). Effects of waves on the early growth of Vallisneria americana.
586
Freshwater Biology, 46, 389–397.
587
Engelhardt, K.A.M. & Ritchie, M.E. (2001). Effects of macrophyte species richness on 588
wetland ecosystem functioning and services. Nature, 411, 687–689.
589
Erős, T., Takács, P., Specziár, A., Schmera, D., Sály, P. (2017). Effect of landscape context 590
on fish metacommunity structuring in stream networks. Freshwater Biology, 62, 215-228.
591
Fu, H., Zhong, J., Yuan, G., Ni, L., Xie, P. & Cao, T. (2014a). Functional traits composition 592
predict macrophytes community productivity along a water depth gradient in a freshwater 593
lake. Ecology & Evolution, 4, 1516–1523.
594
Fu, H., Zhong, J., Yuan, G., Xie, P., Guo, L., Zhang, X., … Ni, L. (2014b). Trait-based 595
community assembly of aquatic macrophytes along a water depth gradient in a freshwater 596
lake. Freshwater Biology, 59, 2462–2471.
597
Göthe, E., Baattrup-Pedersen, A., Wiberg-Larsen P., Graeber, D., Kristensen, E.A. & Friberg, 598
N. (2017). Environmental and spatial controls of taxonomic versus trait composition of 599
stream biota. Freshwater Biology, 62, 397–413.
600
Götzenberger, L., de Bello, F.,Bråthen, K.A., Davison, J., Dubuis, A., Guisan, A., … Zobel, 601
M. (2012). Ecological assembly rules in plant communities—approaches, patterns and 602
prospects. Biological Reviews, 87, 111–127.
603
Grime, J.P. (2006). Trait convergence and trait divergence in herbaceous plant communities:
604
mechanisms and consequences. Journal of Vegetation Science, 17, 255–260.
605
Kembel, S.W., Cowan, P.D., Helmus, M.R., Cornwell, W.K., Morlon, H., Ackerly, D.D., 606
Blomberg, S.P. & Webb, C.O. (2010). Picante: R tools for integrating phylogenies and 607
ecology. Bioinformatics, 26, 1463–1464.
608
19 Kleyer, M., Bekker, R.M., Knevel, I.C., Bakker, J.P., Thompson, K., Sonnenschein, M., … 609
Peco, B. (2008). The LEDA Traitbase: a database of life-history traits of the Northwest 610
European flora. Journal of Ecology, 96, 1266–1274.
611
Knevel, I.C., Bekker, R.M., Bakker, J.P. & Kleyer, M. (2003). Life-history traits of the 612
Northwest European flora: the LEDA database. Journal of Vegetation Science, 14, 611–
613
614.
614
Kohler, A. (1978) Methoden der Kartierung von Flora und Vegetation von 615
Süßwasserbiotopen. Landschaft und Stadt, 10, 73–85.
616
Kraft, N.J.B. & Ackerly, D.D. (2010). Functional trait and phylogenetic tests of community 617
assembly across spatial scales in an Amazonian forest. Ecological Monographs, 80, 401- 618
422.
619
Kraft, N.J.B., Valencia, R. & Ackerly D.D. (2008). Functional traits and niche-based tree 620
community assembly in an amazonian forest. Science, 322, 580–582.
621
Lacoul, P. & Freedman, B. (2006): Environmental influences on aquatic plants in freshwater 622
ecosystems. Environmental Reviews, 14, 89–136.
623
Leishmann, M.R., Wright, I.J., Moles, A.T. & Westoby, M. (2000). The evolutionary ecology 624
of seed size. In.: Fenner, M. (eds): Seeds: the ecology of regeneration in plant communities 625
2nd Edition. CABI publishing, UK, pp 31–57.
626
Lhotsky, B., Kovács, B., Ónodi, G., Csecserits, A., Rédei, T., Lengyel, A., Kertész, M. &
627
Botta-Dukát Z. (2016). Changes in assembly rules along a stress gradient from open dry 628
grasslands to wetlands. Journal of Ecology 104: 507–517.
629
Lukács, B.A., Vojtkó, A.E., Mesterházy, A., Molnár, V.A., Süveges, K., Végvári, Z., … 630
Cerabolini, B.E.L. (2017). Growth-form and spatiality driving the functional difference of 631
native and alien aquatic plants in Europe. Ecology and Evolution, 7, 950–963.
632
Maberly, S.C. & Madsen, T.V. (2002). Freshwater angiosperm carbon concentrating 633
mechanisms: processes and patterns. Functional Plant Biology, 29, 393–405.
634
MacArthur, R.H. & Levins, R. (1967). The limiting similarity, convergence and divergence 635
of coexisting species. American Naturalist, 101, 377–385. http://dx.doi.org/10.1086/282505 636
Mason, N.W.H., Richardson, S.J., Peltzer, D.A., de Bello, F., Wardle, D.A. & Allen, R.B.
637
(2012). Changes in coexistence mechanisms along a long-term soil chronosequence 638
revealed by functional trait diversity. Journal of Ecology, 100, 678–689.
639
McGill, B.J., Enquist, B.J., Weiher, E. & Westoby, M. (2006). Rebuilding community 640
ecology from functional traits. Trends in Ecology and Evolution, 21, 178–185.
641
20 Ministry of Environment and Water (2004). Departmental Order 31/2004 (XII. 30.) on the 642
Rules of Assessment and Evaluation of Surface Waters in Hungary [In Hungarian].
643
Moor, H., Rydin, H., Hylander, K., Nilsson, M.B., Lindborg, R. & Norberg J. (2017).
644
Towards a trait-based ecology of wetland vegetation. Journal of Ecology, 105, 1623–1635.
645
MSZ EN ISO 6878:2004, 2004. Water quality. Determination of phosphorus. Ammonium 646
molybdate spectrometric method (ISO 6878:2004).
647
Navas, M. & Violle, C. (2009). Plant traits related to competition: how do they shape the 648
functional diversity of communities? Community Ecology, 10, 131–137.
649
Oksanen, J., Blanchet, F.J., Friendly, M., Kindt, R., Legendre, P., McGlinn, D., … Wagner, 650
H. (2017). vegan: Community Ecology Package. R package version 2.4-5. https://CRAN.R- 651
project.org/package=vegan.
652
Pakeman, R.J. (2011). Functional diversity indices reveal the impacts of land use 653
intensification on plant community assembly. Journal of Ecology, 99, 1143–1151.
654
Pedersen, O., Colmer, T.D. & Sand-Jensen, K., (2013). Underwater photosynthesis of 655
submerged plants – recent advances and methods. Frontiers in Plant Science, 4, 1–19.
656
Pierce, S., Brusa, G., Sartori, M. & Cerabolini, B.E.L. (2012). Combined use of leaf size and 657
economics traits allows direct comparison of hydrophyte and terrestrial herbaceous adaptive 658
strategies. Annals of Botany, 109, 1047–1053.
659
Poorter, H., Niinemets, Ü.,Poorter, L., Wright, I.J. & Villar, R. (2009). Causes and 660
consequences of variation in leaf mass per area (LMA): a meta-analysis. New Phytologist, 661
182, 565–588.
662
Puijalon, S., Bouma, T.J., Douady, C.J., van Groenendael, J., Anten, N.P.R., Martel, E. &
663
Bornette, G. (2011). Plant resistance to mechanical stress: evidence of an avoidance–
664
tolerance trade-off. New Phytologist, 191, 1141–1149.
665
R Core Team (2015). R: A language and environment for statistical computing. R Foundation 666
for Statistical Computing. Vienna, Austria. Available at www.r-project.org 667
Ricotta, C. & Moretti, M. (2011). CWM and Rao’s quadratic diversity: A unified framework 668
for functional ecology. Oecologia, 167, 181–188.
669
Read, J. & Stokes, A. (2006). Plant biomechanics in an ecological context. American Journal 670
of Botany, 93, 1546–1565.
671
Reich, P.B., Ellsworth, D.S., Walters, M.B., Vose, J.M., Gresham, C., Volin, J.C. &
672
Bowman, W.D. (1999). Generality of leaf trait relationships: a test across six biomes.
673
Ecology, 80, 1955–1969.
674
21 Reich, P.B., Wright, I.J., Cavender-Bares, J., Craine, J.M., Oleksyn, J., Westoby, M., &
675
Walters, M.B. (2003). The evolution of plant functional variation: traits, spectra, and 676
strategies. International Journal of Plant Science, 164, S143–S164.
677
Riis, T., Sand-Jensen, K. & Vestergaard, O. (2000). Plant communities in lowland Danish 678
streams: species composition and environmental factors. Aquatic Botany, 66, 255–272.
679
Rocarpin, P., Gachet, S., Metzner, K. & Saatkamp, A. (2016). Moisture and soil parameters 680
drive plant community assembly in Mediterranean temporary pools. Hydrobiologia, 781, 681
55–66.
682
Roche, P., Díaz-Burlinson, N. & Gachet, S. (2004). Congruency analysis of species ranking 683
based on leaf traits: which traits are the more reliable? Plant Ecology, 174, 37–48.
684
Sand-Jensen, K. (1989). Environmental variables and their effect on photosynthesis of 685
aquatic plant communities. Aquatic Botany, 34, 5–25.
686
Schmera, D., Árva, D., Boda, P., Bodis, E., Bolgovics, Á., Borics, G., … Erős, T. (2017).
687
Does isolation influence the relative role of environmental and dispersal-related processes 688
in stream networks? An empirical test of the network position hypothesis using multiple 689
taxa. Freshwater Biology, 63, 74–85.
690
Sousa, W.P., Kennedy, P.G., Mitchell, B.J. & Ordonez, B.M. (2007). Supply-Side Ecology in 691
Mangroves: Do Propagule Dispersal and Seedling Establishment Explain Forest Structure?
692
Ecological Monographs, 77, 53–76.
693
Spasojevic, M.J. & Suding, K.N. (2012). Inferring community assembly mechanisms from 694
functional diversity patterns: the importance of multiple assembly processes. Journal of 695
Ecology, 100, 652–661.
696
Strand, J.A. & Weisner, S.E.B. (2001). Morphological plastic responses to water depth and 697
wave exposure in an aquatic plant (Myriophyllum spicatum). Journal of Ecology, 89, 166–
698
175.
699
Stubbs, W.J. & Wilson, J.B. (2004). Evidence for limiting similarity in a sand dune 700
community. Journal of Ecology, 92, 557–567.
701
Swenson, N.G. & Enquist, B.J. (2007). Ecological and evolutionary determinants of a key 702
plant functional trait: wood density and its community-wide variation across latitude and 703
elevation. American Journal of Botany, 94, 451–459.
704
Swenson, N. G. & Enquist, B. J. (2009). Opposing assembly mechanisms in a Neotropical 705
dry forest: implications for phylogenetic and functional community ecology. Ecology, 90, 706
2161–2170.
707
22 Thompson, K., Band, S.R. & Hodgson, J.G. (1993). Seed size and shape predict seed
708
persistence in the soil. Functional Ecology, 7, 236–241.
709
Weiher, E. & Keddy, P. (1995). Assembly rules, null models, and trait dispersion: new 710
questions from old patterns. Oikos, 74, 159–164.
711
Weiher, E., van der Werf, A., Thompson, K., Roderick, M., Garnier, E. & Eriksson, O.
712
(1999). Challenging Theophrastus: a common core list of plant traits for functional ecology.
713
Journal of Vegetation Science, 10, 609–620.
714
Willby, N.J., Abernethy, V.J. & Demars, B.O.L. (2000). Attribute-based classification of 715
European hydrophytes and its relationship to habitat utilization. Freshwater Biology, 43, 716
43–74.
717
Wright, I.J., Reich, P.B., Westoby, M., Ackerly, D.D., Baruch, Z., Bongers, F., … Villar, R.
718
(2004). The worldwide leaf economics spectrum. Nature, 428, 821–827.
719