Ecological Indicators 129 (2021) 107952
Available online 7 July 2021
1470-160X/© 2021 The Authors. Published by Elsevier Ltd. This is an open access article under the CC BY license (http://creativecommons.org/licenses/by/4.0/).
Original Articles
Congruency between two traditional and eDNA-based sampling methods in characterising taxonomic and trait-based structure of fish communities and community-environment relationships in lentic environment
Istv ´ an Czegl ´ edi
a,*, P ´ eter S ´ aly
b, Andr ´ as Speczi ´ ar
a, B ´ alint Preiszner
a, Zolt ´ an Szal ´ oky
b, Agnes Maroda ´
c, Didier Pont
d, Paul Meulenbroek
d,e, Alice Valentini
f, Tibor Er os ˝
aaBalaton Limnological Research Institute, E¨otv¨os Lor´and Research Network (ELKH), Klebelsberg Kuno u. 3, Tihany, Hungary
bInstitute of Aquatic Ecology, Centre for Ecological Research, E¨otv¨os Lor´and Research Network (ELKH), Karolina út 29, Budapest, Hungary
cHungarian University of Agriculture and Life Sciences, Department of Zoology and Ecology, P´ater K. u. 1, G¨od¨oll˝o, Hungary
dInstitute of Hydrobiology and Aquatic Ecosystem Management, University of Natural Resources and Life Sciences, Gregor-Mendel-Strasse 33, Vienna, Austria
eWasserCluster Lunz – biologische Station, Lunz am See, Dr. Carl Kupelwieser Prom. 5, 3293 Lunz/See, Austria
fSPYGEN, Savoie Technolac, 17 rue du Lac Saint-Andr´e, Le Bourget du Lac, France
A R T I C L E I N F O Keywords:
Fish sampling Oxbow lakes Variance partitioning Functional groups Metacommunity
A B S T R A C T
Recent developments in environmental DNA (eDNA) metabarcoding suggest that eDNA-based representation of ecological communities can be a promising tool in both fundamental ecological research and environmental assessment. However, it is less known, how eDNA performs in characterising ecological communities and community-environment relationships at the regional scale compared with traditional sampling methods. Here, we used electrofishing (EF), gillnetting (GN) and eDNA-based surveys to compare their congruency in charac- terising the taxonomic and trait-based structure of (oxbow) lake fish communities and their structuring mech- anisms. eDNA proved to be more effective in detecting taxa in the total samples and by traits than EF and GN.
Principal coordinate analysis and multiple factor analysis showed a moderate separation of communities ac- cording to sampling methods for the taxon and the trait-based structures, respectively, but eDNA samples were always located in intermediate position in the ordination plots. Procrustes analyses indicated significant among- method congruency in community structure. However, in general, eDNA-based community patterns always showed higher correlation with either the EF or the GN-based community patterns, than the two traditional methods to each other. Variance partitioning in redundancy analyses indicated large differences among the sampling methods in the importance of environmental and spatial variables in shaping metacommunity struc- ture. These results thus suggest that the sampling method can largely influence the identified mechanisms which govern fish metacommunity organisation. Our results suggest, that eDNA metabarcoding can be the best uni- versal method for understanding the taxonomic and trait-based organisation of lake fish metacommunities.
1. Introduction
The accurate estimation of community attributes (e.g. species rich- ness and composition, relative abundance, functional metrics) is a basic requirement in both fundamental ecological research and environ- mental monitoring and assessment (Cao et al., 2002; Kennard et al., 2006). However, representative sampling of ecological communities can be complicated in many cases due to environmental features of the
habitat and/or to the biological attributes (e.g. behaviour, size) of the species forming the studied community (Kenkel et al., 1989; Boitani and Fuller, 2000). Sampling in aquatic environments can be especially challenging, since depth, flow or transparency of the water restrict vi- sual censuses and handling sampling devices (Cuffney et al., 1993;
Eggleton et al., 2010; Mueller et al., 2017). For example, a variety of catching methods are available for sampling fish communities (Cowx, 1996; Murphy and Willis, 1996). However, catching effectiveness,
* Corresponding author.
E-mail addresses: czegledi.istvan@blki.hu (I. Czegl´edi), saly.peter@ecolres.hu (P. S´aly), specziar.andras@blki.hu (A. Speczi´ar), preiszner.balint@blki.hu (B. Preiszner), szaloky.zoltan@ecolres.hu (Z. Szal´oky), maroda.agnes@gmail.com (A. Maroda), didier.pont@boku.ac.at ´ (D. Pont), paul.meulenbroek@boku.ac.at (P. Meulenbroek), alice.valentini@spygen.com (A. Valentini), eros.tibor@blki.hu (T. Er˝os).
Contents lists available at ScienceDirect
Ecological Indicators
journal homepage: www.elsevier.com/locate/ecolind
https://doi.org/10.1016/j.ecolind.2021.107952
Received 12 April 2021; Received in revised form 30 June 2021; Accepted 2 July 2021
including species and size selectivity patterns may differ for each gear, and vary among different habitats, making it difficult to determine whether these differences allow for accurate characterisation of com- munity attributes. Hence, there is a need for a more intensive evaluation of among-gear variations to determine their relative efficiency (Jackson and Harvey, 1997).
While the combination of different sampling methods may provide complementary information about the examined system, logistical constraints often hinder the application of multiple sampling methods for characterising ecological communities. Integrating catch data from various gears for different species is also challenging in the case of abundance or biomass data (Jackson and Harvey, 1997). There is thus a high need for a single universal method which can be a suitable compromise for comparing community structure in space and time. In this regard, environmental DNA (hereafter, eDNA) metabarcoding has recently been suggested as a very effective, non-destructive method for monitoring spatial and temporal distribution of species and commu- nities in aquatic ecosystems (Goldberg et al., 2016; Valentini et al., 2016; Fujii et al., 2019).
Although advocated widely, the performance of eDNA methods in different habitats and for specific organism groups is still intensively studied in freshwater ecology and conservation (e.g. Nakagawa et al., 2018; Coble et al., 2019; Seymour et al., 2020). In fact, most studies on the performance of eDNA for characterising ecological communities over traditional sampling methods were local in scale (but see e.g. Pont et al., 2018; Murienne et al., 2019; Blackman et al., 2021), which compared how eDNA and traditional sampling devices represent the community of interest in a single lake or river sites. For example, for fish communities it has been shown that eDNA methods can largely com- plement traditional sampling devices in detecting species in separate within-lake or within-river surveys (Shaw et al., 2016; Sard et al., 2019;
Li et al., 2019; Antognazza et al., 2021). In general, eDNA methods outperform traditional methods in detecting fishes in freshwater systems with fewer than 100 species (McElroy et al., 2020). However, it is still largely unknown how congruent are community samples between traditional and eDNA methods for characterising regional scale meta- community organisation. The quantification of their landscape or regional scale concordance is important, among others, to reveal how traditional and eDNA methods differ in characterising metacommunities and the importance of spatial and environmental variables in commu- nity organisation (Beisner et al., 2006; Heino et al., 2013).
Differences in sampling methods may influence not only the in- ferences on taxonomic composition, but also on the trait-based structure of communities. However, analyses that incorporate the trait-based structure of communities are still especially rare in eDNA-based studies (but see e.g. Pont et al., 2019). This is unfortunate, since char- acterisation of communities based on functional traits is inevitable for a better understanding of the functioning of ecosystems (Eros et al., ˝ 2009a, 2009b; Cadotte, 2017). Overall, understanding how inferences on taxonomic and trait-based structure of communities vary among traditional and eDNA-based collections in a variety of aquatic ecosys- tems contributes to the planning of more effective sampling procedures, which ultimately may provide a more representative picture on com- munity structure in nature (Pont et al., 2019).
In this study, we examined the congruence of taxonomic and trait- based community structure and community-environment relationships between traditional and eDNA fish samples of oxbow lakes in the Pannon-Biogeographic region, Hungary. Specifically, we i) examined the similarities and differences in detecting taxa and traits using elec- trofishing (hereafter, EF), gillnetting (hereafter, GN for both terms
“gillnetting” and “gillnet”) and eDNA-based sampling methods, ii) quantified congruency in characterising community structure among the three methods, and iii) tested the congruency in the importance of spatial and environmental variables in predicting the metacommunity structure of lakes fishes.
2. Materials and methods 2.1. Study sites
We examined 22 oxbow lakes situated in the former and present floodplain of the Danube and Tisza Rivers, Hungary (Fig. 1) from 8 May 2019 to 24 May 2019. These two large rivers were regulated and dykes were built for flood protection. Twelve out of the studied oxbow lakes are located on the protected (backed up) side of the dykes, and ten are located on the floodplain. These oxbows have a variety of utilization from heavy human use to nature conservation. Most oxbows are used for recreational angling.
2.2. Spatial and environmental variables
We used the geo-coordinates of the oxbows, directly measured at the sampling sites with a GPS device (Garmin Montana 650) for spatial variables. Information on land-use within a 500 m wide buffer area around the water bodies was obtained from the CORINE Land Cover 2018 database (European Environmental Agency, 2020, http://www.
eea.europa.eu). Altitude and area of the lakes were measured using GIS tools, while mean depth, physical and chemical characteristics and utilization of the lakes were obtained from the database of the General Directorate of Water Management of Hungary. For the general charac- teristics of the oxbows and the environmental variables used for the statistical analyses, see Appendix.
2.3. Traditional samplings
Sampling of fish was conducted daytime using GN and EF (Er˝os et al., 2009a, 2009b; Speczi´ar et al., 2009). Two types of multi-mesh GN compatible with the European standard EN 14 757 (CEN, 2005) were used: the standard benthic GN composed of 12 conventional mesh-sizes between 5 and 55 mm (43, 19.5, 6.25, 10, 55, 8, 12.5, 24, 15.5, 5, 35 and 29 mm; knot to knot) being 1.5 m high and in total 30 m long (length of each mesh panel is 2.5 m); and the supplementary benthic GN composed of four large mesh-sizes, 90, 135, 70 and 110 mm (knot to knot) being also 1.5 m high and in total 30 m long (length of each mesh panel is 7.5 m). Supplementary benthic GN was included to sample large specimens that are often abundant in fish communities of oxbow lakes in the studied region. Depending on the size, area of the habitats suitable for gillnetting and preliminary assessed fish density, three to five standard benthic GN and two to three large meshed supplementary benthic GN were distributed randomly across the sampling area of each oxbow lake.
GNs were set generally for one to two hours in order to avoid the saturation of nets by fish and the related biases (Olin et al., 2004). Catch of each net was processed separately. Captured fish were identified, counted by species, and measured to total gram wet mass. GN catches were expressed as mean NPUE (number of fish captured per one hour per standard GN setup; standard GN setup represents all the 16 mesh sizes of the standard and supplementary benthic GN between 5 and 130 mm and by down weighting the catch of the supplementary GN also to 2.5 m panel length) and BPUE (mass of fish captured per one hour per standard GN setup) for each oxbow lake.
EF was conducted from a boat along the bank in two 250 m long sections (500 m in total) using a Hans Grassl IG200/2B electrofishing gear (PDC, 50–100 Hz, 350–650 V, max.10 kW; Hans Grassl GmbH, Germany). Catch data for each oxbow were expressed as number of in- dividuals caught for every species.
2.4. eDNA samplings and identification of the taxa
Water samples were collected from a boat by slowly circling around the GN and EF sites in each lake prior to sampling by traditional gears.
Water was filtered in situ (VigiDNA 0.45 μm crossflow filtration capsule, SPYGEN) using disposable sterile tubing attached to a rod in front of the
boat and peristaltic pump. One filter capsule was used in each lake. The mean filtration time per sample and the mean water volume filtered were 11.5 min and 11.9 L (ranged from 3.5 to 26 L), respectively depending on the clogging speed of the filtration capsule. To evaluate a possible influence of the water volume sampled on the species detection, we computed for each site the ratio between the eDNA-based species richness and the cumulated EF and GN species richness. This ratio was independent from the water volume sampled (Pearson correlation, R2 = 0.006, P =0.978). At the end of each filtration, the water in the capsule was drained and the capsule was refilled with 80 ml of conservation buffer CL1 (SPYGEN) to prevent eDNA degradation. The samples were kept at room temperature until DNA extraction.
DNA extraction, amplification using teleo primers (Valentini et al., 2016), PCR purification, high-throughput sequencing and bioinformatic analysis were performed following the protocol described by Pont et al., (2018). For DNA extraction, the filtration capsules were emptied into one 50 ml tube each. The tube was then centrifuged for 15 min at
15,000g. The supernatant was removed with a sterile pipette, leaving 15 ml of liquid at the bottom of the tube. Subsequently, 33 ml of ethanol and 1.5 ml of acetate 3 M Sodium were added to each 50 ml tube. After a quick manual shaking, samples were stored at − 20 ◦C. The tubes were then centrifuged for 15 min at 15,000g and 6 ◦C and the supernatant was discarded. After this step, 360 µl of ATL Buffer of the DNeasy Blood &
Tissue Extraction Kit (Qiagen) were added in the tube, the tube was vortexed and the supernatant was transferred in a 2 ml tube and the DNA extraction was performed using NucleoSpin soil kit (MN) from step 6 following the manufacturer’s instructions. The DNA was eluted with 100 µl of SE buffer twice. DNA amplifications were performed in a final volume of 25 μl, using 3 μl of DNA extract as the template. The ampli- fication mixture contained 1 U of AmpliTaq Gold DNA Polymerase (Applied Biosystems), 10 mM Tris-HCl, 50 mM KCl, 2.5 mM MgCl2, 0.2 mM each dNTP, 0.2 μM “teleo” primers (amplified fragment size c.a. 60 bp), 4 μM human blocking primer for the “teleo” primers and 0.2 μg/μl bovine serum albumin (BSA, Roche Diagnostic, Basel, Switzerland). The Fig. 1.Map of the study area in Hungary with the catchment of the Danube River in Europe (A) and the location of the sampled oxbow lakes along the Danube (D1–D11) and Tisza Rivers (T1-T11) (B). Photographs of four oxbows are also shown (C).
“teleo” primers were 5’-labeled with an eight-nucleotide tag unique to each PCR replicate (with at least three differences between any pair of tags), allowing the assignment of each sequence to the corresponding sample during sequence analysis. The tags for the forward and reverse primers were identical for each PCR replicate. The PCR mixture was denatured at 95 ◦C for 10 min, followed by 50 cycles of 30 s at 95 ◦C, 30 s at 55 ◦C and 1 min at 72 ◦C and a final elongation step at 72 ◦C for 7 min in a room dedicated to amplified DNA with negative air pressure and physical separation from the DNA extraction rooms with positive air pressure. Twelve PCR replicates were performed per sample. To monitor possible contaminants, two negative extraction controls and one nega- tive PCR controls (ultrapure water) were amplified and sequenced in parallel to the samples. After amplification, the samples were titrated using capillary electrophoresis (QIAxcel; Qiagen) and purified using the MinElute PCR purification kit (Qiagen). Before sequencing, purified DNA was titrated again using capillary electrophoresis. The purified PCR products were pooled in equal volumes to achieve a theoretical
sequencing depth of 500,000 reads per sample. One library was pre- pared using the MetaFast protocol (Fasteris, https://www.fasteris.com/
dna/?q=content/metafast-protocol-amplicon-metagenomic-analysis), and paired-end sequencing (2x125 bp) was carried out on an Illumina MiSeq sequencer (Illumina) with the MiSeq Kit v3 (Illumina) following the manufacturer’s instructions. The sequence analysis of the meta- barcodes obtained after the NGS was done as described in Valentini et al.
(2016), using the OBITools package (Boyer et al., 2016). Briefly, forward and reverse reads were assembled using illuminapairedend program.
Subsequently, the ngsfilter program was used to assign the sequences to each sample. A separate dataset was created for each sample by splitting the original dataset in several files using obisplit. Strictly identical se- quences were merged using obiuniq program. Sequences shorter than 20 bp, or occurring less than 10 times per sample or labeled “internal” by the obiclean program, corresponding most likely to PCR errors, were discarded. The program ecotag was used for the taxonomic assignment of sequence with both a local reference database Teleostei (Valentini
Table 1
The collected fish taxa with their abbreviations and their trait-based categorization. Trait abbreviations are as follows: origin refers to the native (N) vs. non-native (NN) origin of taxa; categorization based on vertical habitat use includes benthic (B) vs. non-benthic (NB) taxa; categorization based on life-history strategy contains equilibrium (E), opportunistic (O) and periodic (P) strategist taxa, and taxa showing intermediate life-history features (EO, PE); categorizations based on trophic characteristics includes herbivore (HERB), omnivore (OMN), planktivore (PLA), invertivore-benthivore (INV_BEN), invertivore-piscivore (INV_PIS) and piscivore (PIS) taxa.
Abbreviation Taxa name Origin Vertical habitat
use Life-
history Trophic characteristics Cyprinidae
abrbra Abramis brama (L.) N B P OMN
abrbra_x_rutrut Abramis brama (L.) and Rutilus rutilus (L.) hybrid N B P OMN
albalb Alburnus alburnus (L.) N NB O PLA
balbal-blibjo-
vimvim Ballerus ballerus (L.)_Blicca bjoerkna (L.)_Vimba vimba (L.) group N NB P OMN
carcar Carassius carassius (L.) N B P OMN
cargib Carassius gibelio (Bloch, 1782) NN B P OMN
chonas-telsou Chondrostoma nasus (L.)_Telestes souffia group (Risso, 1827) N B P HER
cteide-hypmol Ctenopharyngodon idella (Valenciennes, 1844)_Hypophthalmichthys molitrix (Valenciennes,
1844) group NN NB P HER_PLA
cypcar Cyprinus carpio (L.) N B P INV_BEN
hypnob Hypophthalmichthys nobilis (Richardson, 1845) NN NB P PLA
leuasp Leuciscus aspius (L.) N NB P PIS
leuidu-leuleu-
pelcul Leuciscus idus (L.)_Leuciscus leuciscus (L.)_Pelecus cultratus (L.) group N NB P OMN
psepar Pseudorasbora parva (Temminck & Schlegel, 1846) NN NB EO OMN
rhoser Rhodeus amarus (Bloch, 1782) N NB EO OMN
rut_sp Rutilus rutilus (L.)_Rutilus pigus virgo (Lacep`ede, 1803) group N NB P OMN
scaery Scardinius erythropthalmus (L.) N NB P OMN
tintin Tinca tinca (L.) N B P OMN
Ictaluridae
amemel Ameiurus melas (Rafinesque, 1820) NN B E INV_BEN
Anguillidae
angang Anguilla anguilla (L.) N B P INV_PIS
Gobiidae
babgym Babka gymnotrachelus (Kessler, 1857) NN B EO INV_BEN
neoflu Neogobius fluviatilis (Pallas, 1814) NN B EO INV_BEN
neomel Neogobius melanostomus (Pallas, 1814) NN B EO INV_BEN
prosem Proterorhinus semilunaris (Heckel, 1837) NN B EO INV_BEN
Cobitidae
cobelo Cobitis elongatoides (B˘acescu & Mayer, 1969) N B O INV_BEN
misfos Misgurnus fossilis (L.) N B O INV_BEN
Esocidae
esoluc Esox lucius (L.) N NB P PIS
Percidae
gym_sp Gymnocephalus baloni (Holcík & Hensel, 1974)_Gymnocephalus cernua (L.)
_Gymnocephalus schraetser (L.) group N B PE INV_BEN
perflu Perca fluviatilis (L.) N NB P INV_PIS
san_sp Sander lucioperca (L.)_Sander volgensis (Gmelin, 1789) group N NB P PIS
Centrarchidae
lepgib Lepomis gibbosus (L.) NN NB E INV_PIS
micsal Micropterus salmoides (Lacep´ede, 1802) NN NB E INV_PIS
Odontobutidae
pergle Perccottus glenii (Dybowski, 1877) NN NB EO INV_PIS
Siluridae
silgla Silurus glanis (L.) N B P PIS
et al., 2016 and Pont et al., in prep, for Danube drainage species) and the sequences extracted from the release 140 (standard sequences), and only sequences with a similarity of higher than 98% were kept. Finally, considering the bad assignments of a few sequences to the wrong sample due to tag-jumps (Schnell et al., 2015), all sequences with a frequency of occurrence below 0.001 per taxon and per library were discarded. The taxonomical nomenclature refers to Kottelat and Freyhof (2007) and FishBase (Froese and Pauly, 2019). Total number of reads per sample was standardized to allow a comparison between sites in terms of rela- tive abundance (Pont et al., 2018).
2.5. Ecological traits
We considered altogether three groups of traits that have been shown to be highly influential on the functional organisation of fish commu- nities (Poff and Allan, 1995; Hoeinghaus et al., 2007; Irz et al., 2007;
Er˝os et al., 2012). The following traits were chosen: (i) life-history strategy, (ii) coarse-scale vertical habitat use (i.e. position in the water column) and (iii) trophic characteristics (Table 1) since they are believed to mediate species responses to environmental change (Er˝os et al., 2012; McLean et al., 2018, 2019).
Life-history strategy was characterised using the system of Wine- miller (1992) and Winemiller & Rose (1992). In this system, (i) periodic strategist species are large-bodied with late maturation, high fecundity, low juvenile survivorship and with no developed parental care and that typically occupy seasonal, periodically suitable environments; (ii) opportunistic strategist species are small-bodied with early maturation, low fecundity and low juvenile survivorship and that typically inhabit unpredictable environments; (iii) equilibrium strategist species are small- to medium bodied fishes with intermediate maturation age, low fecundity, high juvenile survivorship with developed parental care and that typically inhabit constant environments. We used our former works to classify taxa to these main life-history groups and to intermediate classes (Er˝os, 2005; Er˝os et al., 2009a, 2009b, 2012). The joint consid- eration of the other two trait groups, that is position in the water column (i.e. benthic versus non-benthic) and trophic characteristics (e.g. her- bivore, piscivore; see Table 1 for details) inform about the role of a species in ecosystem functioning and biotic relationships. Beside these three trait groups, we also differentiated fishes considering their native versus non-native status, since the response of non-native species to environmental factors may differ substantially from those of native ones (Olden et al., 2006).
2.6. Statistical analyses
Our initial data table contained the raw site-method-taxa informa- tion on thirty-five species, seven species groups and one hybrid in total.
The species groups included two or three closely related species which were not distinguishable by the eDNA method. For making the com- parison of different sampling methods possible, we rearranged those species caught by EF or GN into the eDNA-based species groups. Alto- gether ten species were transposed into species groups. As a result, our final site-method-taxa data table contained thirty-three species/species groups (hereafter, taxa) (for details, see Table 1).
Kruskall-Wallis tests were used for comparing the efficiency of sampling methods in catching taxa and each trait. Efficiency for a single method in a given oxbow lake was characterised as the percentage of the total number of taxa/traits identified with the three methods combined within the respective lake. Multiple pairwise-comparisons among sam- pling methods were also conducted to get information about which pairs of methods are significantly (alpha =0.05) different from each other in catching efficiency.
We used principal coordinate analysis (PCoA) to characterise simi- larities and differences in the taxonomic structure of fish communities of the oxbow lakes using Jaccard and Bray-Curtis indices for compositional (presence/absence) and relative abundance data, respectively. Prior to
the abundance-based analysis, data were Hellinger transformed (Leg- endre and Gallagher, 2001). To analyse trait structure, we applied multiple factor analysis (MFA) on the site-by-traits matrix weighted by the Hellinger-transformed abundance data of the taxa. MFA is a suitable ordination method for trait-based analyses as it can give equal weighting to all groups of variables (i.e. trait-groups in our case) (Pag`es, 2014).
Sampling method was used as a grouping factor with three levels (eDNA, EF, GN) to visualize the relationships between the sampling gears in the ordination plots. In addition, we also used pairwise Procrustes rotation analyses to directly quantify the degree of the congruence between the community structures depicted by the compared sampling methods. The Procrustean fitting is based on a least-squares criterion, which mini- mizes the sum of squared residuals between two configurations, and can be used as a measure of the degree of association between two ordina- tions (Digby and Kempton, 1987; Jackson, 1995; Mykraӓ et al., 2008). A permutation test (ProTest, 999 runs) was then used to assess the statis- tical significance (alpha =0.05) of the Procrustean fit (Peres-Neto and Jackson, 2001).
Separate redundancy analyses (RDA) according to sampling methods were conducted on the data for comparing among-method differences in the community-environment relationships. Variance partitioning in RDA was also used for comparing the relative role of spatial and envi- ronmental variables in predicting the taxon-based community structure.
We used the Hellinger transformed fish abundance data as response variables. Environmental variables scaled in percentages were arcsin√x transformed. For obtaining spatial variables, we ran principal co- ordinates of neighbour matrices (PCNM) analysis based on Euclidean distance among the oxbow lakes (Borcard et al., 2011; Legendre and Legendre, 2012). We retained the PCNM eigenvectors with positive ei- genvalues as spatial explanatory variables. Prior to the RDAs, we computed a forward selection of each explanatory variable group using a permutation-based test (“ordistep” function, 999 runs). Only variables significantly (alpha = 0.1) related to community variability were retained in the final RDA models. Total variation in community structure was subsequently partitioned into the shared environmental and spatial position, the pure environmental, the pure spatial position and the un- explained proportions using adjusted R2 statistics (Borcard et al., 2011;
Legendre and Legendre, 2012). For trait-based data we applied community-weighted mean (CWM)-RDA for characterising the trait re- sponses to environmental factors (Nygaard and Ejrnæs, 2004; Kleyer et al. 2012). Similarly to taxon-based analyses, separate CWM-RDAs were conducted according to the sampling methods. Variance parti- tioning was also applied on the trait-based data in order to differentiate the importance of environmental and spatial variables in an identical way as described for taxon-based analyses. All statistical analyses were performed in R 3.6.1 (R Development Core Team, 2020) using packages
“vegan 2.5.6” (Oksanen et al., 2019), “ade4 1.7.13” (Dray and Dufour, 2007), “FactoMiner 1.42” (Lˆe et al. 2008) and “ape 5.3” (Paradis and Schliep, 2019).
3. Results
In total, 7,670,997 reads were obtained corresponding to 348,682 per sample (range from 228,799 to 566,225). The total number of filtered reads was 6,198,184 for a mean value of 281,736 reads per sample (range from 186,641 to 465,072).
A total of thirty-three taxa were identified after the standardisation of the taxonomic resolution to the level of the eDNA-based taxa reso- lution (Table 1) (see Section 2 for details).
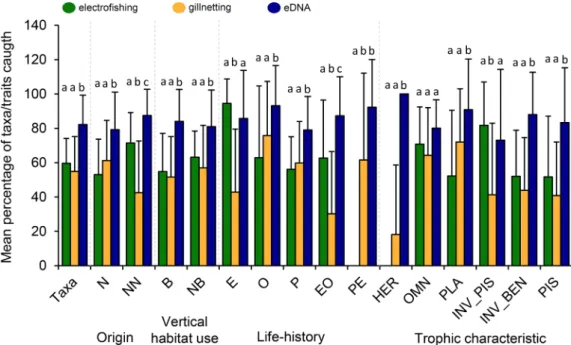
Taxa richness detected in this study varied between five and twenty- four taxa among the oxbow lakes (16.2 ±4.7, mean ±S.D.). Of the total number of detected taxa per lake, 59.6 ±14.5%, 55.0 ±20.2% and 82.2
±17.1% (mean ±S.D.) were caught by EF, GN and eDNA methods, respectively (Fig. 2). Differences between eDNA and the other two methods were significant. On average, 31.4 ±15.8% S.D. of the taxa were detected by all methods simultaneously, while 4.7 ±7.7% (mean
±S.D.), 17.2 ±12.7% and 12.2 ±10.3% were detected by EF and GN, EF and eDNA, and GN and eDNA, respectively. Mean percentage of taxa which were detected only by EF, GN or eDNA were 6.4 ±7.2% S.D., 6.7
±7.3% S.D., and 21.5 ±13.2% S.D., respectively. The eDNA proved to be significantly more effective method than EF and GN in the detection of taxa in eleven traits (Fig. 2). Equilibrium and invertivore-piscivore taxa were caught in a greater proportion by EF, but these differences were significant only between the EF and the GN methods. Periodic- equilibrium taxa were collected only by the eDNA and the GN method. Finally, there were no significant differences among methods in catching omnivore taxa.
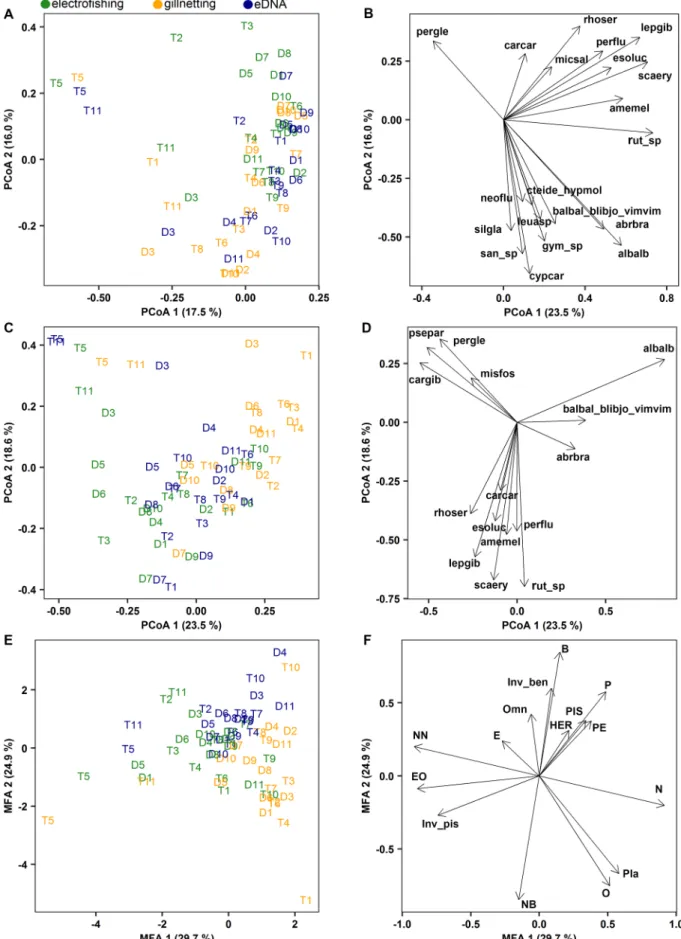
PCoA based on taxonomic composition data showed a moderate separation of communities according to sampling methods along the first two axes (Fig. 3A). A gradient from the EF samples (positive values) to the GN samples (negative values) could be observed along the second axis and eDNA samples concentrated mainly in intermediate position of the ordination plot. While several taxa played a leading role in the separation between the EF and the GN samples in the ordination space (Fig. 3B), the position of the eDNA samples indicated that this method was virtually evenly influenced by all taxa. PCoA based on the abun- dance data of taxa showed similar results to the composition-based one (Fig. 3C), but here the separation of the method-specific samples was more pronounced along the first axis. Importance of taxa that dominated the EF and the GN samples were also similar to responses in composi- tional structure. For example, Rhodeus amarus and Lepomis gibbosus characterised the EF samples, while the abundance of Alburnus alburnus and Ballerus ballerus-Blicca bjoerkna-Vimba vimba group increased in the GN samples (Fig. 3D), and the eDNA method collected various taxa which occurred in either EF or GN samples. Among-method separation of samples based on traits was not as obvious as it was observed for the taxon-based analyses, but similar trends could be observed (Fig. 3E). The GN samples concentrated towards the positive pole of the first ordina- tion axis, while the EF samples gravitated towards the negative values of the gradient. Again, eDNA samples were located in intermediate posi- tion. The GN samples were characterised mainly by native, planktivore and opportunistic taxa, whereas, for example abundance of non-native and equilibrium-opportunistic taxa increased in the EF samples (Fig. 3F). Compared to the other two methods, the eDNA samples were characterised by the increased relative abundance of a variety of traits.
For example, omnivore, invertivore-benthivore, benthic and periodic taxa were collected in a higher relative abundance by eDNA.
In contrast to the differences revealed by the ordination analyses between the methods, results of the Procrustes analyses indicated that the community structures described by each of the methods were significantly congruent (Table 2). The sole exception was the correlation between EF and GN for taxa abundance data, which proved to be insignificant.
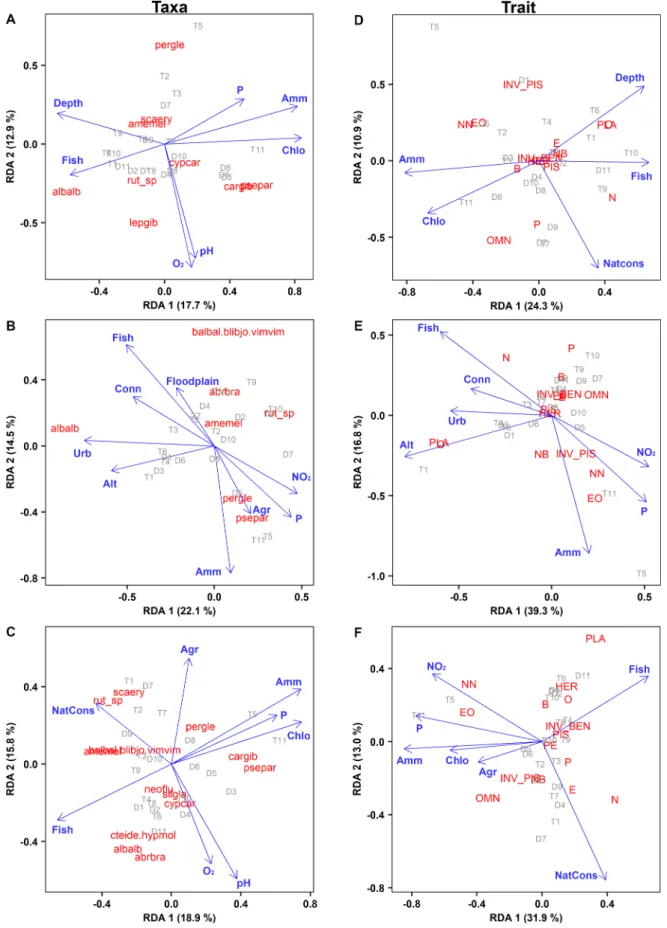
Although the RDAs indicated some variation in the importance of explanatory variables for the taxonomic structure (Fig. 4A–C), the main environmental determinants were rather similar for the three sampling methods. Specifically, the concentration of ammonia and phosphorus, as well as fisheries activity on the lakes proved to be important factors regardless of the sampling method. Similarly, concentration of ammonia and presence of fisheries were significantly important in each of the three analyses in the trait-based RDAs (Fig. 4D–F). In addition, the trait- based RDAs showed strong similarities with their taxon-based RDA pairs. For example depth, concentration of ammonia and chlorophyll-a, as well as presence of fisheries were important in both types of EF data- based analyses (Fig. 4A, D). Similarly, presence of fisheries, connectivity to main channel, altitude, proportion of urban areas around the lakes and concentration of inorganic matter proved to be determinants in GN data-based RDAs (Fig. 4B, E). Finally, nature conservation status, pro- portion of agriculture areas around the lakes, presence of fisheries, as well as concentration of some inorganic matters and chlorophyll-a had significant role in the separation of eDNA samples (Fig. 4C, F).
Variance partitioning analyses in RDAs indicated variable level of predictability of fish communities both between taxon and trait-based analyses and also among sampling methods (Table 3). In taxon-based analyses the residual variances were higher than in trait-based RDAs.
Variance explained by environmental variables obtained from GN and eDNA methods proved to be significant in the analyses of taxon-based data, while importance of environmental variables in EF sample-based analysis did not. Explained variance by spatial variables was not sig- nificant in any of the taxon-based RDAs. In trait-based analyses variance explained by both environmental and spatial variables were significant regardless of the sampling method used.
Fig. 2. Mean (±S.D.) percentage values of taxa richness in the total samples and by trait types collected by electrofishing, gillnetting and eDNA metabarcoding in the 22 oxbow lakes. Distinct letters above the bars indicate significant (P <0.05) among method differences (Kruskall-Wallis pairwise comparisons). For trait code abbreviations, see Table 1 and its caption.
Fig. 3. Principal coordinate analyses of the sampled 22 oxbow lakes (D1-D11 and T1-T11) based on taxa composition (presence/absence) (A) and relative abundance of taxa (C), and their associated taxa loadings (B, D). Multiple factor analysis of the sampled 22 oxbow lakes (D1-D11 and T1-T11) based on relative abundance of traits (E) and their associated trait loadings (F). Only significant (P <0.1) taxa and trait loadings are shown. Coloured site codes indicate samples collected by electrofishing, gillnetting, and eDNA metabarcoding. For taxa and trait code abbreviations, see Table 1 and its caption.
4. Discussion
The degree to which the collected sample represents the structure of the real community is of central importance in both fundamental and applied ecology. In this regard, we found a wide spectrum of congruence (i.e. weak, moderate and strong) among the sampling methods, the strength of which depended on both the examined community level variable and the compared sampling method pairs (i.e. GN vs. EF, GN vs.
eDNA, EF vs. eDNA). We also found that, in general, eDNA meta- barcoding covered the widest taxon range, which suggests that this method can provide higher representativeness of community structure than the two traditional methods. Below we evaluate the findings for each community level variable both taxonomic and trait-based, with special regard to the congruence of the methods in characterising communities or community-environment relationships.
Taxa richness is the most fundamental variable of community structure; thus, not surprisingly, most eDNA-based studies deal with its determination. These studies found that eDNA-based surveys perform well in detecting taxa, and in fact, in many cases outperform traditional survey methods (e.g. Bylemans et al., 2017; Goutte et al., 2020; Zou et al., 2020). Nevertheless, despite the large overlap between taxa sets identified by the eDNA and other traditional methods, both the eDNA metabarcoding and the traditional methods detected taxa that were unique to one of the sampling methods in almost all studies (McElroy et al., 2020). Here, we found that eDNA outperformed both EF and GN- based surveys in detecting taxa both in the total samples and in a variety of trait types, confirming former findings. Both EF and GN can be se- lective for specific taxa, especially in large and deep water bodies (Er˝os et al., 2009a, 2009b). EF is effective only in less than 1–2 m deep hab- itats, and usually underestimates the proportion of benthic species. On the other hand catching effectiveness of GN depends largely on the ac- tivity and morphology of fishes and this method under-records species restricted to very shallow water (Lawson Handley et al., 2019).
Conversely, eDNA metabarcoding surveys are free of these restraints and this sampling method has been shown to be more effective in species detection than other methods, especially in deep and large lakes where traditional fishing gears fail to represent community structure properly (Civade et al., 2016; H¨anfling et al., 2016; Lawson Handley et al., 2019).
It is important that our field surveys were limited to spring, and eDNA concentrations of water bodies can vary seasonally (de Souza et al., 2016). However, seasonal changes in the environment can also largely influence the efficiency of traditional sampling methods. Thus, our re- sults suggest that eDNA metabarcoding can be a more powerful method of the detection of taxa in the total samples and by trait types than single traditional sampling methods. Detection of taxa by eDNA can be espe- cially effective in relatively small and narrow lakes (such as examined in this study) where distribution of eDNA can be relatively homogeneous
compared with large and deep lakes (Evans et al., 2017; Lawson Handley et al., 2019).
The Procrustes analyses indicated variability in the correlation strength among the pairs of the sampling methods in characterising between lake community patterns. Specifically, the EF and the GN showed the highest discrepancy for both the presence/absence and the relative abundance data, and the eDNA-based community pattern al- ways showed higher correlation with either the EF or the GN-based community patterns than the traditional methods to each other. The results were similar for the trait-based comparisons, with the only minor exception that here the EF and the GN and the EF and the eDNA com- parisons similarly showed moderate level correlation, while the GN and eDNA-based comparison showed a strong correlation. Several studies showed that fish community structures based on GN or EF samples can differ largely (e.g. Goffaux et al., 2004; Sutela and Vehanen, 2008).
Moreover, the degree of the difference can be so pronounced, that variation in fish community structure might reflect the differences be- tween sampling methods rather than real differences in fish commu- nities between habitats (Eros et al., 2009a, 2009b). Results of PCoA and ˝ MFA indicated that communities characterised by the eDNA showed an intermediate position between the EF and GN samples in the ordination plots. Consequently, given that the real structure of fish stocks is un- known, and since neither the EF nor the GN can estimate that accurately, the eDNA-based characterisation may present the best single compro- mise, which provide the most accurate picture of community structure (Fujii et al., 2019; Li et al., 2019; Sard et al 2019). It is important to emphasize that the results were relatively similar regardless of the community level data used in the analyses (i.e. taxon-based composition and relative abundance, trait-based structure). This is an important finding and confirms the general applicability of eDNA metabarcoding in the characterisation of either taxon or trait-based metacommunity patterns.
Variance partitioning in direct ordination is one of the most commonly used method for drawing inferences on the organisation of metacommunities, since it can tease apart the role of environmental factors on community structure and spatial autocorrelation caused by dispersal mechanisms (Cottenie, 2005; Beisner et al., 2006; Meynard et al., 2013). We found that the importance of environmental and spatial variables in shaping community structure differed largely between the sampling methods. These results thus suggest that the sampling method (EF, GN, eDNA) can largely influence the suspected mechanisms which govern fish metacommunity organisation. However, to our knowledge no study to date has tested this question comparing the results of traditional (i.e. EF or GN) and eDNA metabarcoding-based collections.
Based on these results we put ecologists on guard to draw meaningful conclusion about the mechanisms driving fish metacommunities based on a single collection methodology (see also e.g. Eggleton et al., 2010;
Fischer and Quist, 2014). In this regard, it is compelling for example how pronounced are the differences between the results of EF (which is one of the most generally used fish collection methods, see e.g. Bur- khardt and Gutreuter, 1995; Miranda, 2005) and eDNA sampling in case of both taxonomic and trait-based analyses. In both cases the total explained variance is almost the same for both EF and eDNA-based an- alyses, but the importance of environmental and spatial variables differ largely. For example, for the trait-based structure one may erroneously conclude that dispersal related mechanisms (e.g. mass effect, dispersal limitation) have an overarching importance over the local environment (niche-based mechanisms) based on the results of EF collections. On the contrary, eDNA metabarcoding indicated the predominance of niche- based mechanisms over dispersal in structuring lake fish metacommunities.
Testing the congruency between taxon and trait-based patterns and their governing mechanisms is an intensively studied topic in commu- nity ecology, and studies show that their congruency can vary largely (e.
g. Finn and Poff, 2005; Heino et al., 2007, 2013; Hoeinghaus et al., 2007;
G¨othe et al., 2017). Our results showed considerable differences Table 2
Results of the pairwise Procrustes rotation analyses between sampling methods for taxa composition, relative taxa abundance structure and relative trait abundance structure. Abbreviations: EF, electrofishing; GN, gillnetting; eDNA, eDNA metabarcoding.
Taxa composition
Method m12 square correlation P-value
EF vs. GN 0.704 0.54 0.005
EF vs. eDNA 0.574 0.65 0.001
eDNA vs. GN 0.626 0.61 0.001
Relative taxa abundance structure
EF vs. GN 0.895 0.32 0.213
EF vs. eDNA 0.572 0.65 0.001
eDNA vs. GN 0.798 0.45 0.017
Relative trait abundance structure
EF vs. GN 0.668 0.58 0.002
EF vs. eDNA 0.735 0.51 0.005
eDNA vs. GN 0.510 0.70 0.001
Fig. 4.Redundancy analysis of the sampled 22 oxbow lakes (D1-D11 and T1-T11) based on the relative abundance data of taxa and traits collected by electrofishing (A, D), gillnetting (B, E) and eDNA metabarcoding (C, F), and their determining environmental variables (P <0.1) (abbreviations: Fish, presence of fishery activity on the lake; Amm, concentration of ammonium; P, concentration of ortho-phosphate; Chlo, concentration of Chlorofill-a; Conn, presence of connectivity to the main channel; Alt, altitude; NatCons, presence of nature conservation on the lake; Floodplain, lakes located in the floodplain of the main channel; Agr, agriculture area around the lake; Urb, urban area around the lake; see Appendix for more details). For taxa and trait code abbreviations, see Table 1 and its caption. Note that less determinate taxa (i.e. grouped around the origo) were not included into the taxa-based plots for a better transparency.
between taxon and trait-based analyses. Specifically, trait-based struc- ture could be more effectively predicted with environmental and spatial variables than taxon-based structure (i.e. the total explained variance was higher for trait-based analyses), and the relative importance of the variable groups (i.e. environmental, spatial and shared) also varied be- tween taxon and trait-based analyses (and also among sampling methods as emphasized above). However, it is important to note that differences between taxon and trait-based results in the variance explained can reflect methodological differences between taxon and trait-based analyses, since traits contain less variables, resulting in much lower total inertia for trait-based structure, which increases predictive power in the models (Heino et al., 2007). In this regard all sampling methods showed consistent results.
The most determinant environmental variables of taxon and trait- based structure were more or less the same independently of the sam- pling methods. For example, the importance of inorganic nutrient load and fisheries activity were among the most important determinants of community structure, which corresponds with other studies on lake fish communities (Mehner et al., 2005; Olin et al., 2013; Miranda et al., 2014). However, interestingly, the importance of spatial variables was higher for both EF and GN samplings than for eDNA sampling in the trait-based study, where environmental factors proved to be more determinant. Although the detailed exploration of this finding warrants further investigations, we speculate that higher taxa selectivity of the traditional methods might have caused larger disparities in taxa occur- rence patterns, which might have been manifested erroneously as spatial effect in the models. However, this spatial effect can be an artefact in light of the results of eDNA, which method was in general more effective in detecting taxa in individual lakes (H¨anfling et al., 2016).
In conclusion, this study shows that eDNA metabarcoding may pre- sent the best compromised sampling method for characterising between- lake fish community patterns and community-environment relation- ships. Nevertheless, the large differences among the sampling methods (EF, GN, eDNA) in the predicted role of environmental and spatial variables in shaping taxonomic and trait-based structure may question the reliability of single method surveys, especially which are based on traditional collection gears. We predict that with further developments, eDNA metabarcoding can be the best universal method for drawing in- ferences on the organisation of fish metacommunities.
Declaration of Competing Interest
The authors declare that they have no known competing financial interests or personal relationships that could have appeared to influence the work reported in this paper.
Acknowledgements
This work was supported by the ANN-OTKA 135082 grant and the Austrian Science Fund (FWF) project RIMECO (I 5006). We would like to express our thanks to Attila M´orocz, ranger of the Danube-Drava ´
National Park for his kind help in the field work.
Appendix A. Supplementary material
Supplementary data to this article can be found online at https://doi.
org/10.1016/j.ecolind.2021.107952.
References
Antognazza, C.M., Britton, R.J., Read, D.S., Goodall, T., Mantzouratou, A., De Santis, V., Davies, P., Aprahamian, M., Franklin, E., Hardouin, E.A., Andreou, D., 2021.
Application of eDNA metabarcoding in a fragmented lowland river: Spatial and methodological comparison of fish species composition. Environ. DNA 3 (2), 458–471. https://doi.org/10.1002/edn3.v3.210.1002/edn3.136.
Beisner, B.E., Peres-Neto, P.R., Lindstr¨om, E., Barnett, A., Longhi, M.L., 2006. The role of dispersal in structuring lake communities from bacteria to fish. Ecology 87, 2895–2991. https://doi.org/10.1890/0012-9658(2006)87[2985:TROEAS]2.0.CO;2.
Blackman, R.C., Osathanunkul, M., Brantschen, J., Di Muri, C., Harper, L.R., M¨achler, E., H¨anfling, B., Altermatt, F., 2021. Mapping biodiversity hotspots of fish communities in subtropical streams through environmental DNA. Sci. Rep. 11, 10375. https://doi.
org/10.1038/s41598-021-89942-6.
Boitani, L., Fuller, T., 2000. Research Techniques in Animal Ecology: Controversies and Consequences. University Press, New York.
Borcard, D., Gillet, F., Legendre, P., 2011. Numerical Ecology with R. Springer, New York.
Boyer, F., Mercier, C., Bonin, A., Le Bras, Y., Taberlet, P., Coissac, E., 2016. obitools: a unix-inspired software package for DNA metabarcoding. Mol. Ecol. Resour. 16, 176–182. https://doi.org/10.1111/1755-0998.12428.
Burkhardt, R.W., Gutreuter, S., 1995. Improving electrofishing catch consistency by standardizing power. North Am. J. Fish. Manage. 15 (2), 375–381. https://doi.org/
10.1577/1548-8675(1995)015<0375:IECCBS>2.3.CO;2.
Bylemans, J., Furlan, E.M., Hardy, C.M., McGuffie, P., Lintermans, M., Gleeson, D.M., 2017. An environmental DNA-based method for monitoring spawning activity: a case study, using the endangered Macquarie perch (Macquaria australasica).
Methods Ecol. Evol. 8, 646–655. https://doi.org/10.1111/2041-210X.12709.
Cadotte, M.W., 2017. Functional traits explain ecosystem function through opposing mechanisms. Ecol. Lett. 20 (8), 989–996. https://doi.org/10.1111/ele.2017.20.
issue-810.1111/ele.12796.
Cao, Y., Williams, D.D., Larsen, D.P., 2002. Comparison of ecological communities: the problem of sample representativeness. Ecol. Monogr. 72 (1), 41–56. https://doi.org/
10.1890/0012-9615(2002)072[0041:COECTP]2.0.CO;2.
Civade, R., Dejean, T., Valentini, A., Roset, N., Raymond, J.-C., Bonin, A., Taberlet, P., Pont, D., Garcia de Leaniz, C., 2016. Spatial representativeness of environmental DNA metabarcoding signal for fish biodiversity assessment in a natural freshwater system. PLoS ONE 11 (6), e0157366. https://doi.org/10.1371/journal.
pone.0157366.
Coble, A.A., Flinders, C.A., Homyack, J.A., Penaluna, B.E., Cronn, R.C., Weitemier, K., 2019. eDNA as a tool for identifying freshwater species in sustainable forestry: a critical review and potential future applications. Sci. Total Environ. 649, 1157–1170.
https://doi.org/10.1016/j.scitotenv.2018.08.370.
Cottenie, K., 2005. Integrating environmental and spatial processes in ecological community dynamics. Ecol. Lett. 8, 1175–1182. https://doi.org/10.1111/j.1461- 0248.2005.00820.x.
Cowx, I.G., 1996. Stock Assessment in Inland Fisheries. Fishing News Books, Blackwell Science, Oxford.
Cuffney, T.E., Gurtz, M.E., Meador, M.R., 1993. Methods for collecting benthic invertebrate samples as part of the National Water-Quality Assessment Program, first ed. US Geological Survey, Raleigh, North Carolina, Open-File Report, pp. 93–406.
de Souza, L.S., Godwin, J.C., Renshaw, M.A., Larson, E., 2016. Environmental DNA (eDNA) detection probability is influenced by seasonal activity of organisms. Plos One 11 (10), e0165273. https://doi.org/10.1371/journal.pone.0165273.
Digby, P.G.N., Kempton, R.A., 1987. Multivariate Analysis of Ecological Communities.
Chapman and Hall, New York.
Dray, S., Dufour, A., 2007. The ade4 package: implementing the duality diagram for ecologists. J. Stat. Softw. 22, 1–20. https://doi.org/10.18637/jss.v022.i04.
Eggleton, M.A., Jackson, J.R., Lubinski, B.J., 2010. Comparison of gears for sampling littoral-zone fishes in floodplain lakes of the Lower White River. Arkansas. North Am. J. Fish. Manage. 30 (4), 928–939. https://doi.org/10.1577/M09-127.1.
Er˝os, T., 2005. Life-history diversification in the Middle Danubian fish fauna: a conservation perspective. Large Rivers 16 (1–2), 289–304. https://doi.org/10.1127/
lr/16/2005/289.
Er˝os, T., Speczi´ar, A., Bír´o, P., 2009a. Assessing fish assemblages in reed habitats of a large shallow lake—a comparison between gillnetting and electric fishing. Fish. Res.
96 (1), 70–76. https://doi.org/10.1016/j.fishres.2008.09.009.
Er˝os, T., Heino, J., Schmera, D., Rask, M., 2009b. Characterizing functional trait diversity and trait-environment relationships in fish assemblages of boreal lakes. Freshwater Biol. 54, 1788–1803. https://doi.org/10.1111/j.1365-2427.2009.02220.x.
Er˝os, T., S´aly, P., Tak´acs, P., Speczi´ar, A., Bír´o, P., 2012. Temporal variability in the spatial and environmental determinants of functional metacommunity organization – stream fish in a human-modified landscape. Freshwater Biol. 57, 1914–1928.
https://doi.org/10.1111/j.1365-2427.2012.02842.x.
Evans, N.T., Li, Y., Renshaw, M.A., Olds, B.P., Deiner, K., Turner, C.R., Jerde, C.L., Lodge, D.M., Lamberti, G.A., Pfrender, M.E., 2017. Fish community assessment with Table 3
Results of the variance partitioning analyses (% explained and residual variance) for the relative abundance of taxa and traits collected by electrofishing (EF), gillnetting (GN) and eDNA metabarcoding (eDNA).
Environment Spatial Environment +Spatial Residual
Taxa EF 11.1 6.6 8.1 74.2
GN 29.3** – 3.4 67.8
eDNA 27.9*** 0.3 1.7 70.0
Trait EF 18.3* 22.2** 6.3 53.2
GN 35.3*** 24.4** 6.7 33.6
eDNA 39.8** 6.2* – 54.2
*P <0.05.
**P <0.01.
***P <0.001.