Pharmaceutics 2021, 13, x. https://doi.org/10.3390/xxxxx www.mdpi.com/journal/pharmaceutics
Article 1
Physicochemical and in vitro characterization of chitosan-based
2microspheres intended for nasal administration
3Csilla Bartos1, Patrícia Varga1, Piroska Szabó-Révész1, Rita Ambrus1 4
1 Institute of Pharmaceutical Technology and Regulatory Affairs, Faculty of Pharmacy, University of Szeged, 5 Szeged, Hungary; bartoscsilla@pharm.u‐szeged.hu (B.CS.), varga.patricia@szte.hu (V.P.); 6
revesz@pharm.u‐szeged.hu (S‐R.P.); ambrus.rita@szte.hu (A.R.) 7
* Correspondence: bartos.csilla@szte.hu 8
Abstract: The absorption of non‐steroidal anti‐inflammatory drugs (NSAIDs) through the nasal 9 epithelium offers an innovative opportunity in the field of pain therapy. Thanks to the bonding of 10 chitosan to the nasal mucosa and its permeability‐enhancing effect, it is an excellent choice to for‐ 11 mulate microspheres for the increase of drug bioavailability. The aim of our work includes the 12 preparation of spray‐dried cross‐linked and non‐cross‐linked chitosan‐based drug delivery sys‐ 13 tems for intranasal application, the optimization of spray‐drying process parameters (inlet air 14 temperature, pump rate) and the composition of samples. Cross‐linked products were prepared 15 by using different amounts of sodium tripolyphosphate. On top of these, the micrometric proper‐ 16 ties, the structural characteristics, the in vitro drug release and the in vitro permeability of the 17 products were studied. Spray‐drying resulted in micronized chitosan particles (2‐4 μm) regardless 18 of the process parameters. The meloxicam (MEL)‐containing microspheres showed nearly spheri‐ 19 cal habit while MEL was present in a molecularly dispersed state. The highest dissolved (>90%) 20 and permeated (~45 ug/cm2) MEL amount was detected from the non‐cross‐linked sample. Our 21 results indicate that spray‐dried MEL‐containing chitosan microparticles may be recommended 22 for the development of a novel drug delivery system to decrease acute pain or enhance analgesia 23
by intranasal application. 24
Keywords: nasal administration; spray‐drying; chitosan; microsphere; meloxicam 25 26
1. Introduction 27
Nasal drug delivery provides an opportunity not merely to treat local pathological 28 conditions (e.g. allergic rhinitis, nasal congestion) but also to deliver active pharmaceu‐ 29 tical ingredients (APIs) to the systemic circulation or directly through the blood‐brain 30 barrier to the central nervous system [1]. The nose respiratory region is crucial from the 31 aspect of systemic drug absorption. Drugs administered intranasally bypass the 32 first‐pass hepatic metabolism, thus side‐effects are avoided and the large surface and the 33 high vascularization of the mucosa causes the rapid onset of action [2,3]. Since it is an 34 easily accessible, non‐invasive and painless option for systemic therapies, it is well ac‐ 35 cepted by patients [4]. However, there are some limitations that need to be taken into 36 account. Firstly, mucosa sensitivity can not be neglected, thus, drugs and excipients 37 intended for intranasal delivery must not be irritant and definitely not toxic [5]. The 38 mucociliary clearance is a key determinant concerning the APIs residence time. The 39 mucus layer renews in every 15‐20 minutes (min.), so to prolong the APIsʼ contact time 40 the use of mucoadhesive polymers can be considered. The low permeability of the mu‐ 41 cosa raises another problem that needs to be solved [6–8]. 42 Nasal sprays, drops, gels and ointments are extremely popular and widely used. 43 Unfortunately, only few nasal powders are accessible on the market, however, they have 44 Citation: Lastname, F.; Lastname, F.;
Lastname, F. Title. Pharmaceutics 2021, 13, x.
https://doi.org/10.3390/xxxxx
Academic Editor: Firstname Last‐
name
Received: date Accepted: date Published: date
Publisher’s Note: MDPI stays neutral with regard to jurisdictional claims in published maps and institutional affiliations.
Copyright: © 2021 by the authors.
Submitted for possible open access publication under the terms and conditions of the Creative Commons Attribution (CC BY) license (http://creativecommons.org/licenses /by/4.0/).
highly beneficial properties over the aforementioned formulations. Since nasal powders 45 do not contain moisture and their physical stability is better concerning liquid and 46 semi‐solid formulations, therefore they can be prepared without using preservatives 47 [9,10]. Moreover, they are eliminated slowly from the nasal cavity, because the better 48 adhesion allows a longer time period for the API absorption [11]. Particle size, mor‐ 49 phology or rheological features must be taken into consideration during the nasal pow‐ 50
der formulation [12,13]. 51
Chitosan is a semi‐synthetic polymer which is obtained by chitin deacetylation and 52 mostly it is found in crustaceans or in mushroom cell walls [14]. It plays a key role in the 53 biomedical field due to its advantegous properties. Chitosan and its derivatives as mi‐ 54 cro‐ or nanoparticles can be used for the targeted or controlled delivery of antibiotics, 55 antitumor drugs, proteins or vaccines. They are highly suitable for tissue engineering 56 and wound healing based on their stimulating effect on cell proliferation and tissue re‐ 57 generation. In terms of nasal administration, chitosan’s biocompatibility – which is due 58 to the non‐toxicity of its degradation products to the human body – and mucoadhesive 59 characteristics are preferred. Due to the cationic nature of chitosan, an ionic bond can be 60 formed by the interaction between the negatively charged substructures of the mucus 61 layer and chitosan, enabling mucoadhesion [15,16]. The positive charge interacts with 62 tight junction‐ associated proteins as well causing the distance growth between epithe‐ 63 lial cells and enhancing the permeation property of chitosan [17]. Chitosan‐based drug 64 delivery systems are widely used for achieving controlled drug release. It has been re‐ 65 ported that by using cross‐linking agents an increased stability could be accomplished 66 [18]. Glutaraldehyde and formaldehyde were used mainly as cross‐linkers but for their 67 toxic quality, sodium tripolyphosphate (TPP) may be a more conspicuous alternative 68 [19]. It possesses a negative charge, so ionic bond is developed between TPP and chito‐ 69
san [20,21]. 70
Non‐steroidal anti‐inflammatory drugs (NSAIDs) are essential in relieving acute 71 pain or enhancing analgesia as adjuvants to opioids [22,23]. The intranasal application of 72 NSAIDs may offer an opportunity to attain a rapid analgesic effect by their absorption 73 through the nasal mucosa to the systemic circulation [24]. During the formulation of 74 NSAIDs, it is inevitable to solve their solubility problems, which can result in dose re‐ 75 duction that leads to decreased side effects together with their bioavailability im‐ 76 provement [25]. Several technological methods are available for modifying the phys‐ 77 ico‐chemical properties and increasing the dissolution rate of NSAIDs [26–28]. 78 Spray‐drying is a one‐step production method which can be applied to change the dis‐ 79 solution properties of a drug and provides an opportunity to prepare microspheres that 80 match nasal requirements. This technique allows the control of particle properties such 81 as their shape and size in a rapid and reproducible way [29,30]. It looks promising to 82 create nasal formulations by spray‐drying for pain relief with adequate dissolution 83 properties, however, there has not been any available literatures on this topic so far. 84 In our work, meloxicam (MEL) was chosen as a NSAID. It is used in joint disease 85 therapy and serves as a favorable option because of its side‐effect profile. A 86 MEL‐containing nasal formulation may provide an opportunity to ease the pain alone or 87 to potentiate the effects of opioids. In our previous research works MEL‐ and meloxicam 88 potassium monohydrate‐containing spray and gel forms were prepared and investi‐ 89 gated. The goal of this study was to design MEL‐containing mucoadhesive intranasal 90 microparticles to increase the residence time and bioavailability of drugs by enhancing 91 their dissolution and permeation. Chitosan microspheres were produced by 92 spray‐drying process setting the parameters in order to acquire an energy‐saving and a 93 quick preparation method. The effect of a lower inlet air temperature (90 °C) – 94 lesser‐known in the literature – was compared with higher air temperatures. Further‐ 95 more, we optimized the composition of the formulation intended for nasal application 96 by preparing MEL‐incorporated chitosan‐based microparticles and adding different 97 amounts of TPP as a cross‐linking agent. Particle size, morphological and rheological 98
properties of the products ensured nasal deposition. The physico‐chemical properties, in 99 vitro dissolution and diffusion were determined and evaluated. 100
2. Materials and Methods 101
2.1. Materials 102
MEL was from EGIS Ltd. (Budapest, Hungary). Low molecular weight chitosan 103 (Mw = 3800‐20,000 Da) was obtained from Sigma Aldrich (Sigma Aldrich Co. LLC, St. 104 Louis, MO, USA), TPP was purchased from Alfa Aeasar Co. (Alfa Aeasar GmbH & Co. 105 KG, Karlsruhe, Germany). Dimethyl sulfoxide was from VWR Chemicals BDH Prolabo 106 and Acetic acid was from Molar Chemicals Ltd. (Budapest, Hungary). 107
2.2. Methods 108
2.2.1. Preparation of spray‐dried products 109
Optimizing process parameteres, 1% acetic acid chitosan solution was spray‐dried 110 using Büchi Mini Dryer B‐191 (Switzerland) applying inlet air temperature of 90, 120 111 and 150 °C and pump rate of 5, 10 and 15 ml/min. Aspirator capacity was 75% (Table 1). 112 Afterwards, to optimize the composition of the formulation, the feeding emulsions were 113 prepared of 50 ml 1% chitosan solution, 3.75 ml 4% MEL‐dimethyl sulfoxide (DMSO) 114 solution and 0, 1 or 2 ml of 1% aqueous solution of TPP applying the optimal parameters 115 (Table 2). The physical mixtures (PMs) of chitosan, MEL and TPP were produced as the 116 control samples in the same mass ratio similarly to the spray‐dried products. After 117
spray‐drying the percentage yield was determined. 118
Table 1. Spray‐drying process parameters 119
Inlet air temperature [°C] 90 120 150 Pump rate [ml/min] 5 10 15
Table 2. Composition of solutions for spray‐drying 120
1% chitosan solution [ml] 50 50 50 50 50 50
1% aqueous TPP solution [ml] ‐ 1 2 ‐ 1 2
4% MEL-DMSO-solution [ml] ‐ ‐ ‐ 3.75 3.75 3.75
2.2.2. Size distribution by Laser diffraction 121
The particle‐size distribution of the spray‐dried samples was measured by laser 122 scattering (Malvern Mastersizer Sirocco 2000, Malvern Instruments Ltd, UK). The meas‐ 123 urements were carried out at 3 bar pressure and 75% frequency, air was used as a dis‐ 124 persion medium. Approximately 1 g of product was tested in one measurement, and 125 each measurement was performed 3 times. D0.1, D0.5 and D0.9 values were determined 126 as the diameter of the particles below which 10, 50 and 90 volume percentage of the par‐ 127
ticles exist. 128
2.2.3. Scanning electron microscopy (SEM) 129
The shape and surface morphology of the spray‐dried particles was visualized by 130 SEM (Hitachi S4700, Hitachi Scientific Ltd., Tokyo, Japan). Under an argon atmosphere, 131 the samples were sputter‐coated with gold‐palladium in a high‐vacuum evaporator with 132 a sputter coater and they were examined at 10 kV and 10 μA. The air pressure was 133
1.3–13 MPa. 134
2.2.4. Density measurement 135
The bulked and tapped densities of the formulations were measured using the 136 Engelsmann Stampfvolumeter (Ludwigshafen, Germany) [31]. A 10 cm3 cylinder was 137 filled with 1.5‐2.0 cm3 powder to calculate bulk density. Then it was tapped 1000 times. 138 Compared to the volume before and after the taps we calculated the tapped density of 139 the samples. We calculated the flow characters of the samples from the bulk (ρb) and 140
tapped (ρt) density (Equation 1): 141
(1)
2.2.5. Structural analyses 142
The thermal analysis was executed with a Mettler Toledo DSC 821e (Germany) 143 system with the STARe program V9.1 (Mettler Inc., Schwerzenbach, Switzerland). 144 Approximately 2–5 mg of samples were heated from 25 °C to 300 °C applying 10 145
°C·min−1 heating rate under a constant argon flow of 10 l·h−1. Physical mixtures of 146 chitosan, MEL and TPP in the same mass ratio as the spray‐dried samples contained 147 were mixed in a Turbula mixer (Turbula WAB, Systems Schatz, Switzerland) at 50 rpm 148
for 10 minutes and were applied as control samples. 149
XRPD was performed to investigate the physical state of MEL in the samples with a 150 Bruker D8 Advance diffractometer (Bruker AXS GmbH, Karlsruhe, Germany) with Cu K 151 λI radiation (λ = 1.5406 Å). The samples were scanned at 40 kV and 40 mA with an 152 angular range of 3° to 40° 2θ. Si was used to calibrate the instrument. DIFFRACTPLUS 153 EVA software was used to perform the manipulations: Kα2‐stripping, background 154
removal and smoothing. 155
2.2.6. Fourier‐transformed infrared spectroscopy (FT‐IR) 156 For the purpose of determining whether the cross‐linking and incorporation was 157 successful, the FT‐IR spectra of the samples was recorded on an AVATAR330 FT‐IR 158 spectrometer (Thermo Nicolet, Unicam Hungary Ltd., Budapest, Hungary) in the inter‐ 159 val 400–4000 cm−1, at an optical resolution of 4 cm‐1. Samples were grounded and com‐ 160
pressed into pastilles at 10 t with 0.15 g of KBr. 161
2.2.7. Rheological investigations 162
Rheological measurements were carried out at 32°C with HAAKE RheoStress 1 163 Rheometer (HAAKE GmbH., Germany). Cone and plate geometry was used to study the 164 rheological profile of the samples. The flow curve of the samples was determined by ro‐ 165 tation tests controlled shear rate. The shear rate was increased from 0.1 to 100 1/s in con‐ 166
trolled rate mode. 167
2.2.8. In vitro dissolution 168
The European Pharmacopoeia (6th Edition) paddle method (USP dissolution appa‐ 169 ratus, type II Pharma Test, Heinburg, Germany) was applied to appoint the dissolution 170 of MEL. 50 ml of phosphate buffer solution (pH 5.6 ± 0.1) at 30 ± 0.5 °C was used as a 171 dissolution medium. Taking into account the drug content of the microparticles samples 172 containing 6 mg of MEL were dispersed. The rotation speed of the paddles was 100 rpm. 173 At predetermined intervals, the amount of dissolved MEL was determined by spectro‐ 174 photometry (UNICAM UV/Vis Spectrometer, Germany) at 364 nm. The in vitro drug re‐ 175 lease data of products were evaluated kinetically using various mathematical models 176 such as zero order, first order, Higuchi, Hixon–Crowell and Korsmeyer‐Peppas model 177
[32]. 178
2.2.9. In vitro permeability 179
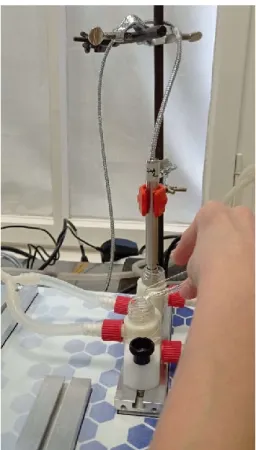
The In vitro permeability of MEL was studied on a modified horizontal diffusion 180 model which simulated the nasal cavity circumstances (Figure 1). Samples containing 6 181
mg of MEL were added to the donor phase (9 ml) which was simulated nasal electrolyte 182 solution (SNES) of pH 6.0 ± 0.1 (represented the nasal cavity). Half amount of the SNES 183 was put into the donor chamber and with its other half the sample was washed in the 184 donor phase. PB of pH 7.40 ‐ which corresponded with the pH of the blood ‐ was used as 185 the acceptor phase (9 ml). The two chambers were divided by a synthetic membrane 186 (Whatman® regenerated cellulose membrane filter with 0.45 μm pores) that was soaked 187 in isopropyl myristate before the investigation. It modelled the lipophilic mucosa be‐ 188 tween the phases. The temperature of the phases was 30 °C (Thermo Haake C10‐P5, 189 Sigma, Aldrich Co.) and the rotation rate of the stir‐bars was set to 100 rpm. The amount 190 of MEL diffused to the acceptor phase was determined spectrophotometrically at 364 nm 191 in real time with an AvaLight DH‐S‐BAL spectrophotometer (AVANTES, Netherlands). 192
Each measurement was carried out in triplicate. 193
194
Figure 1. Illustration of in vitro permeability investigation 195
3. Results 196
3.1. Particle size distribution 197
The analysis of the results measured by laser diffraction revealed the fact that by 198 changing the process parameters, the average particle size of spray‐dried products was 199 approximately between 2‐4 μm. Since the inlet air temperature and pump rate did not 200 have any effect on the size distribution of chitosan microspheres (Table 3), we chose the 201 mild 90 °C inlet air temperature (requiring the least heat energy) and the relatively quick 202 10 ml/min pump rate to produce the cross‐linked and MEL‐containing particles. At 203 15 ml/min pump rate there was not sufficient time for the atomized drops to dry, so they 204 stuck to the column wall. The usage of TPP as a cross‐linking material did not have any 205 impact on the sizes of drug‐free chitosan particles, however there was a noticeable 206 increase in the size of MEL‐containing particles, especially when the volume of 207 TPP‐solution was boosted (Table 4). Based on the literature data, the produced product 208
size is considered to be an appropriate one for nasal administration [33]. The yields of 209 the samples were between 38‐64% concerning the MEL‐free products and they reached 210 the 29‐48% range regarding the MEL‐containing microspheres. 211
Table 3. Optimization of the process parameters 212
Sample 1 2 3 4 5 6 7 8 9
Inlet air temperature [°C] 90 120 150 90 120 150 90 120 150 Pump rate [ml/min] 5 5 5 10 10 10 15 15 15
Aspirator [%] 75 75 75 75 75 75 75 75 75 D0.1 [μm] 1.044 1.446 1.529 1.176 1.255 1.241 1.115 1.274 1.369 D0.5 [μm] 2.374 3.669 3.736 2.466 2.815 2.701 2.263 2.629 2.889 D0.9 [μm] 5.216 8.535 9.032 5.102 5.903 5.519 4.744 5.195 5.664
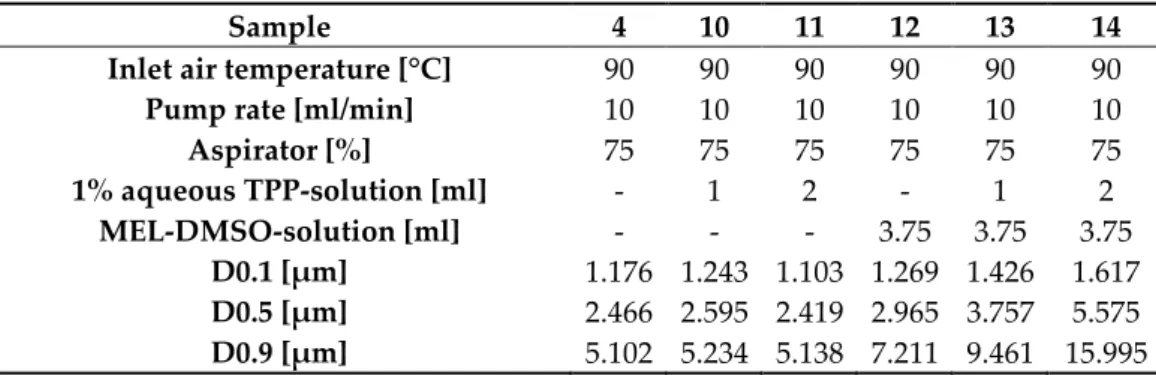
Table 4. Optimization of the composition 213
Sample 4 10 11 12 13 14
Inlet air temperature [°C] 90 90 90 90 90 90
Pump rate [ml/min] 10 10 10 10 10 10
Aspirator [%] 75 75 75 75 75 75
1% aqueous TPP-solution [ml] ‐ 1 2 ‐ 1 2
MEL-DMSO-solution [ml] ‐ ‐ ‐ 3.75 3.75 3.75 D0.1 [μm] 1.176 1.243 1.103 1.269 1.426 1.617 D0.5 [μm] 2.466 2.595 2.419 2.965 3.757 5.575 D0.9 [μm] 5.102 5.234 5.138 7.211 9.461 15.995
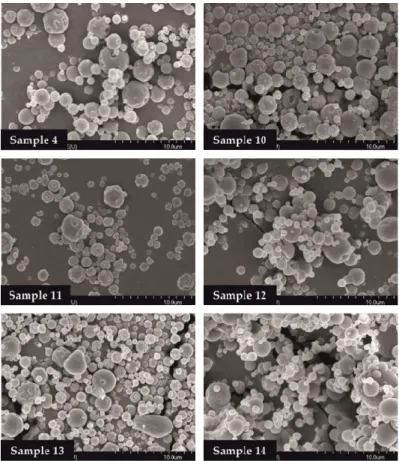
3.2 Morphology of the samples 214
The SEM images provided an indication of the microspheres morphology. Products 215 formulated by using different amounts of TPP solution (0, 1.0, 2.0 ml) were investigated. 216 Drug‐free particles (Sample 4, 10, 11) had a hollow structure. Nearly spherical 217 microparticles were observed in case of MEL‐containing samples (Sample 12, 13, 14). 218 Drug‐containing samples in the presence of 0 or 1.0 ml TPP solution revealed a 219 depressed surface morphology with holes. Microspheres cross‐linked with 2.0 ml TPP 220
solution exhibited a smooth surface (Figure 2). 221
222
Figure 2. SEM images of spray‐dried samples 223
3.3. Powder rheology properties 224
The rheological properties of powders have a key role in their processability. 225 Moreover, the deposition of particles in the nasal cavity is inversely proportional to the 226 density. Hence, the density of microspheres has a key role in the getting into required 227 nasal region. The lower density of particles could offer better flowability and an 228 improved deposition. The bulked and tapped densities, furthermore the Carr‐index 229 values of formulations are shown in Table 5. In case of drug‐containing products the 230 tapped density was around 0.15 g/cm3, lower comparing to the drug‐free samples, 231 predicting drug deposition in the required nasal regions. The Carr‐index results were in 232 the range of 17 and 29, indicatin the flowability, which parameter is also responsible for 233
the deposition. 234
Table 5. Powder rheology properties of the products 235
Sample 4 10 11 12 13 14
Bulk 0.2490 0.1384 0.3112 0.1256 0.1176 0.1193 Density [g/cm3]
Tap 0.6225 0.2214 0.5187 0.1507 0.1470 0.1670
Carr-index [%] 60 38 40 17 20 29
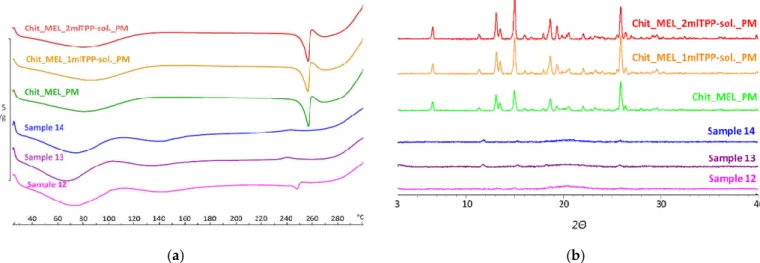
3.4. Structural characterization by DSC and XRPD 236
DSC was applied to study the crystallinity and the melting of MEL in physical 237 mixtures and in spray‐dried products. Sharp endothermic peaks of MEL were observed 238 in the physical mixtures (around 256 °C) that corresponded to the melting point of MEL 239 indicated that in these cases MEL was crystalline (Figure 3/a). Chitosan is an amorphous 240 additive. The endothermic peaks of crystalline MEL disappeared; only the characteristic 241 curve of chitosan was recognized regarding the spray‐dried products containing TPP, 242 revealing the presence of MEL in a molecularly dispersed form. The non‐cross‐linked 243
sample (Sample 12) presented a reduced MEL peak intensity referring to the presence of 244
its crystalline fraction. 245
XRPD was employed to investigate the physical state of drug‐containing 246 spray‐dried samples and PMs as controls. The XRPD diffractograms of PMs 247 demonstrated the crystalline structure of MEL as established during DSC 248 measurements. Its characteristic peaks were detected at 13.22, 15.06 and 25.7° (2Θ). The 249 diffractograms of the spray‐dried samples reconfirmed the presence of drug, especially 250 in the molecularly dispersed form. Few of the peaks of MEL appeared with a reduced 251 but growing intensity with the decrease of TPP content suggesting the presence of 252 crystalline MEL (Figure 3/b). The highest amount of crystalline MEL form was found 253
where no cross‐linking agent was applied. 254
(a) (b)
Figure 3. (a) DSC curves of PMs (Chit_MEL_2mlTPP‐sol., Chit_MEL_1mlTPP‐sol., Chit_MEL) and MEL‐containing 255 spray‐dried samples; (b) XRPD patterns of PMs and MEL‐containing spray‐dried samples 256
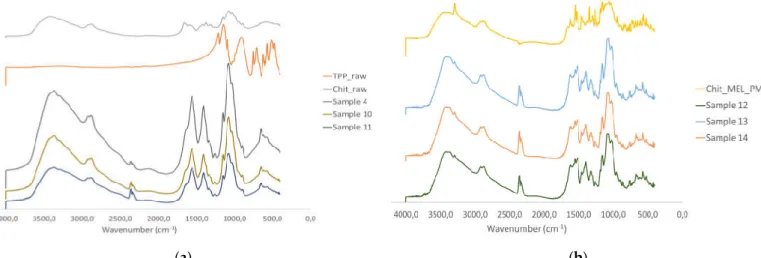
3.5 FTIR investigations 257
The intermolecular interactions of the microspheres were characterized by FTIR 258 (Figure 4/a). Seven characterization peaks were observed in HMW chitosan–TPP 259 microspheres at 3363.41, 2881.27, 1646.15 to 1653.24, 1376.47 to 1587.93, 1058.24 to 260 1064.48, 1026.87 to 1028.81, and 886.58 to 894.85 cm−1. These peaks could be defined as 261 O–H from H‐bonded, C–H stretch form aldehyde, C=N and N–H from amine I and 262 amide II, ‐CH3 symmetrical deformation, C–N from amine, C–O stretching, and C–H 263 from alkene or aromatic bonds, respectively [34,35]. Increasing the amount of TPP the 264 peaks at 3363.41 cm−1 became broad, indicating an enhancement in hydrogen bonding. 265 The peak at 1646.15 to 1650.20 cm−1 became larger in the presence of TPP compared to 266 chitosan alone thanks to the electrostatic interaction between the amino groups in 267 chitosan and the phosphoric groups in TPP [36]. The TPP peak at 1127.29 cm−1 268 disappeared after chitosan and TPP cross‐linking due to the intermolecular interactions 269 of chitosan and TPP. MEL‐containing microparticles showed the characteristic 270 absorption bands at specific wavenumbers (Figure 4/b) The intensity of characteristic 271 peaks of MEL at 3290.13, 1550.56 and 1265.14 cm−1 decreased because of drug 272
incorporation to the microsphere. 273
(a) (b)
Figure 4. (a) FTIR curves of the raw materials and spray dried samples without MEL, (b) FTIR curves of the 274
PMs and MEL‐containing spray dried samples 275
3.6. In vitro dissolution study 276
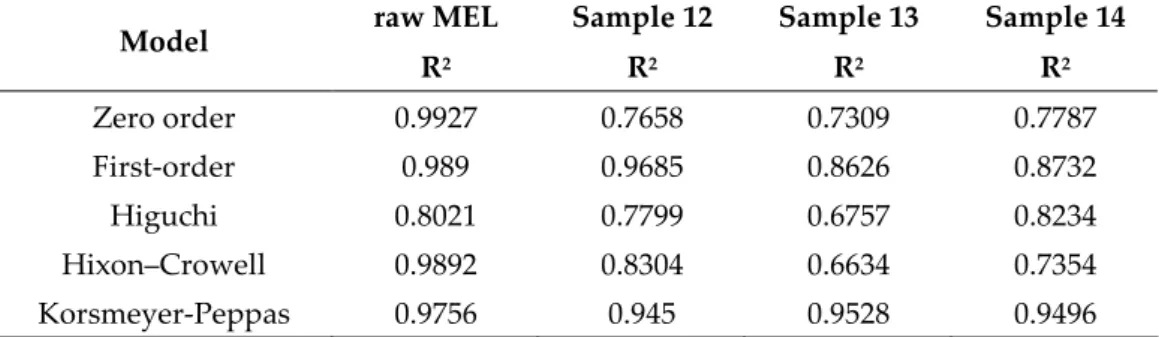
Before the dissolution studies, microspheres were dispersed in phosphate buffer 277 (pH = 5.6) and the viscosity of samples was detected. Samples displayed shear‐thinning 278 behaviour, thanks to the orientation of the polimer chains in the flow direction. The 279 viscosity of samples increased with increasing the TPP amount. 280 The in vitro dissolution test was carried out at pH of 5.6 in phosphate buffer 281 simulating the nasal conditions. The dissolution of raw MEL and of MEL from 282 cross‐linked and non‐cross‐linked samples was studied. Unprocessed MEL was used as 283 a control, only 4.5% of it dissolved in 60 min (Table 6). The spray‐dried samples 284 revealed fast initial release in the first 15 minutes, which was followed by a slower stage. 285 The presence of drug in a molecularly dispersed form resulted in the rapid dissolution 286 of API from the microspheres. The dissolved amount of MEL was decreased by the 287 growth of TPP concentration. The lowest dissolved amount of drug was perceptible in 288 the presence of 2 ml TPP. The highest amount of MEL – more than 90% during 1 h – has 289 been dissolved from the non‐cross‐linked Sample 12. This phenomena could be 290 explained with the formation of cross‐links only as the result of reaction between the 291 phosphate and the amino groups of chitosan in case of Sample 12 [37]. Adding TPP, the 292 enhancement in hydrogen bonding and the electrostatic interaction between the amino 293 and the phosphoric groups of chitosan and TPP kept MEL inside the microparticles. 294 During the analyses of the kinetics of drug release the data was evaluated by 295 correlation coefficient (R2). R2 values were used as the criteria to choose the best model to 296 describe drug release from the products (Table 7). Because of the low solubility, the 297 dissolution of raw MEL was slow and fitted the zero order kinetics model. In case of 298 TPP‐free spray‐dried product (Sample 12), the strongest correlation was shown with the 299
first order kinetics model (Equation 2): 300
(2) where Mt is the cumulative amount of drug released at time “t”; M∞ is the initial 301 amount of drug in the dosage form; k is the release rate constant, revealing that the 302 dissolution rate was concentration dependent. Approaching the saturation 303 concentration, the dissolution slowed down. Concerning Sample 13 and 14 the drug 304
release fitted the Korsmeyer‐Peppas model (Equation 3): 305
(3)
306 (where n is a constant, which characterizes the transport mechanism of diffusion), 307 indicating that the drug release mechanism from these samples was diffusion controlled 308
by gelling and the slow erosion of the chitosan [38]. 309
Table 6 The percentage of dissolved drug from raw MEL and MEL‐containing 310
spray‐dried products 311
Time (min.) Dissolved drug (%)
raw MEL Sample 12 Sample 13 Sample 14 5 0.157 ± 0.01 50.15 ± 2.44 35.53 ± 2.51 48.85 ± 1.78 10 0.583 ± 0.03 60.24 ± 3.05 47.62 ± 3.01 60.96 ± 2.38 15 1.003 ± 0.05 68.18 ± 3.76 55.97 ± 3.41 75.20 ± 2.80 30 2.618 ± 0.13 78.37 ± 3.10 67.53 ± 3.92 79.93 ± 3.38 60 4.548 ± 0.23 82.38 ± 4.68 73.28 ± 4.1 93.65 ± 3.66
Table 7 R2 values of kinetic analysis of in vitro drug release using different models 312 raw MEL Sample 12 Sample 13 Sample 14
Model
R2 R2 R2 R2
Zero order 0.9927 0.7658 0.7309 0.7787
First‐order 0.989 0.9685 0.8626 0.8732
Higuchi 0.8021 0.7799 0.6757 0.8234
Hixon–Crowell 0.9892 0.8304 0.6634 0.7354
Korsmeyer‐Peppas 0.9756 0.945 0.9528 0.9496
3.7. In vitro diffusion study 313
Modified diffusion horizontal cell model was used for diffusion investigations. 314 Figure 5 demonstrates that the rapid dissolution of MEL from molecularly dispersed 315 state in case of the spray‐dried products resulted in a faster diffusion and a higher 316 permeated drug concentration in the acceptor phase. The lowest drug amount 317 permeated related to raw MEL. The highest diffused concentration was observed from 318 the product which did not contain TPP in its composition (approximately 45 ug/cm2). In 319 the presence of TPP chitosan formed a well‐structured complex due to the 320 intermolecular interactions, resulting decreased swelling capacity of the polymer matrix 321
and less drug dissolution and diffusion. 322
323 Figure 5. In vitro permeability of raw MEL and of MEL‐containing spray‐dried products 324
4. Conclusions 325
The aim of our work was to prepare MEL‐containing spray‐dried chitosan micro‐ 326 spheres for nasal administration. The effect of the process parameters (inlet air tem‐ 327 perature and pump rate) on the particle size and morphology of the microspheres was 328 studied. As a novelty, a lower inlet air temperature (90 °C) was investigated than 329 usaually. With the chosen parameters cross‐linked and MEL‐containing samples were 330 formulated. The physicochemical (particles size, shape, crystalline‐ and chemical struc‐ 331 ture) and rheological properties of the microspheres were characterized, and the disso‐ 332 lution rate and diffusion through the artificial membrane of the drug‐containing pow‐ 333
ders were investigated. 334
The inlet air temperature and pump rate did not have an effect on the particle size 335 distribution and morphology, therefore the parameters that required the least energy (90 336
°C) and resulted in fast drying (10 ml/min) were chosen. Hereinafter, applying these pa‐ 337 rameters, MEL‐containing samples were prepared adding different amounts of TPP so‐ 338 lutions (0, 1 or 2 ml). The size of spray‐dried MEL containing microparticles increased 339 compared to the drug‐free particles, however, the average particle size was between 340 2.9‐5.6 μm, and they had a spherical habit. The density of microspheres (around 0.15 341 g/cm3) predicted drug deposition in the respiratory region of nose. In the spray‐dried 342 samples, MEL was primarily in a molecularly dispersed state, however, concerning the 343 non‐cross‐linked samples a small crystalline fraction of MEL was observed. The MEL 344 incorporation to the chitosan microparticles was successful. According to the in vitro 345 dissolution and permeability studies, the amount of dissolved and diffused MEL was 346 decreased by raising the concentration of TPP. In case of microspheres that were formu‐ 347 lated without TPP more than 90% of drug was dissolved during 1 h, and the same 348 product showed highest permeated drug amount (≈45 ug/cm2). It can be explained by the 349 formed cross‐links so that chitosan retained MEL from dissolution and diffusion. For all 350 three samples, the initial rapid dissolution was followed by a decelerating drug release. 351 Because of the mucoadhesive and permeability‐enhancer features of chitosan and 352 the fast and continuous dissolution and diffusion of molecularly dispersed MEL, for‐ 353 mulated microspheres prepared by spray‐drying may be recommended for further op‐ 354 timization in order to develop nasal dosage form. After the dose settings and the choice 355
and setting of medical device which is suitable for nasal powder delivery, the drug de‐ 356 livery system may be suggested for relieving acute pain or as adjuvant of analgesia 357
through the nasal mucosa. 358
Author Contributions:Conceptualization and Methodology, B.CS., S‐R.P. and A.R.; Investigation, 359 B.CS., V.P.; Evaluation, B.CS.; Writing—original draft, B.CS. and V.P.; Writing–review and editing, 360 S‐R.P. and A.R. All authors have read and agreed to the published version of the manuscript. 361 Funding: This research was funded by the University of Szeged Open Access Fund grant number 362
5223. 363
Data Availability Statement: In this section, please provide details regarding where data sup‐ 364 porting reported results can be found, including links to publicly archived datasets analyzed or 365 generated during the study. Please refer to suggested Data Availability Statements in section 366
“MDPI Research Data Policies” at https://www.mdpi.com/ethics. You might choose to exclude this 367
statement if the study did not report any data. 368
Acknowledgments: This work was supported by the Ministry of Human Capacities, Hungary 369
grant TKP 2020 and 2.2.1‐15‐2016‐00007 Project. 370
Thanks to Tamás Kiss for his help in calculating the kinetic models. 371 Conflicts of Interest: The authors declare no conflict of interest. The founding sponsors had no 372 role in the design of the study; in the collection, analyses, or interpretation of data; in the writing 373
of the manuscript, and in the decision to publish the results. 374
References 375
1. Casettari, L.; Illum, L. Chitosan in Nasal Delivery Systems for Therapeutic Drugs. Journal of Controlled Release 376
2014, 190, 189–200, doi:10.1016/j.jconrel.2014.05.003. 377
2. Costantino, H.R.; Illum, L.; Brandt, G.; Johnson, P.H.; Quay, S.C. Intranasal Delivery: Physicochemical and 378 Therapeutic Aspects. International Journal of Pharmaceutics 2007, 337, 1–24, doi:10.1016/j.ijpharm.2007.03.025. 379 3. Mathias, N.R.; Hussain, M.A. Non‐Invasive Systemic Drug Delivery: Developability Considerations for 380 Alternate Routes of Administration. Journal of Pharmaceutical Sciences 2010, 99, 1–20, doi:10.1002/jps.21793. 381 4. Hao, J.; Zhao, J.; Zhang, S.; Tong, T.; Zhuang, Q.; Jin, K.; Chen, W.; Tang, H. Fabrication of an Ionic‐Sensitive in 382 Situ Gel Loaded with Resveratrol Nanosuspensions Intended for Direct Nose‐to‐Brain Delivery. Colloids and 383 Surfaces B: Biointerfaces 2016, 147, 376–386, doi:10.1016/j.colsurfb.2016.08.011. 384 5. Aulton’s Pharmaceutics: The Design and Manufacture of Medicines; Aulton, M.E., Taylor, K., Eds.; Fifth edition.; 385
Elsevier: Edinburgh ; New York, 2018; ISBN 978‐0‐7020‐7005‐1. 386
6. Illum, L. Nasal Drug Delivery—Possibilities, Problems and Solutions. Journal of Controlled Release 2003, 87, 387
187–198, doi:10.1016/S0168‐3659(02)00363‐2. 388
7. Pires, A.; Fortuna, A.; Alves, G.; Falcão, A. Intranasal Drug Delivery: How, Why and What For? J Pharm Pharm 389
Sci 2009, 12, 288, doi:10.18433/J3NC79. 390
8. Jiang, L.; Gao, L.; Wang, X.; Tang, L.; Ma, J. The Application of Mucoadhesive Polymers in Nasal Drug Delivery. 391 Drug Development and Industrial Pharmacy 2010, 36, 323–336, doi:10.3109/03639040903170750. 392 9. Marttin, E.; Romeijn, S.G.; Coos Verhoef, J.; Merkus, F.W.H.M. Nasal Absorption of Dihydroergotamine from 393 Liquid and Powder Formulations in Rabbits. Journal of Pharmaceutical Sciences 1997, 86, 802–807, 394
doi:10.1021/js960500j. 395
10. Kublik, H.; Vidgren, M.T. Nasal Delivery Systems and Their Effect on Deposition and Absorption. Advanced 396 Drug Delivery Reviews 1998, 29, 157–177, doi:10.1016/S0169‐409X(97)00067‐7. 397
11. Alhalaweh, A.; Andersson, S.; Velaga, S.P. Preparation of Zolmitriptan–Chitosan Microparticles by Spray 398 Drying for Nasal Delivery. European Journal of Pharmaceutical Sciences 2009, 38, 206–214, 399
doi:10.1016/j.ejps.2009.07.003. 400
12. Billotte, A.; Dunn, P.; Henry, B.; Marshall, P.; Woods, J. Intranasal Formulations for Treating Sexual Disorders 401
2003, U.S. Patent Application No. 10/389,127. 402
13. Ahmadi, M.; Zubair, M.; Ahmad, K. A.; Riazuddin, V. N. Study on Nasal Deposition of Micro Particles and Its 403 Relationship to Airflow Structure. Int J Fluid Heat Transf 2016, 1, 1–11. 404 14. Sinha, V.R.; Singla, A.K.; Wadhawan, S.; Kaushik, R.; Kumria, R.; Bansal, K.; Dhawan, S. Chitosan Microspheres 405 as a Potential Carrier for Drugs. International Journal of Pharmaceutics 2004, 274, 1–33, 406
doi:10.1016/j.ijpharm.2003.12.026. 407
15. Bernkop‐Schnürch, A.; Dünnhaupt, S. Chitosan‐Based Drug Delivery Systems. European Journal of Pharmaceutics 408
and Biopharmaceutics 2012, 81, 463–469, doi:10.1016/j.ejpb.2012.04.007. 409
16. Kang, M.L.; Cho, C.S.; Yoo, H.S. Application of Chitosan Microspheres for Nasal Delivery of Vaccines. 410 Biotechnology Advances 2009, 27, 857–865, doi:10.1016/j.biotechadv.2009.06.007. 411 17. Schipper, N.G.M.; Olsson, S.; Hoogstraate, J.A.; deBoer, A.G.; Vårum, K.M.; Artursson, P. Chitosans as 412 Absorption Enhancers for Poorly Absorbable Drugs 2: Mechanism of Absorption Enhancement. Pharmaceutical 413
Research 1997, 14, 923–929, doi:10.1023/A:1012160102740. 414
18. Desai, K.G.H.; Park, H.J. Preparation of Cross‐Linked Chitosan Microspheres by Spray Drying: Effect of 415 Cross‐Linking Agent on the Properties of Spray Dried Microspheres. Journal of Microencapsulation 2005, 22, 416
377–395, doi:10.1080/02652040500100139. 417
19. Bhumkar, D.R.; Pokharkar, V.B. Studies on Effect of PH on Cross‐Linking of Chitosan with Sodium 418 Tripolyphosphate: A Technical Note. AAPS PharmSciTech 2006, 7, E138–E143, doi:10.1208/pt070250. 419 20. Yang, W.; Fu, J.; Wang, T.; He, N. Chitosan/Sodium Tripolyphosphate Nanoparticles: Preparation, 420 Characterization and Application as Drug Carrier. j biomed nanotechnol 2009, 5, 591–595, 421
doi:10.1166/jbn.2009.1067. 422
21. Pan, C.; Qian, J.; Zhao, C.; Yang, H.; Zhao, X.; Guo, H. Study on the Relationship between Crosslinking Degree 423 and Properties of TPP Crosslinked Chitosan Nanoparticles. Carbohydrate Polymers 2020, 241, 116349, 424
doi:10.1016/j.carbpol.2020.116349. 425
22. Prof. Neeta Kumar WHO Normative Guidelines on Pain Management - Report of a Delphi Study to Determine the Need 426 for Guidelines and to Identify the Number and Topics of Guidelines That Should Be Developed by WHO; 2007; 427 23. Horváth, T.; Ambrus, R.; Völgyi, G.; Budai‐Szűcs, M.; Márki, Á.; Sipos, P.; Bartos, C.; Seres, A.B.; 428 Sztojkov‐Ivanov, A.; Takács‐Novák, K.; et al. Effect of Solubility Enhancement on Nasal Absorption of 429 Meloxicam. European Journal of Pharmaceutical Sciences 2016, 95, 96–102, doi:10.1016/j.ejps.2016.05.031. 430 24. Bartos, C.; Ambrus, R.; Kovács, A.; Gáspár, R.; Sztojkov‐Ivanov, A.; Márki, Á.; Janáky, T.; Tömösi, F.; Kecskeméti, 431 G.; Szabó‐Révész, P. Investigation of Absorption Routes of Meloxicam and Its Salt Form from Intranasal 432 Delivery Systems. Molecules 2018, 23, 784, doi:10.3390/molecules23040784. 433 25. Yong, C.S.; Jung, S.H.; Rhee, J.‐D.; Choi, H.‐G.; Lee, B.‐J.; Kim, D.‐C.; Choi, Y.W.; Kim, C.‐K. Improved Solubility 434 and In Vitro Dissolution of Ibuprofen from Poloxamer Gel Using Eutectic Mixture with Menthol. Drug Delivery 435
2003, 10, 179–183, doi:10.1080/713840406. 436
26. Bartos, C.; Ambrus, R.; Sipos, P.; Budai‐Szűcs, M.; Csányi, E.; Gáspár, R.; Márki, Á.; Seres, A.B.; Sztojkov‐Ivanov, 437 A.; Horváth, T.; et al. Study of Sodium Hyaluronate‐Based Intranasal Formulations Containing Micro‐ or 438
Nanosized Meloxicam Particles. International Journal of Pharmaceutics 2015, 491, 198–207, 439
doi:10.1016/j.ijpharm.2015.06.046. 440
27. Ambrus, R.; Amirzadi, N.N.; Aigner, Z.; Szabó‐Révész, P. Formulation of Poorly Water‐Soluble Gemfibrozil 441 Applying Power Ultrasound. Ultrasonics Sonochemistry 2012, 19, 286–291, doi:10.1016/j.ultsonch.2011.07.002. 442 28. Blagden, N.; de Matas, M.; Gavan, P.T.; York, P. Crystal Engineering of Active Pharmaceutical Ingredients to 443 Improve Solubility and Dissolution Rates. Advanced Drug Delivery Reviews 2007, 59, 617–630, 444
doi:10.1016/j.addr.2007.05.011. 445
29. Elversson, J.; Millqvist‐Fureby, A.; Alderborn, G.; Elofsson, U. Droplet and Particle Size Relationship and Shell 446 Thickness of Inhalable Lactose Particles During Spray Drying. Journal of Pharmaceutical Sciences 2003, 92, 900–910, 447
doi:10.1002/jps.10352. 448
30. Kulkarni, A.D.; Bari, D.B.; Surana, S.J.; Pardeshi, C.V. In Vitro, Ex Vivo and in Vivo Performance of 449 Chitosan‐Based Spray‐Dried Nasal Mucoadhesive Microspheres of Diltiazem Hydrochloride. Journal of Drug 450 Delivery Science and Technology 2016, 31, 108–117, doi:10.1016/j.jddst.2015.12.004. 451 31. 2.9.34. Bulk density and tapped density of powders. In European Pharmacopoea 9.0; p. 359. 452 32. Szabó, B.; Kállai, N.; Tóth, G.; Hetényi, G.; Zelkó, R. Drug Release Profiles and Microstructural Characterization 453 of Cast and Freeze Dried Vitamin B12 Buccal Films by Positron Annihilation Lifetime Spectroscopy. Journal of 454 Pharmaceutical and Biomedical Analysis 2014, 89, 83–87, doi:10.1016/j.jpba.2013.10.031. 455 33. Pereswetoff‐Morath, L. Microspheres as Nasal Drug Delivery Systems. Advanced Drug Delivery Reviews 1998, 29, 456
185–194, doi:10.1016/S0169‐409X(97)00069‐0. 457
34. Lawrie, G.; Keen, I.; Drew, B.; Chandler‐Temple, A.; Rintoul, L.; Fredericks, P.; Grøndahl, L. Interactions 458 between Alginate and Chitosan Biopolymers Characterized Using FTIR and XPS. Biomacromolecules 2007, 8, 459
2533–2541, doi:10.1021/bm070014y. 460
35. Luo, Y.; Zhang, B.; Cheng, W.‐H.; Wang, Q. Preparation, Characterization and Evaluation of Selenite‐Loaded 461 Chitosan/TPP Nanoparticles with or without Zein Coating. Carbohydrate Polymers 2010, 82, 942–951, 462
doi:10.1016/j.carbpol.2010.06.029. 463
36. Wu, Y.; Yang, W.; Wang, C.; Hu, J.; Fu, S. Chitosan Nanoparticles as a Novel Delivery System for Ammonium 464 Glycyrrhizinate. International Journal of Pharmaceutics 2005, 295, 235–245, doi:10.1016/j.ijpharm.2005.01.042. 465 37. Ma, Z.; Garrido‐Maestu, A.; Jeong, K.C. Application, Mode of Action, and in Vivo Activity of Chitosan and Its 466 Micro‐ and Nanoparticles as Antimicrobial Agents: A Review. Carbohydrate Polymers 2017, 176, 257–265, 467
doi:10.1016/j.carbpol.2017.08.082. 468
38. Wang, J.J.; Zeng, Z.W.; Xiao, R.Z.; Xie, T.; Zhou, G.L.; Zhan, X.R.; Wang, S.L. Recent Advances of Chitosan 469 Nanoparticles as Drug Carriers. Int J Nanomedicine 2011, 6, 765–774, doi:10.2147/IJN.S17296. 470 471