1 Population structure of Pyrenophora teres f. teres barley pathogens from different continents 2
3 Buddhika A. Dahanayaka1, Niloofar Vaghefi1, Noel L. Knight1, József Bakonyi2, Renée Prins3,4, 4 Diána Seress2, Lislé Snyman5, Anke Martin1,*
5
6 1 Centre for Crop Health, University of Southern Queensland, Toowoomba, QLD, 4350, Australia.
7 2 Plant Protection Institute, Centre for Agricultural Research, 15 Herman Ottó Street, Budapest, 8 1022, Hungary.
9 3 CenGen (Pty) Ltd, 78 Fairbairn Street, Worcester, 6850, South Africa.
10 4 Stellenbosch University, Department of Genetics, Private Bag X1, Matieland, Stellenbosch, 7602, 11 South Africa.
12 5 Department of Agriculture and Fisheries Queensland, Hermitage Research Facility, 604 Yangan 13 Rd, Warwick, QLD, 4370, Australia.
14 *Corresponding author: Anke Martin; anke.martin@usq.edu.au 15
16
17 Keywords: Australia, Diversity Arrays Technology, Hungary, Hybrids, Net form net blotch, South 18 Africa.
19 20
21 Funding: Grant NKFI 119276 for the collection of isolates from Hungary
22 ABSTRACT
23 Net-form net blotch disease caused by Pyrenophora teres f. teres (Ptt) results in significant 24 yield losses to barley industries. Up-to-date knowledge of the genetic diversity and structure of 25 pathogen populations is critical for better understanding the disease epidemiology and unravelling 26 pathogen survival and dispersal mechanisms. Thus, this study investigated long distance dispersal 27 and adaptation by analysing the genetic structure of 250 Ptt isolates collected from Australia, Canada, 28 Hungary and Republic of South Africa (RSA), and historical isolates from Canada, Denmark, Japan 29 and Sweden. The population genetic structure detected by discriminant analysis of principal 30 component, using 5890 Diversity Arrays Technology (DArT) markers, revealed the presence of four 31 clusters. Two of these contained isolates from all regions, and all isolates from RSA were grouped in 32 these two. Australia and Hungary showed three clusters each. One of the Australian clusters contained 33 only Australian isolates. One of the Hungarian clusters contained only Hungarian isolates and one 34 Danish isolate. STRUCTURE analysis indicated that some isolates from Australia and Hungary 35 shared recent ancestry with RSA, Canada and historical isolates and were thus admixed. Subdivisions 36 of the Neighbor-joining network indicated that isolates from distinct countries were closely related, 37 suggesting multiple introduction events conferred genetic heterogeneity in these countries. Through 38 a Neighbor-joining analysis and amplification with form-specific DNA markers two hybrid isolates, 39 CBS 281.31 from Japan and H-919 from Hungary collected in 1931 and 2018, respectively, were 40 detected. These results provide a foundation for exploring improved management of disease 41 incursions and pathogen control through strategic deployment of resistances.
42 Keywords: Australia, Canada, Diversity Arrays Technology, Historical isolates, Hungary, Hybrids, 43 Net form net blotch, Republic of South Africa.
44 The net blotch diseases, caused by Pyrenophora teres, are major fungal foliar diseases 45 of barley, causing devastating losses to barley production throughout the world (Mathre 1997).
46 Yield loss due to P. teres in susceptible barley varieties can range from 10 to 70% (Jayasena et 47 al. 2007; Wallwork et al. 2016). Additionally, total plant death may occur in the absence of 48 suitable fungicide treatments (Mathre 1997; Murray and Brennan 2010; Steffenson et al. 1991).
49 Net blotch can appear as two forms, net form net blotch (NFNB), caused by P. teres f. teres 50 (Ptt), and spot form net blotch (SFNB), caused by P. teres f. maculata (Ptm). Phylogenetically 51 these two forms are closely related to each other (Marin-Felix et al. 2019) while in terms of 52 population genetic analyses, the two forms represent two genetically distinct populations 53 (Ellwood and Wallwork 2018; Liu et al. 2011; McLean et al. 2009). Even though hybrids 54 between Ptt and Ptm have been produced successfully under laboratory conditions 55 (Smedegård-Petersen 1971), hybrids in the field are considered to be absent or rare due to the 56 genetic distance between these two forms (Ellwood et al. 2012; Lehmensiek et al. 2010; Poudel 57 et al. 2017).
58 Net form net blotch is characterised by streaks or net-like dark brown necrotic lesions 59 along barley leaf veins, comprising longitudinal and transverse striations (Liu et al. 2011;
60 Smedegård-Petersen 1971). Outbreaks of Ptt have occurred across a wide range of barley 61 growing regions and climates (Van den Berg 1988). Short distance dispersal of Ptt by air 62 turbulence and water splashing (Deadman and Cooke 1989) can occur through ascospores and 63 conidia produced during sexual and asexual reproduction, respectively (Liu et al. 2011). Since 64 Ptt is a seed-borne fungus (Liu et al. 2011), long distance transmission of Ptt could result from 65 exchange of infected seeds among geographically remote areas (Martin and Clough 1984;
66 Shipton 1966). Furthermore, as sexual recombination is known to play a major role in the life 67 cycle of Ptt, integration and adaptation of novel Ptt pathotypes into local areas from another
68 geographical region is possible. Introduction of a novel pathotype may greatly shape the local 69 Ptt genetic structure.
70 Knowledge of population diversity and structure is essential for understanding 71 population dynamics and improving disease control methods. The genetic structure of a Ptt 72 population depends on a number of factors such as mutations, genetic drift, gene flow, selection 73 and the relative significance of sexual versus asexual stages in the life cycle of the pathogen 74 (Akhavan et al. 2016b). With the advent of molecular genotyping technologies, Ptt populations 75 from different geographical locations have been characterized using molecular markers such 76 as random amplified polymorphic DNA (RAPD), amplified fragment length polymorphisms 77 (AFLP) and simple sequence repeats (SSR). Genetic characterization studies in Australia 78 (Bogacki et al. 2010; Ellwood et al. 2019; Lehmensiek et al. 2010; Serenius et al. 2007), Europe 79 (Bakonyi and Justesen 2007; Ficsor et al. 2014; Jonsson et al. 2000; Rau et al. 2003; Serenius 80 et al. 2005), North America (Akhavan et al. 2016b; Jonsson et al. 2000; Peever and Milgroom 81 1994) and the Republic of South Africa (RSA) (Campbell et al. 2002; Lehmensiek et al. 2010) 82 have detected high genetic diversity within Ptt populations.
83 Studies conducted on Australian P. teres populations using AFLP and SSR markers 84 revealed high genetic variation within P. teres isolates collected from New South Wales, 85 Queensland, South Australia, Victoria and Western Australia (Ellwood et al. 2019; Lehmensiek 86 et al. 2010; McLean et al. 2010). To date, two studies have characterized the genetic structure 87 of P. teres populations from the RSA using AFLP and RAPD markers (Campbell et al. 2002;
88 Lehmensiek et al. 2010), which revealed high genetic diversity in the Ptt populations. Ficsor 89 et al. (2014) used RAPD markers to detect greater genotypic variability and genetic diversities 90 within sampling units than between sampling units (mating type, field type, geographical 91 region and year), and significant temporal genetic differentiation between seasons in Hungarian
93 epidemiology of Ptt in the respective regions, it is not possible to compare the genetic diversity 94 and structure of Ptt populations among these geographical areas as different studies have used 95 different marker and analysis systems. Hence, application of a single marker system is 96 necessary to enable valid comparisons of the genetic diversity and structure in Ptt populations 97 from different parts of the world.
98 Use of less efficient markers such as AFLPs and RAPDs limits the reproducibility of the 99 results (Mondini et al. 2009). Alternative marker systems, such as Diversity Arrays Technology 100 (DArT), have become available, which produce a large number of reproducible genome-wide 101 markers, some of which are located in gene regions (DArTseq 2020). Diversity Arrays 102 Technology is a high throughput efficient molecular marker technology which, unlike SSR 103 markers, does not require prior knowledge of the genome sequence (Wenzl et al. 2004). With 104 DArT, polymorphisms are detected at restriction enzyme recognition sites and the presence or 105 absence of individual DNA fragments in the genome is detected through microarray 106 hybridization (Jaccoud et al. 2001). The advanced DArT technology also identifies single 107 nucleotide polymorphisms (SNPs) within sequences. This technology has been previously 108 implemented for genetic population analysis of fungal species including P. teres (Martin et al.
109 2020; Poudel et al. 2019; Syme et al. 2018).
110 The genetic diversity of a pathogen can affect its ability to adapt to host resistances and 111 control strategies (McDonald and Linde 2002). Therefore, pathogens that are genetically more 112 diverse may also have a higher diversity profile of virulence (Linde and Smith 2019) and an 113 increased ability to respond to environmental changes and control measures, which may affect 114 the resistance to fungicides or pathogenicity on the host (Peltonen et al. 1996). A recent study 115 revealed rapid changes in the genetic structure of Ptt populations collected over three years 116 from barley fields in Australia, suggesting potential adaptation and underlining the necessity 117 of using multiple sources of host‐plant resistance for defence against the pathogen (Poudel et
118 al. 2019). The continued evolution of fungal pathogen populations driven by the selection 119 pressure applied by host resistance will likely lead to a decline in the efficiency of the deployed 120 resistance (Suffert et al. 2018).
121 The worldwide occurrence of Ptt in barley and its potential for rapid genetic change 122 through sexual recombination over a short period of time demonstrates the necessity of 123 understanding its population diversity and structure in order to achieve efficient disease 124 management strategies, including the development of resistant barley varieties (Liu et al. 2011;
125 McDonald and McDermott 1993). Hence, this study was designed to characterize the genetic 126 diversity and structure of Ptt populations from Australia, Canada, Hungary and the RSA, and 127 explore the potential for long distance dispersal and geographic adaptation of the pathogen.
128 MATERIALS AND METHODS
129 Sample collection and fungal isolation. The terms entire collection, population and 130 subpopulation in this study refer to the isolates from all countries included in the study, a 131 collection of isolates from a country and a collection of isolates from a region/state within a 132 country, respectively. All the isolates used in this study were monoconidial isolates and 133 collected randomly. Isolates were mostly originated from barley leaves (except two isolates:
134 H-374 and H-376 from Hungary originated from wheat and one: CG16015 from RSA 135 originated from rye grass) exhibiting NFNB symptoms collected from Australia, Canada, 136 Hungary and RSA. Five additional historic isolates were included in this study from Canada 137 [WRS858; Serenius et al. (2007)], Denmark [Pt-Pastorale; Justesen et al. (2008)], Japan [CBS 138 282.31 and CBS 281.31; Bakonyi and Justesen (2007)] and Sweden [UPSC1838; Bakonyi and 139 Justesen (2007)].
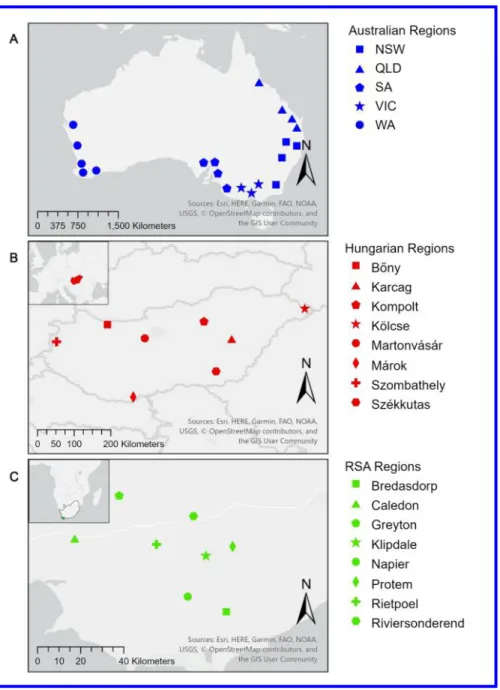
140 The Australian population included 118 isolates collected between 1985 and 2017 from 141 New South Wales (NSW, n = 20), Queensland (QLD, n = 43) South Australia (SA, n = 24),
143 hybrid WAC17021 (McLean et al. 2014) (Supplementary Table S1 and Fig. 1). Sample 144 collection and fungal isolation of Australian samples were performed following the method 145 described by Martin et al. (2020). Six isolates from Canada, collected by Akhavan et al. (2016a) 146 in 2010 and 2011 from Alberta, Manitoba and Saskatchewan, were also included in the study.
147 The Hungarian population consisted of 85 isolates derived from naturally infected barley 148 (n = 83) and wheat leaves (n = 2) collected from 2006 to 2018 (Supplementary Table S1 and 149 Fig. 1). Seventy-eight isolates were collected from experimental fields at the Centre for 150 Agricultural Research or National Food Chain Safety Office (NFCSO) in the Martonvásár 151 region (n = 31), Fleischmann Rudolf Research Institute, Eszterházy Károly University, 152 Kompolt (n = 17), Institute for Agricultural Research and Educational Farm, University of 153 Debrecen, Karcag (n = 22) and a commercial field or experimental plots of NFCSO and Cereal 154 Research Non-Profit Ltd in the Szombathely region (n = 8). The remaining seven isolates were 155 collected from five commercial and two NFCSO barley fields (Bőny: n = 1, Kölcse: n = 3, 156 Márok: n = 2 and Székkutas: n = 1).
157 Fungal isolation of Hungarian isolates was performed by inducing conidiogenesis. Leaf 158 segments with necrotic lesions were placed in glass Petri plates and kept on a laboratory bench 159 at ambient temperature or incubated under white light (OSRAM model L36W/640) for 16/8 160 hour light/dark cycles for 1 to 3 days at 18 to 20°C. Monoconidial isolates were then made by 161 transferring single conidia from the conidiophores to V8-juice agar medium (16 g agar, 3 g 162 CaCO3, 177 mL Campbell’s V8-juice and 900 ml distilled water) (Miller 1955) with a sterile 163 needle, using a Leica MZ6 stereomicroscope at 300 to 400× magnification in a laminar air flow 164 cabinet. Single-conidial isolates were incubated for 10 to 14 days in the dark at 18 to 20°C and 165 used as inocula for stock and pea broth cultures. Stock cultures were grown on V8-juice agar 166 slants for 7 to 10 days in the dark at 20 to 22°C, then kept under mineral oil at 15°C. Mycelium 167 for DNA extraction was grown on pea-broth (Erwin and Ribeiro 1996) in steady cultures for 7
168 to 10 days at 18 to 20°C in the dark. Liquid cultures were then harvested by filtration, washed 169 with deionised water, freeze-dried and ground in liquid nitrogen. Pulverized mycelia were kept 170 at -70°C for DNA extraction.
171 The RSA population contained 72 isolates collected from leaves of barley (n = 71) and 172 rye grass (n = 1) from eight regions (Bredasdorp: n = 11, Caledon: n = 28, Greyton: n = 6, 173 Klipdale: n = 8,Napier: n = 12,Protem: n = 4, Rietpoel: n = 2 and Riviersonderend: n = 1) 174 around the Western Cape Province of RSA during October 2016 (Supplementary Table S1 and 175 Fig. 1). Fungal isolation was performed by sterilizing the surface of leaf samples in 70%
176 (vol/vol) ethanol for 5 seconds, 5 g/liter NaOCl for 2 minutes and washing three times in sterile 177 water. These were placed on water-agar (10 g/liter) or moist filter paper (×2) and incubated at 178 room temperature and natural day/night light conditions for 1 to 4 days to allow the growth of 179 conidia. Monoconidial culture production was performed by transferring single conidia to 180 potato dextrose agar (39 g/liter PDA; Biolab Merck, Modderfontein, RSA) and Solustrep (0.3 181 ml/liter) plates. Plates were incubated for 4 to 5 days, and a single colony was subcultured onto 182 a new PDA plate. After 7 days, agar plugs were collected and stored in 15% glycerol at -80°C 183 and the remaining mycelium was harvested for DNA extraction.
184 DNA extraction for DArTseq™. DNA from Australian isolates was extracted from 185 single-conidium cultures using the method described by Martin et al. (2020). DNA of 186 Hungarian isolates was extracted from lyophilized mycelium powder using the Cetyl Trimethyl 187 Ammonium Bromide (CTAB) method (Richards et al. 1997) and DNA of all other isolates was 188 extracted using a similar CTAB method (Saghai-Maroof et al. 1984).
189 The integrity of DNA extracted from each isolate was assessed under ultraviolet light 190 (Fusion FX, VILBER, Marne-la-Vallée, France) after electrophoresis at 100V for 30 min on a 191 0.8 g/litre agarose gel (Bioline, London, United Kingdom) containing 0.03% GelRed® 192 (Biotium Inc, California, USA). DNA quantity was measured using a NanoPhotometer P300®
193 (IMPLEN, Munich, Germany). For each isolate, 20 µl of DNA solution (> 50 ng/µl) was 194 submitted to Diversity Arrays Technology Pty. Ltd. (Canberra, ACT, Australia) for 195 DArTseq™.
196 Data filtering and clone correction. Data obtained from DArTseq™ consisted of SNPs 197 and SilicoDArTs (equivalent to microarray markers scored for the presence or absence of 198 sequences obtained from genomic representations). Both forms of data were filtered manually 199 using 10% as the cut off value for the maximum number of missing data points for markers 200 and isolates. Markers with a minimum allele frequency of less than one percent were removed 201 from the data set (Vaghefi et al. 2017). Reproducibility (the proportion of technical replicate 202 assay pairs for which the marker score is consistent) and the CallRate (the proportion of 203 samples for which the genotype call is either present or absent rather than missing) of each 204 marker was evaluated and markers with reproducibility of <1 and CallRate less than 85% were 205 removed. SNPs and SilicoDArTs were combined for further analyses.
206 A small number of genotyping errors may occur whilst generating DArTseq™ marker 207 data, and this may result in clonal isolates being identified as unique multilocus genotypes 208 (MLGs). In order to remove potential genotyping errors, all genotypes were contracted using 209 the furthermost bitwise distance (Kamvar et al. 2015) among five control DNA samples from 210 the same isolate (NB63i; extracted from an original culture using five different samples of 211 single-conidium derived mycelia) by the bitwise.dist function in poppr package version 2.8.3 212 (Kamvar et al. 2014) in R version 3.0.2 (R 2013). The furthermost bitwise distance among five 213 control samples (0.000925) was set as the threshold value to contract genotypes within the 214 entire population. All populations were clone corrected at the subpopulation stratum using the 215 clonecorrect function in poppr to collapse clonal groups into a single MLG for all subsequent 216 analyses except for the estimation of genetic diversity indices. Multilocus genotypes shared 217 among subpopulations were calculated by the cross.pop function in poppr.
218 Dendrogram construction. All isolates were assigned to genetic clusters without a 219 priori assumptions using DARwin version 6.0.021 (Perrier and Jacquemoud-Collet 2006). A 220 dendrogram was produced based on the Jaccard similarity coefficient following the unweighted 221 neighbor-joining clustering method. Bootstrap analysis with 1,000 replicates was used to test 222 the support of the branches on the dendrogram.
223 Form specific primer amplification to confirm hybrids. After assessing the 224 dendrogram, two isolates forming a group with the previously reported Ptt-Ptm hybrid isolate 225 WAC17021 were subjected to PCR amplification using six Ptt and six Ptm specific primer 226 pairs following Poudel et al. (2017) with modifications. A combination of both Ptt and Ptm 227 specific primer pairs are expected to be amplified in hybrid isolates (Poudel et al. 2017). DNA 228 of three Ptt isolates (NB63i, NB29 and NB50) (Lehmensiek et al. 2010; Martin et al. 2020), 229 three Ptm isolates (HRS06033, SNB113 and HRS07033) (Lehmensiek et al. 2010; McLean et 230 al. 2014) and three laboratory produced hybrids (37.1, 37.4 and 37.16) (unpublished data) were 231 also amplified with the primer pairs as positive controls. Each real time PCR reaction was 232 prepared with 2 µl (~ 50 ng/µl) of DNA, 5 µl of SsoAdvanced™ Universal Inhibitor-Tolerant 233 SYBR® Green Supermix (BIORAD, California, USA), 0.25 µM of each primer and 2 µl of 234 molecular water (MilliporeSigma™, Fisher Scientific, Massachusetts, USA) to a final volume 235 of 10 µl. Amplifications were conducted in a CFX384 Touch Real-Time PCR Detection 236 System™ (BIORAD, California, USA) with an initial denaturation at 98°C for 3 min followed 237 by 35 cycles of denaturation at 98°C for 15 s and annealing at 60°C for 30 s. A melt curve 238 analysis was performed after PCR completion by ramping the temperature from 65°C to 95°C, 239 rising by 0.5°C with each step. The presence/absence of specific loci in isolates were assessed 240 by comparing the quantitative data generated by the melt curves and the melt temperatures of 241 the positive controls.
242 Analysis of molecular variance. In order to identify significant variation among 243 populations and subpopulations, the amova function in Ade4 version 1.7.13 (Dray and Dufour 244 2007) in R was used. Analysis of molecular variance (AMOVA) was conducted on the 245 combined Australia, Hungary and RSA populations using the poppr.amova function in poppr 246 with 1,000 permutations. Isolates were stratified based on the country of origin, region/state 247 and year of collection. Analysis was conducted to identify the amount of genetic variation 248 within and among countries, year of collection, and region/state within countries. When 249 conducting AMOVA for the separate Australian, Hungarian and RSA populations, 250 subpopulations consisting of less than five isolates were removed. Analysis was performed for 251 genetic variation within and among states/fields and year of collection for Australia and 252 Hungary populations.
253 Population structure by multivariate cluster analyses. Two multivariate analyses, 254 principal component analysis (PCA) followed by discriminant analysis of principle 255 components (DAPC) were conducted to identify the genetic structure of the entire clone- 256 corrected collection without a priori assumptions. For PCA, the optimum number of principal 257 components and principal coordinates were found and plots were drawn using the pcadapt 258 function in pcadapt version 4.3.3 package (Luu et al. 2017). Discriminant analysis of principle 259 components was calculated using the dapc function in the R package adegenet version 2.1.2 260 (Jombart 2008) and was performed for individual populations in order to detect the population 261 structure and number of clusters within countries. The optimum number of clusters in the 262 population was obtained using the Bayesian information criterion function find.clusters and the 263 optimal number of principal component axes to retain in DAPC were estimated via the 264 xvalDapc function in adegenet.
265 Population structure by model-based cluster analyses. Population structure without a 266 priori assumption was investigated using STRUCTURE version 2.3.4 (Pritchard et al. 2000),
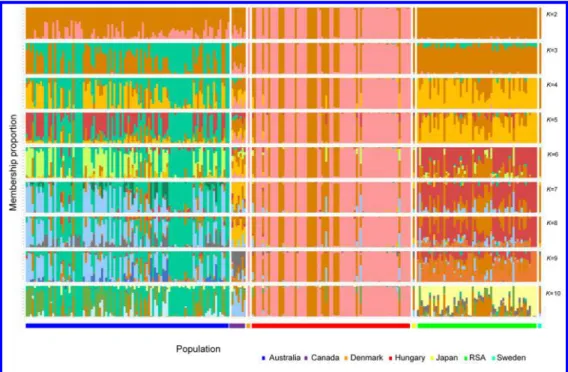
267 in which the Bayesian unsupervised genetic clustering algorithm was implemented for the 268 entire clone-corrected collection (100 Australian, 78 Hungarian, 59 RSA, six Canadian and one 269 historical isolate each from Canada, Japan, Sweden and Denmark). The analysis was conducted 270 following an admixture model with a burn-in period of 10,000 Markov chain Monte Carlo and 271 100,000 iterations. Ten independent runs were conducted for each potential number of genetic 272 clusters (K), where K ranged from 1 to 10. The analysis was performed independently for 273 Australian, Hungarian and RSA populations with the above-mentioned criteria to identify the 274 genetic structure within populations. Values extracted from STRUCTURE HARVESTER 275 version 0.6.94 (Earl and vonHoldt 2012) were used to identify the optimal number of clusters 276 for the entire clone-corrected collection as well as Australian, Hungarian and RSA populations 277 (Evanno et al. 2005). Each replicate for the optimal delta K (ΔK) value was entered into 278 CLUMPAK version 1.1 (Kopelman et al. 2015) to generate the graphical representation of the 279 optimal K. A cut off value of 70% was considered as the minimum value of an individual to be 280 included in each population.
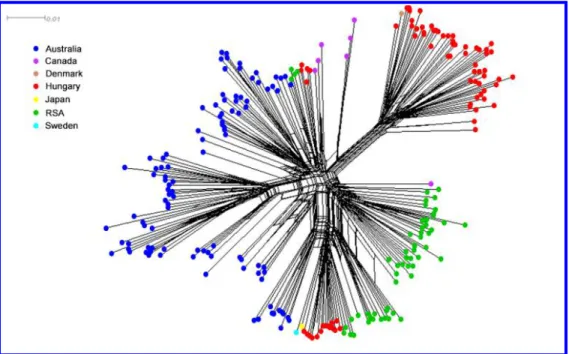
281 Population structure based on phylogenetic network. A Neighbor-net phylogenetic 282 network was built for the entire collection using SplitsTree version 4.13 (Huson 1998) to 283 identify the subdivisions of the clone corrected P. teres population. The Neighbor-net network 284 was produced based on neighbor-joining (NJ) algorithm described by Saitou and Nei (Saitou 285 and Nei 1987) following the method depicted by Bryant and Moulton (2004). Bootstrap 286 analysis with 1,000 replicates was used to test the support of branches on the network.
287 Identification of mating type and sexual recombination. Amplification of mating type 288 primer pairs pttMAT1-1 and pttMAT1-2 (Lu et al. 2010) was assessed across all isolates. A chi 289 square test of the ratio of pttMAT1-1 and pttMAT1-2 was manually calculated for Ptt clusters 290 identified by individual DAPC analyses from Australia, Hungary and RSA to determine
292 to identify the mating type of the hybrids, all mating type primer pairs (pttMAT1-1, pttMAT1- 293 2, ptmMAT1-1 and ptmMAT1-2 (Lu et al. 2010) were amplified across hybrids.
294 Pairwise homoplasy index (PHI) test which tests the null hypothesis of no recombination 295 available in SplitsTree 4.13 was also implemented for the same clusters detected in individual 296 DAPC analyses for Australia, Hungary and RSA to identify the potential sexual recombination 297 within the countries as described by Bruen et al. (2006).
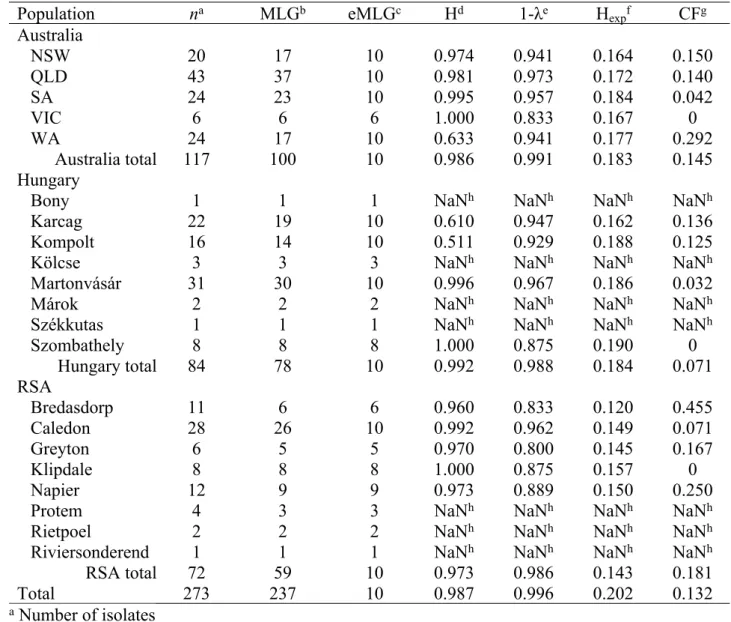
298 Genetic diversity of populations. The non-clone corrected data set was used to calculate 299 the number of MLGs, expected MLGs (eMLG) after rarefaction, Simpson's complement index 300 of multilocus genotypic diversity (1-λ) and Nei’s unbiased gene diversity (genetic variation 301 within the population defined as the probability that two randomly sampled alleles are 302 different) (Nei 1973; Nei and Chesser 1983) using poppr. The normalised Shannon-Wiener 303 index (H) was calculated manually following the method described by Spellerberg and Fedor 304 (2003). Simpson's complement index is given based on the probability of two random isolates 305 drawn from a subpopulation to be of a different genotype (Morris et al. 2014; Simpson 1949) 306 and Shannon-Wiener index measures the genotypic diversity of the population by richness 307 (number of MLGs in the population) and relative abundance in a defined location (Shannon 308 2001; Spellerberg and Fedor 2003). Expected MLG, Simpson's complement index of 309 multilocus genotypic diversity (1-λ), Nei’s unbiased gene diversity and the normalised 310 Shannon-Wiener index were also calculated for the clusters identified from individual DAPC 311 analyses of Australia, Hungary and RSA.
312 Variant annotation and associated genes. Markers with the largest contribution to the 313 genetic variation detected in DAPC analysis of the entire clone-corrected collection were 314 detected using the function loadingplot in adegenet (Jombart et al. 2010). The largest 315 contributing markers for the genetic clusters in PCA for the entire collection were also 316 determined at the 0.0001 significance level using the function outliers.pcadapt in the pcadapt
317 package, and compared to the markers detected from DAPC analysis. Sequences (68 bp reads 318 produced by DArTseq™) harbouring markers significantly (P < 0.0001) responsible for the 319 genetic variation were aligned by NCBI-BLAST (NCBI) and NBLSTX (EnsemblFungi) to the 320 reference genomes of Pyrenophora teres f. teres isolates W1-1 (GenBank accession number:
321 OCTH00000000 and BioProject: PRJEB18107) and 0-1 (GenBank accession number:
322 AEEY01000000 and BioProject: PRJNA66337), and partial genomic regions of 13A 323 (GenBank accession numbers: JQ837863 and JQ582646). This enabled identification of 324 possible genes linked to markers with the largest contribution to the genetic clustering during 325 DAPC and PCA analyses. The putative proteins for the respective genes were predicted using 326 Universal Protein knowledgebase (UniProt).
327 RESULTS
328 Genetic data and marker filtering. Across 286 isolates, a total of 6,440 SNPs and 329 14,829 SilicoDArTs were reported, with 891 SNPs and 4,999 SilicoDArTs retained for the 330 analysis after filtering (Supplementary Material_2). After contraction (collapsing genotypes by 331 genetic distance in order to remove genotypes identified as unique due to genotyping errors) 332 of the entire collection, 286 genotypes were contracted to 250 genotypes. No clonal genotypes 333 were identified after clone correction of 250 MLGs and no MLGs were shared across any 334 regions/states within a country. Of these, 101 MLGs were from the Australian population 335 collected from 1985 to 2017 (including a previously reported hybrid WAC17021), seven were 336 Canadian isolates collected in 2010 and 2011 including one historical isolate collected in 1973, 337 59 were RSA isolates collected in 2016 and 79 were Hungarian isolates (16 collected from 338 2006 to 2009 and 63 in 2017/8). Four historical isolates representing four different MLGs, two 339 from Japan (collected in 1931) and one each from Denmark (1976) and Sweden (1986) were 340 also included (Supplementary Table S1).
341 Dendrogram construction. The distance-based dendrogram obtained from DARwin 342 showed the presence of a distinct group of three isolates (Supplementary Fig.1). This group 343 showed distinct genetic separation from the rest of the Ptt isolates and contained the previously 344 reported hybrid WAC10721 from Australia along with H-919 from Hungary and CBS 281.31 345 from Japan, thus suggesting that these two isolates may also be hybrids.
346 Form specific primer amplification to confirm hybrids. PCR amplification of six Ptt 347 and six Ptm specific primer pairs (Poudel et al. 2017) confirmed the hybrid identity of isolates 348 H-919 and CBS 281.31. PCR results of the isolate H-919 with 12 primer pairs showed 349 amplification for PttQ1, PttQ3, PttQ5, PtmQ7, PtmQ8 and PtmQ12 while CBS 281.31 showed 350 amplification for PttQ1, PttQ2, PttQ5, PtmQ7, PtmQ8, PtmQ9. The Ptt positive control 351 isolates NB63i, NB29 and NB50 and the Ptm positive controls HRS06033, SNB113 and 352 HRS07033 showed amplification for the six Ptt specific primers pairs and the six Ptm specific 353 primer pairs, respectively. Isolate WAC10721 and the laboratory produced hybrid isolates used 354 as controls amplified a mixture of both Ptt and Ptm specific primer pairs. The two hybrid 355 isolates H-919 and CBS 281.31, along with the previously reported hybrid WAC10721, were 356 removed from subsequent analyses characterizing the genetic structure and genetic diversity of 357 Ptt.
358 Analysis of molecular variance. AMOVA showed significant genetic variation among 359 countries, accounting for 19.13% (P = 0.001) of the total genetic variation, while variation 360 among isolates within populations was 82.59% (P = 0.001) (Table 1). Within population, 361 among regions/states variation accounted for 17.40% (P = 0.001) of the total genetic variation.
362 Considering the country and the year of collection, no significant genetic variation (P = 0.259) 363 was observed among populations (0.52%). Out of the total genetic variation in Australia, 7.01%
364 (P = 0.001) was observed among states in Australia, while genetic variation among regions in 365 Hungary (2.08%) and RSA (1.78%) was not significant (P = 0.072). The variation for the year
366 of collection of Ptt isolates for the total genetic variation in Australia (0.12%) and Hungary 367 (0.99%) were not significant (P = 0.415 and 0.192 respectively).
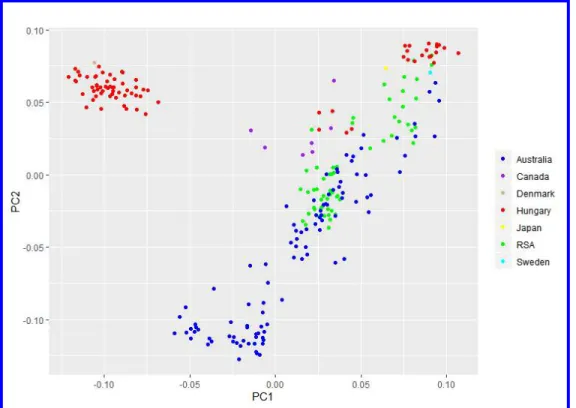
368 Population structure based on multivariate cluster analyses. In the PCA plot, 369 principal component 1 (PC1) separated a group of Australian isolates (n = 45) and another 370 cluster of Hungarian isolates (n = 55) along with the historical Danish isolate Pt-Pastorale from 371 the rest of the collection. Separation of the 45 Australian isolates from the rest of the collection 372 was further supported by PC2 (Fig. 2).
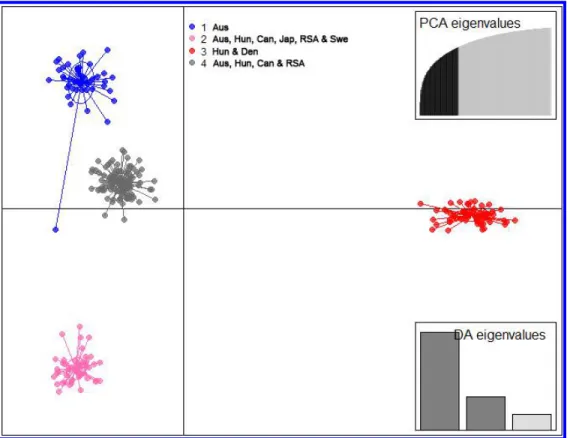
373 DAPC without a priori population assignment indicated the presence of four clusters for 374 the entire clone-corrected collection (Fig. 3). All isolates in cluster 1 (n = 46) were from 375 Australia, while cluster 3 consisted of 55 Hungarian isolates and isolate Pt-Pastorale from 376 Denmark. Cluster 4 consisted of isolates from Australia (n = 44), Canada (n = 6), Hungary (n 377 = 5) and RSA (n = 40). Cluster 2 contained isolates from Australia (n = 10), Hungary (n = 18), 378 RSA (n = 19) and one each from Canada (MB05), Japan (CSB 282.31) and Sweden 379 (UPSC1838).
380 Individual DAPC results obtained for each population from Australia, Hungary and RSA 381 showed three clusters each (Supplementary Fig. S2A, B and C). These clusters contained 382 isolates from different regions/states within the respective countries, except for cluster 3 in the 383 Australian population which contained isolates only from QLD, SA and WA (Supplementary 384 Fig. S2A). Cluster_1 and cluster_3 obtained from the individual DAPC plot of Australian 385 isolates consisted of isolates present in cluster 1 from the entire clone-corrected DAPC plot.
386 Cluster_2 contained isolates present in cluster 2 and cluster 4 from the entire clone-corrected 387 DAPC plot. Cluster_1 and cluster_3 isolates from the individual Hungarian DAPC plot 388 contained isolates present in cluster 3 from the entire clone-corrected DAPC plot and cluster_2 389 contained isolates present in cluster 2, cluster 3 and cluster 4 from the entire clone-corrected
391 present in cluster 4 and cluster 2 from the entire clone-corrected DAPC plot, respectively, while 392 cluster_3 contained isolates present in both cluster 4 and 2 from the entire clone-corrected 393 DAPC plot.
394 Population structure based on model-based cluster analyses. STRUCTURE analysis 395 of 247 isolates determined that three clusters best described the data (Supplementary Fig. S3A).
396 In the three-clusters STRUCTURE model, genotypes from Australia tended to have 397 intermediate membership in multiple clusters, while genotypes from RSA and Hungary tended 398 to have high membership proportions in a single cluster. Using a 70% cutoff on membership 399 proportions to assign a genotype into a cluster, a first cluster (cluster I) consisted of 46 isolates 400 from Australia, a second cluster (cluster II) consisted of 55 isolates from Hungary and 1 isolate 401 (Pt-Pastorale) from Denmark and a third cluster (cluster III) consisted of 145 isolates from 402 Australia (n = 54), Canada (n = 6), Hungary (n = 23), RSA (n = 59) and historical isolates (n = 403 3) (Supplementary Table S1 and Fig. 4). Many genotypes from Australia (cluster III) had 404 shared ancestry with genotypes from RSA and are thus, admixed in the three-cluster model.
405 The six Canadian isolates along with the historical Canadian isolate were also found to be 406 admixed (cluster III). At K=3, historical isolates from Japan and Sweden had high membership 407 in the cluster present in RSA, Hungary and Australia, while the historical isolate from Denmark 408 had high membership in the cluster specific to Hungary.
409 Genetic structure was also analysed independently for each population to identify 410 further subdivision within countries. The mode of ΔK was observed at K=2 for the Australian, 411 Hungarian and RSA populations (Supplementary Fig. S3B, C and D). The individual 412 STRUCTURE analysis for Australian isolates showed that 50% and 43% of the isolates 413 clustered into either cluster_I or cluster_II, with membership proportions of >70% for the 414 respective clusters, while 7% of isolates were considered admixed due to membership 415 proportions of <70% for both clusters (Supplementary Fig. S4A). The Hungarian isolates
416 showed two clusters, cluster_I and cluster_II) containing 71% and 29% of the isolates, 417 respectively, with no admixed individuals. The two clusters, cluster_I and cluster_II, from the 418 STUCTURE analysis of RSA isolates contained 68% and 17% of the isolates with membership 419 proportions of >70% for the respective clusters and 9% admixed isolates that were not assigned 420 to either of the clusters. The clusters obtained for the Australian, Hungarian and RSA 421 populations were compared to the year and field/state of collection and no association was 422 found.
423 Cluster_I and cluster_II obtained from the individual Australian STRUCTURE analysis 424 consisted of isolates present in cluster III and I from the entire clone-corrected STRUCTURE 425 analysis, respectively. Cluster_I and cluster_II from the Hungarian STRUCTURE analysis 426 contained isolates present in cluster II and cluster III from the entire clone-corrected 427 STRUCTURE analysis, respectively. Both cluster_I, cluster_II and admixed isolates from the 428 individual RSA STRUCTURE analysis contained isolates present in cluster III from the entire 429 clone-corrected STRUCTURE analysis.
430 The DAPC and STRUCTURE analyses of the entire clone-corrected collection resulted 431 in identification of four and three clusters, respectively. Cluster 1 and cluster 3 from the DAPC 432 analysis corresponded to cluster I and cluster II from the STRUCTURE analysis, respectively.
433 Isolates present in cluster 2 and cluster 4 from the DAPC analysis corresponded to the isolates 434 in cluster III from the STRUCTURE analysis. Therefore, DAPC analysis characterized the 435 population subdivision in the dataset with higher resolution than STRUCTURE analyses 436 (Jombart et al. 2010), thus, clusters detected by DAPC were further used to calculate the sexual 437 recombination and genetic diversity.
438 Population structure based on phylogenetic network. The Neighbor-net phylogenetic 439 network inferred using Splitstree showed extensive reticulation connecting all isolates (Fig. 5),
440 consistent with a history of recombination. The structure of the network indicated that 441 genotypes from different countries could be closely related (Fig. 5.). Historical Danish isolate 442 Pt-Pastorale, Japanese isolate CBS282.31 and Swedish isolate UPSC1838 grouped with 443 Hungarian genotypes.
444 Identification of mating type and sexual recombination. Amplification of Ptt isolates 445 with mating type primers indicated that 47 Australian isolates had the MAT1-1 idiomorph 446 (mating type 1) while the remaining 53 carried the MAT1-2 idiomorph (mating type 2) 447 (Supplementary Table S3). For Hungary, 37 isolates were found to be MAT1-1, and 41 isolates 448 were MAT1-2. Out of 59 RSA isolates, 39 were MAT1-1 and 21 were MAT1-2. Mating type 449 ratios calculated for populations from Australia, Hungary and RSA based on clusters identified 450 with country-specific DAPC analyses (Supplementary figure S2) showed that except cluster_2 451 from RSA (P = 0.021) the chi square values for the clusters from Australia, Hungary and RSA 452 did not significantly differ from the expected ratio of 1:1 under panmixia. PHI rejected the null 453 hypothesis of clonality in cluster_2 (P = 0.014) in Australia and cluster_1 (P = 4.8E-4) and 3 454 (P = 0.007) in Hungary while other clusters from Australia (cluster_1 and cluster_3), Hungary 455 (cluster_2) and RSA (cluster_1, cluster_2 and cluster_3) did not show evidence for 456 recombination (Supplementary Table S3).
457 Genetic diversity. The number of eMLGs calculated for Australia, Hungary and RSA 458 was 10. The highest genetic diversity indices among three countries for the non-clone corrected 459 data set were observed for the population from Hungary, with a normalised Shannon-Wiener 460 index and Nei’s unbiased gene diversity index of 0.992 and 0.184, respectively (Table 2). The 461 lowest normalised Shannon-Wiener index, 0.973, and Nei’s unbiased gene diversity index, 462 0.143, were calculated for the population from RSA. The highest value for Simpson's 463 complement index of multilocus genotypic diversity was 0.991, exhibited by the Australian
464 population, while the lowest value, 0.986, was reported for the population from RSA. However, 465 the overall genetic diversity within the populations was high.
466 The highest genetic diversity indices for the clusters detected by DAPC were observed 467 for Hungarian isolates with a normalised Shannon-Wiener index and Nei’s unbiased gene 468 diversity index of 0.935 and 0.279, respectively (Supplementary Table S4). The lowest total 469 normalised Shannon-Wiener index, 0.859, and Nei’s unbiased gene diversity index, 0.224, 470 were observed for the clusters from RSA. The highest Simpson's complement index of 471 multilocus genotypic diversity was 0.990, exhibited by the Australian population, while the 472 lowest value, 0.983, was reported for the population from RSA.
473 Variant annotation and associated genes. Out of 5,890 markers used for the DAPC 474 and PCA analyses of the entire clone-corrected collection, 66 were found to be significantly 475 associated with the genetic differences of clusters and subdivisions (P < 0.0001) detected by 476 DAPC and PCA respectively. Out of 66 markers, 34 were aligned with reference genomes with 477 the E-values (expected value) ranging from 8.4E-33 to 1.7. Out of these 34 markers, four 478 markers aligned with known genes, another four were not situated near genes, five aligned with 479 genes of uncharacterized proteins and 21 aligned with genes for hypothetical proteins in the 480 reference Ptt genomes (Supplementary Table S2). The four markers aligned with genes were 481 associated with ND89-9 nonribosomal peptide synthetase 2 (GenBank accession number:
482 JQ582646), glyceraldeyde-3-phosphate dehydrogenase-like protein (GPD1) gene (GenBank 483 accession number: JQ837863), endo-1,4-beta-xylanase A mRNA (GenBank accession number:
484 JX900133) and cytochrome P450 lanosterol 14 alpha-demethylase (CYP51A) gene (GenBank 485 accession number: KX578221). The identified hypothetical genes represented seven different 486 hypothetical proteins: ANK_REP_REGION domain-containing protein, DDE-1 domain- 487 containing protein, SET domain-containing protein, DUF1996 domain-containing protein,
488 Peptidase A1 domain-containing protein, AAA domain-containing protein and MFS domain- 489 containing protein in Ptt.
490 DISCUSSION
491 The present study investigates the most geographically diverse collection of Ptt isolates 492 analysed in a single study to date. It provides a comprehensive investigation of the genetic 493 structure of Ptt populations from different geographical areas through the implementation of 494 the genome-wide marker system, DArTseq™, and inclusion of a higher number of isolates 495 compared to previous studies. In this study, 247 Ptt MLGs, predominantly from Australia, 496 Hungary and RSA, were assessed in order to describe the genetic structure of Ptt isolates among 497 distinct geographical areas.
498 The genetic structure of the entire clone-corrected collection detected by the DAPC 499 analysis revealed the presence of four clusters. Two clusters contained some isolates from 500 Australia and Hungary, and all the isolates from Canada, RSA and all the historical isolates 501 except Pt-Pastorale from Denmark. The other two clusters were specific to Australian isolates 502 and Hungarian isolates along with the historical Danish isolate. STRUCTURE analysis also 503 revealed the presence of two distinct clusters for Australia (n = 46) and Hungary (n = 55) 504 reflecting their genetic isolation from each other based on geographical origin. Furthermore, 505 Neighbor-net phylogenetic network showed a distinct Hungarian cluster. In the Neighbor-net 506 phylogenetic network, the Ptt isolates from Australia, Canada, Hungary and RSA formed more 507 than one subdivision per country. The isolates from these subdivisions did not relate to their 508 year of collection or the region/state of origin. Therefore, the underlying factor for the genetic 509 isolation of Ptt populations from the same geographical area might include other variables such 510 as varietal differences (Fowler et al. 2017), fungicide regimes, geographical isolation or 511 environmental factors.
512 A number of different analyses used in this study identified the admixed nature of 513 multiple isolates mainly from Australia. STRUCTURE based cluster analysis revealed that 514 there were population subdivisions in Hungary and Australia, and that one of the clusters 515 present in each of these countries shared recent ancestry with the cluster containing the 516 Canadian, RSA and most of the historical isolates. Cluster analyses results also showed more 517 admixture in Australia than in Hungary. DAPC and highly reticulated Neighbor-net 518 phylogenetic network also gave evidence that these isolates are of mixed origin. In the 519 Neighbor-net phylogenetic network, some of the isolates from the same countries were closely 520 related to isolates from other countries. Even though some isolates from subdivisions of 521 Australia and RSA showed mixed origin/multiple origins, others showed ancestry in a single 522 group, suggesting that these isolates could have evolved from a common ancestor or an 523 introduction of isolates from a common population and then adapted to the respective 524 environments through sexual reproduction. The admixed origin of isolates could have resulted 525 from gene flow among countries. Gene flow is one of the main evolutionary forces affecting 526 in the genetic structure of a pathogen (Rogers and Rogers 1999). As Ptt is a seed borne 527 pathogen (Liu et al. 2011), gene flow/introduction of isolates from one geographical area to 528 another is possible through seed exchange and then adaptation to local environments. This may 529 have occurred in the case of Australian Ptt isolates, which have been suggested by Fowler et 530 al. (2017) to have evolved and adapted to regional barley cultivars in Australia.
531 Individual STRUCTURE analyses of Australian, Hungarian and RSA isolates indicated 532 that some of the isolates from Australia and RSA were admixed while isolates from Hungary 533 showed no admixture. The potential admixture found within Australian and RSA isolates could 534 have resulted from the dispersion of the pathogen through sexual reproduction and lack of 535 varietal specialization within the country. The absence of admixed in Hungarian isolates might
536 have been caused due to physical and reproduction barriers in the dispersion of the pathogen, 537 host specialization and/or recent introduction of isolates.
538 The genetic structure of Ptt populations detected in model-based cluster analyses did not 539 correspond to the region/state or the year of collection of the isolates, hence, factors 540 contributing to the genetic structure of Ptt populations were investigated by identifying the 541 markers underlying the genetic structure detected in DAPC and PCA. One of these markers 542 was located within the gene responsible for the nonribosomal peptide synthetases protein. The 543 nonribosomal peptide synthetases are responsible for the production of nonribosomal peptides, 544 which are bioactive secondary metabolites known to be involved in cellular development, 545 pathogenicity and stress responses in plant fungal pathogens (Keller et al. 2005; Sayari et al.
546 2019). The potential role of this locus in differential aggressiveness of Ptt isolates requires 547 further investigation. Other markers that were significantly associated with genetic structuring 548 of the Ptt populations included a glyceraldeyde-3-phosphate dehydrogenase-like protein 549 (GPD1) gene, an endo-1,4-beta-xylanase A mRNA gene, and a cytochrome P450 lanosterol 14 550 alpha-demethylase (CYP51A) gene. The GPD1 gene has been frequently used as a genetic 551 marker in phylogenetic studies to differentiate fungal pathogens including Pyrenophora teres 552 (Andrie et al. 2008; Lu et al. 2013; Zhang and Berbee 2001). GPD1 plays a major role in fungal 553 metabolic pathways like energy synthesis and biomass synthesis (Larsson et al. 1998). It has 554 been suggested that mutations in the glyceraldeyde-3-phosphate dehydrogenase gene 555 contribute to the nutrient uptake of phytopathogenic Colletotrichum spp. during their 556 biotrophic phase in the infection process on many perennial plants including olive, citrus and 557 tomato (Materatski et al. 2019; Wei et al. 2004). The enzyme endo-1,4-beta-xylanase plays a 558 vital role in the breakdown of xylan, a major component of plant cell walls (Nguyen et al.
559 2011), and the degradation of the plant cell wall has been correlated with virulence and 560 pathogenicity of phytopathogenic Fusarium spp. and Valsa spp. on tomato and apple (Gómez-
561 Gómez et al. 2001; Wang et al. 2014). Cytochrome P450 lanosterol 14 alpha-demethylase is 562 important for the biosynthesis of ergosterol, a primary fungal cell membrane sterol that is 563 responsible for maintaining membrane fluidity and stability (Koch et al. 2013; Luo and 564 Schnabel 2008; Parks and Casey 1995; Rodriguez et al. 1985). Mutations of this gene have 565 been associated with the demethylase inhibitor (DMI) or group 3 fungicide resistance in P.
566 teres (Ellwood et al. 2019; Mair et al. 2019). Considering the importance of these genes for 567 fungal virulence/pathogenicity, it is plausible that mutations at these loci are due to external 568 effects such as environmental factors and fungicide regimes. These factors may have driven 569 local and/or host adaptation of Ptt isolates in different regions, resulting in the distinct genetic 570 sub-structuring detected in this study.
571 Sexual recombination plays a major role in the evolution and adaptation of a pathogen 572 which may influence the genetic structure (Lee et al. 2010). Ptt is a well-known sexually 573 reproducing fungus (Liu et al. 2011). A mating type ratio of 1:1 is expected in the absence of 574 segregation distortion and clonal selection among mating types and the two mating types ratio 575 is equalized through sexual recombination in P. teres (Milgroom 1996; Rau et al. 2005). In the 576 current study, except for cluster_2 from RSA, other clusters collected from Australia, Hungary 577 and RSA did not deviate from the expected 1:1 ratio. Studies of Finish, Australian and 578 Canadian Ptt populations reported that the mating type ratio did not deviate from the expected 579 1:1 ratio (Akhavan et al. 2016b; Linde and Smith 2019; Rau et al. 2005; Serenius et al. 2005), 580 while studies of Ptt populations from Czech Republic and Slovakia, and Krasnodar, Russia 581 deviated from a 1:1 ratio (Leišová-Svobodová et al. (2014); Serenius et al. (2007)). Deviation 582 of mating type ratio in cluster_2, RSA and absence of sexual recombination evidence for cluster 583 1 and 3 from Australia, cluster 2 from Hungary and all clusters from RSA based on PHI test 584 results might have occurred due to unsystematic sampling or introduction of primary inoculum
586 and Hungary have been collected from different years. Therefore, further studies are necessary 587 with a higher number of isolates and intensive sampling methods to confirm the evidence for 588 sexual reproduction of Australian and Hungarian Ptt populations.
589 Previous studies have suggested that hybridization between the two types of P. teres is 590 rare or absent under field conditions due to the apparent genetic isolation of both forms 591 (Ellwood et al. 2012; Lehmensiek et al. 2010). Prior to this study, only four naturally occurring 592 putative hybrids had been detected from barley fields: one putative hybrid from the south- 593 western Cape of RSA (Campbell et al. 2002), two from Tovacov, Czech Republic (PTM-15 594 and PTM-16) (Leišova et al. 2005), and one from a barley field in Western Australia 595 (WAC10721) (McLean et al. 2014). In the current study, additional isolates from Hungary (H- 596 919) and Japan (CBS 281.31) were identified as putative hybrids based on distinct genetic 597 subdivision compared to the Ptt population and genetic similarity to the previously identified 598 hybrid WAC10721 in the Neighbor-net phylogenetic network. Amplification using Ptt and Ptm 599 specific DNA markers confirmed that these two isolates were hybrids. The isolate CBS 281.31 600 was originally identified as Pyrenophora japonica by Ito (Crous et al, 1995). Crous et al. (1995) 601 found a high degree of homology in restriction digestion (Hae III and Msp I) DNA banding 602 patterns and similar symptom expression on differential cultivars when comparing CBS 281.31 603 with Ptm isolates. In addition, similar morphological characterizations between these isolates 604 led Crous et al. (1995) to conclude that P. japonica was a synonym of P. teres. A recent study 605 by Marin-Felix et al. (2019) also referred to isolate CBS 281.31 as P. japonica and found that 606 the isolate grouped together with P. teres based on phylogenetic similarities. Marin-Felix et al.
607 (2019) agreed with the conclusion of Crous et al. (1995) that P. japonica was a synonym of P.
608 teres based on CBS 281.31 as the sole representative of P. japonica. A previous distance based 609 cluster analysis study, using seven RAPD markers and complemented with the two P. teres 610 form specific PCR markers developed by Williams et al. (2001), identified CBS 281.31 as a
611 Ptt isolate (Bakonyi and Justesen 2007). The types and small number of markers used might 612 be the reason for not detecting this isolate as a hybrid in previous studies. The Japanese isolate, 613 CBS 281.31 collected in 1931 was found to be a hybrid nearly a century after it was collected.
614 During the 89 years since it was collected, this hybrid could have crossed with many other 615 Japanese P. teres isolates, potentially influencing the genetic structure of the population. Sexual 616 recombination/hybridization between and within the forms of P. teres can potentially lead to 617 the generation of novel pathotypes. This may increase the genetic diversity of the population 618 and make disease management more challenging through changes in traits such as fungicide 619 resistance of the pathogen (Syme et al. 2018). Therefore, further population genetics studies 620 and pathotyping of Ptt populations are warranted.
621 In conclusion, the genetic structure and the genetic relationships of Ptt isolates collected 622 from different continents reported in this study indicated that some isolates from Australia, 623 Canada, Hungary and RSA shared ancestry with other countries while some of the isolates 624 from Australia and Hungary showed no admixture. Admixed origin among populations provide 625 crucial evidence for the spread of the pathogen. Identification of naturally occurring hybrids 626 supports the fact that the hybridisation between two forms of P. teres is possible, which may 627 lead to novel and more complex pathotypes and may cause unpredicted yield losses to the 628 barley industry. Hence, up to date knowledge about genetic structure and the genetic diversity 629 of geographically diverse P. teres populations is important to predict and implement efficient 630 disease management strategies and to develop resistant barley cultivars.
631
632 ACKNOWLEDGMENTS
633 We thank Dr Kelly Turkington’s group (Lacombe Research Centre, Canada) for 634 providing us with DNA of the Canadian isolates and Dr Simon Ellwood (Curtin University,
636 Tewoldemedhin (Agricultural Research Council, Republic of South Africa), Driecus Lesch 637 (Sensako Pty Ltd), Daniel De Klerk (South African Barley Breeding Institute), Elsabet Wessels 638 and Corneli Smit (CenGen) for the sample collection of the RSA isolates. We like to extend 639 our gratitude to Judy Mcllroy and Janet Barsby, Hermitage Research Facility, Warwick, 640 Australia for the assistance given with the Australian isolates. We are also grateful to Dr Deane 641 Smith (University of Southern Queensland, Australia) and Dr Michael D. Thompson (The 642 University of Queensland, Australia) for their technical support.
643
644 LITERATURE CITED
645 Akhavan, A., Turkington, T. K., Askarian, H., Tekauz, A., Xi, K., Tucker, J. R., Kutcher, H. R., and 646 Strelkov, S. E. 2016a. Virulence of Pyrenophora teres populations in western Canada. Can. J.
647 Plant Pathol. 38:183-196.
648 Akhavan, A., Turkington, T. K., Kebede, B., Xi, K., Kumar, K., Tekauz, A., Kutcher, H. R., Tucker, J.
649 R., and Strelkov, S. E. 2016b. Genetic structure of Pyrenophora teres f. teres and P. teres f.
650 maculata populations from western Canada. Eur. J. Plant Pathol. 146:325-335.
651 Andrie, R. M., Schoch, C. L., Hedges, R., Spatafora, J. W., and Ciuffetti, L. M. 2008. Homologs of 652 ToxB, a host-selective toxin gene from Pyrenophora tritici-repentis, are present in the genome 653 of sister-species Pyrenophora bromi and other members of the Ascomycota. Fungal Genet.
654 Biol. 45:363-377.
655 Bakonyi, J., and Justesen, A. 2007. Genetic relationship of Pyrenophora graminea, P. teres f. maculata 656 and P. teres f. teres assessed by RAPD analysis. Phytopathology 155:76-83.
657 Bogacki, P., Keiper, F. J., and Oldach, K. H. 2010. Genetic structure of South Australian Pyrenophora 658 teres populations as revealed by microsatellite analyses. Fungal Biol. 114:834-841.
659 Bruen, T. C., Philippe, H., and Bryant, D. 2006. A simple and robust statistical test for detecting the 660 presence of recombination. Genetics 172:2665-2681.
661 Bryant, D., and Moulton, V. 2004. Neighbor-net: an agglomerative method for the construction of 662 phylogenetic networks. Mol. Biol. Evol. 21:255-265.
663 Campbell, G. F., Lucas, J. A., and Crous, P. W. 2002. Evidence of recombination between net-and spot- 664 type populations of Pyrenophora teres as determined by RAPD analysis. Mycol. Res. 106:602-
665 608.
666 Crous, P., Janse, B., Tunbridge, J., and Holz, G. 1995. DNA homology between Pyrenophora japonica 667 and P. teres. Mycol. Res. 99:1098-1102.
668 DArTseq. 2020. DArTseq Data Types. Diversity Array Technology Pty Ltd, University of Canberra, 669 Monana st., Bruce, ACT 2617, Australia.
670 Deadman, M., and Cooke, B. 1989. An analysis of rain‐mediated dispersal of Drechslera teres conidia 671 in field plots of spring barley. Ann. Appl. Biol. 115:209-214.
672 Dray, S., and Dufour, A.-B. 2007. The ade4 package: implementing the duality diagram for ecologists.
673 J. Stat. Softw. 22:1-20.
674 Earl, D. A., and vonHoldt, B. M. 2012. STRUCTURE HARVESTER: a website and program for 675 visualizing STRUCTURE output and implementing the Evanno method. Conserv. Genet.
676 Resour. 4:359-361.
677 Ellwood, S. R., and Wallwork, H. 2018. Diseases affecting barley: net blotches. in: Integrated Disease 678 Management of Wheat and Barley. R. Oliver, ed. Burleigh Dodds Science Publishing,
679 Cambridge, UK.
680 Ellwood, S. R., Syme, R. A., Moffat, C. S., and Oliver, R. P. 2012. Evolution of three Pyrenophora 681 cereal pathogens: recent divergence, speciation and evolution of non-coding DNA. Fungal 682 Genet. Biol. 49:825-829.
683 Ellwood, S. R., Piscetek, V., Mair, W. J., Lawrence, J. A., Lopez‐Ruiz, F. J., and Rawlinson, C. 2019.
684 Genetic variation of Pyrenophora teres f. teres isolates in Western Australia and emergence of 685 a Cyp51A fungicide resistance mutation. Plant Pathol. 68:135–142.
686 Erwin, D. C., and Ribeiro, O. K. 1996. Phytophthora diseases worldwide. American Plant Pathological 687 Society Press, St. Paul, Minnesota, USA