TO FINANCING OF SMES IN HUNGARY
Annamária Ónodi Kazai
ABSTRACT
Th e present study was prepared within the framework of cooperation between the Competitiveness Research Centre, operating within the Institute of Business Economics of Corvinus University of Budapest, and the National Association of Entrepreneurs, based on a commission from the latter. Th e goal of the study was to survey the self-fi nancing capabilities and borrowing opportunities of majority Hungarian-owned small and medium-sized enterprises (SMEs), and to identify potential problems. Th e results of the research revealed that the high proportion of owner’s equity in the fi nancing structure is not due to diffi culties with borrow- ing, but because enterprises that cover their fi nancing primarily from their own resources have other fi nancing opportunities at their disposal. Although general satisfaction with banks shows a diminishing tendency, it can still be interpreted favourably. Th e majority of companies have not encountered serious borrowing diffi culties. With regard to the system of competitive tenders, company managers have sensed some improvement, but general satisfaction is still lacking. Although the research results suggest that the primary obstacle to growth in 2013 was not the lack of credit or external funding, it is important to emphasize that start-ups, young enterprises and micro-enterprises, which struggle the most with fi nancing worries, were not represented in the analysed database.
JEL code: G2 and G3
Keywords: corporate fi nance, capital structure, banking services, borrowing, ten- dering system
INTRODUCTION
Th e present study was prepared within the framework of cooperation between the Competitiveness Research Centre, operating within the Institute of Business Economics of Corvinus University of Budapest, and the National Association of Entrepreneurs, based on a commission from the latter. We sought answers to the questions of what characterizes the fi nancing structure of the Hungarian SME sector; what are its self-fi nancing capabilities; what are the available borrowing or EU funding opportunities; and what problems are experienced by domestic enterprises in the area of capitalization and fi nancing. Th e basis for our research
was the 2013 corporate competitiveness research database, the fi ft h element of the Competitiveness Research Centre’s “In Global Competition” research pro- gramme series. Th e survey was carried out between May and November 2013, with the cooperation of staff from the TÁRKI institute for social research.
RESEARCH METHODOLOGY
In examining the fi nancing structure and capitalization of enterprises, it is particularly important for us to be clear about the characteristics of the circle of companies under examination. In the 2013 corporate competitiveness survey that serves as the basis for our research, incorporated companies employing more than 50 people and operating for at least four years were sought, ensuring a repre- sentative sample in terms of both size and geographical distribution. Th e sample of 300 companies was dominated by medium-sized enterprises (72.7%), while the proportion of large companies was 16.7%. Th e majority of companies (45%) oper- ated in the processing industry, but commerce (20%), construction, other servic- es, agriculture and the food industry were also represented. Most of the compa- nies were domestically owned (71.3%), while the proportion of state-owned fi rms was 5.7%, and the proportion of those in foreign ownership 23%. (For a detailed description of the sample, see Chikán – Czakó – Wimmer, 2014.)
Our investigation focused on SMEs in majority domestic ownership. Th e propor- tion of majority domestic-owned small enterprises within the sample as a whole was below 10% (29 companies), while more than half of the companies in the sample (170 companies) were domestically owned medium-sized enterprises. Our population for the purposes of this study, therefore, was 199 companies. Th e will- ingness to provide answers to the various questions in the questionnaire varied between 100% and 18% (in the case of borrowing goals). It follows from this that we were able to draw conclusions from samples of varying size for each of the groups of questions. Th e average number of employees in the examined sample was 81. Less than half of the companies were engaged in export activity, while 24%
revealed an export intensity of above 50%.
In order to conduct a more nuanced analysis of capital structure, credit practices and banking relations, we applied a cluster analysis to classify the companies in three groups based on capital structure and frequency of borrowing, thereby per- mitting – among other things – a comparison of domestic-owned SMEs fi nanced primarily from owner’s equity with those characterized by frequent borrowing.
Examining the fi nancing and liabilities structure of enterprises, we observed that within the sample, some 46.7% of majority domestic-owned small and me- dium-sized enterprises (SMEs) never or only rarely took advantage of bank loans.
Frequent borrowing characterized 36% of the companies (see Table 1). Th ese fi nd- ings are in keeping with the 2009 Monitoring Report laying the foundations for SMEs’ strategy, which states that enterprises fi nance their developments primar- ily from their own resources, and secondarily from bank loans. Between 2000 and 2005, some 20–25% of enterprises held credit, refl ecting increasingly active borrowing in the SME sector aft er 2000, which was subsequently halted by the impact of the 2009 economic crisis (see Gál 2013, Ganczer 2010, Monitoring Re- port 2009). Th e borrowing activity of the Hungarian SME sector falls short of the European Union average (see Monitoring Report 2009).
Table 1
Frequency of borrowing by majority domestic-owned SMEs in 2013
No. %
Never (1) 41 32.0
Rarely (2) 19 14.8
To a moderate degree (3) 22 17.2
Frequently (4) 16 12.5
Very frequently (5) 30 23.4
Total 128 100.0
Source: Competitiveness database
For a more detailed analysis of the liabilities structure, we carried out a clus- ter analysis, in which we relied on both 2012 fi nancial data and the frequency of borrowing according to enterprises’ own self-assessments. As a fi rst step, we established indebtedness categories based on balance sheet data. We listed com- panies in six groups based on whether they had long-term liabilities or short-term outstanding loans as of 31 December 2012, as well as on the proportion of owner’s equity within their total liabilities. Table 2 contains the average data of fi nancial indicators of those companies, which proved satisfactory at a preliminary fi nan- cial reliability examination (the assets / liabilities equation), or which did not have negative equity. Within the sample as a whole, fi ve companies had negative eq- uity, representing less than 3% of the sample.
At 44% of the examined companies, the proportion of long-term external liabili- ties was signifi cant (14.28%), alongside the ratio of short-term credit (15.56%).
(See Table 2, indebtedness category 6.) Th is is partly in keeping with the results of the 2003 survey by Sinkovics, who revealed a 13% proportion of long-term credit at small enterprises and a 36% ratio of short-term loans based on analysis of 2002 balance sheet data. At medium-sized enterprises, his calculations showed that the proportion of long-term liabilities was 72%, while the ratio of short-term loans was 23%. Based on our investigation, in the most indebted company category the average proportion of owner’s equity was 35.8%, which is below the 2002 average 41% ratio showed by Sinkovics. Although the companies belonging to category 5 had long-term external liabilities, the average proportion of owner’s equity was 75%. A high proportion of owner’s equity also characterized companies falling into indebtedness categories 1 (79.8%) and 3 (77.67%). Companies in category 1 had neither long-term liabilities nor short-term credit, while the proportion of accounts payable to suppliers was below 6%. Although enterprises falling into cat- egory 3 held short-term credit, its ratio did not reach 6% on average. Overall 41%
of the examined companies had a ratio of owner’s equity to total liabilities higher than 75% (categories 1, 3 and 5). Th e liabilities structure of enterprises belonging to categories 2 and 4 was not unequivocal based on the supplied fi nancial data, the calculated indicators showing a low proportion of owner’s equity (32–33%).
In category 2, besides owner’s equity, fi nancing derived mainly from accounts payable, while in category 4 both accounts payable (24.8%) and short-term credit (20%) played a strong role in fi nancing. Th e obtained results are comparable with the results of Gál’s 2013 cluster analysis. In the latter survey, the proportion of companies fi nanced almost exclusively from owner’s equity was 27%, which ap- proximately tallies with the proportion of 24.5% for the fi rst two categories in the classifi cation employed by us.
Financing structure of domestic SMEs broken down by indebtedness categories (indicators calculated from balance sheet data aft er fi nancial cleaning)
Indebtedness category Distribution of companies Owner’s equity/ Balance sheet footing 2012 Long-term liabilities / Balance sheet footing 2012 Short-term credit / Balance sheet footing 2012 Accounts payable/ Balance sheet footing 2012
n= (25) 16.34% 79.82% 0.00% 0.00% 5.77%
n= (11) 7.19% 33.71% 0.00% 0.00% 19.80%
n= (7) 4.58% 77.67% 0.00% 5.73% 6.92%
n= (11) 7.19% 32.35% 0.00% 20.05% 24.83%
n= (31) 20.26% 75.23% 3.74% 4.18% 6.61%
n = (68) 44.44% 35.81% 14.28% 15.56% 13.91%
Total
n = (153) 100.00% 52.50% 7.11% 11.06% 11.99%
Th e formation of clusters took place based on the indebtedness categories pre- sented above and the frequency of borrowing by enterprises (see Table 1), thus identifying three principle groups (see cluster sample sizes in Table 3). Th e fi rst group contained companies essentially fi nancing from their own resources. In 2012, the average proportion of self-fi nancing at these companies was 70%, with no long-term liabilities based on 2012 balance sheets and a ratio of short-term credit of 2.3% (see Table 4). More than half of these companies (51.5%) did not take out loans at all and 15% only rarely, while some 30% typically borrowed to a moderate degree (see Table 5). In the other two clusters, the proportion of owner’s equity was below 50%, the ratio of long-term liabilities 8–9%, and the proportion of short-term credit 12–16%. Despite the fact that the fi nancing structure of the two clusters of companies appears similar based on fi nancial data, there is a sig- nifi cant diff erence in their frequency of borrowing. Based on self-assessments in the second cluster, borrowing is relatively rare, while all companies in the third cluster declared that they had oft en made use of credit. (For detailed data, see Tables 3, 4 and 5.)
Table 3
Sample sizes and proportions of fi nancing structure clusters within the sample as a whole, and among domestic SMEs
Financing structure clusters
Frequency in sample as a whole
Frequency among domestic SMEs
No. % No. %
Dominance of owner’s
equity 52 29.5% 33 27.70%
External fi nancing pre-
sent, borrowing rare 67 38.1% 44 37%
External fi nancing pre-
sent, borrowing frequent 57 32.4% 42 35.30%
Total 176 100% 119 100%
Table 4
Characteristics of fi nancing structure clusters among domestic SMEs (indicators calculated from balance sheet data)
Financing structure clusters
Owner’s equity / Balance sheet foot-
ing 2012
Long-term liabilities /
Balance sheet foot-
ing 2012
Short- term credit / Balance sheet foot-
ing 2012
Accounts payable /
Balance sheet foot-
ing 2012 Dominance of
owner’s equity (n=26)
70.5% 0.0% 2.3% 10.9%
External fi nancing present, borrowing rare (n=38)
45.8% 9.4% 16.8% 14.5%
External fi nancing present, borrowing frequent (n=35)
48.6% 8.3% 12.1% 11.5%
Frequency of borrowing among domestic
SMEs broken down by fi nancing structure clusters
Dominance of owner’s equity External fi nancing present, borrowing rare External fi nancing present, borrowing frequent
No. % No. % No. %
Never (1) 17 51.5% 21 47.7% 0 0.0%
Rarely (2) 5 15.2% 12 27.3% 0 0.0%
To a moderate degree (3) 10 30.3% 11 25.0% 0 0.0%
Frequently (4) 0 0.0% 0 0.0% 15 35.7%
Very frequently (5) 1 3.0% 0 0.0% 27 64.3%
Total 33 100.0% 44 100.0% 42 100.0%
Beyond analyzing the 2012 fi nancial data, we were able – based on the assessments of company managers – to fashion a comparative picture of the 2013 corporate fi nancing structure which corroborated the earlier fi ndings. At companies pri- marily fi nancing from owner’s equity, the proportion of external resources was around 20%, while the ratio of short-term resources was the lowest (17%), within which the most signifi cant element was the stock of accounts payable. Th e pro- portion of external resources was highest (35.47%) within the group characterized by frequent borrowing, as was the ratio of short-term resources (44%), within which the two most decisive elements were short-term bank loans (42%) and the stock of accounts payable (30%).
To gain a closer understanding of companies’ fi nancing policy, it helps to examine the priorities of their fi nancial strategy. Company managers were asked to evalu- ate 11 possible fi nancial priorities based on how much these characterized their own corporate practice. Th e most striking diff erence was that the maintenance of liquidity was the most important consideration in the fi nancial strategies of companies which borrow frequently, preceding profi tability in second place.
In the other two clusters, the most important priority was to reduce costs. In the case of companies primarily fi nancing from owner’s equity, this was followed by the observance of payment commitments and deadlines; while in the case of companies borrowing only rarely, profi tability came second, but the maintenance of liquidity did not even feature among the fi ve most important priorities. Fac-
tors that potentially contribute to the liquidity problems of frequently borrowing companies – in their own assessment – are their weaker self-fi nancing capabilities and profi tability below the industry average. By contrast, companies which did not borrow frequently assessed their profi tability at around or above average. In his 2013 survey, Gál likewise determined that higher profi tability was paired with a higher ratio of owner’s equity.
CREDIT PRACTICES AND BANKING RELATIONS
Among the examined companies, on average more than half of the credit taken out (55%) was in the form of short-term forint loans, followed by a proportion of long-term forint loans of above 40%. Credit provided by owners was seen to the greatest extent (30%) at companies primarily fi nancing from owner’s equity, while the lowest proportion in this regard (9.9%) was observed at regularly borrowing companies. Companies fi nancing from owner’s equity did not take out foreign currency credit, the proportion of which was highest at companies borrowing only rarely (25.9%).
Among majority domestic-owned SMEs, the most common goal of borrowing was to purchase machinery, equipment and vehicles. Th e same can be said of companies characterized by frequent borrowing, where typically there was almost no settlement of bank debts or purchase of real estate. Of companies primarily fi nancing from their own resources, only four companies answered this question (4%), and for these companies – besides the purchase of machinery, equipment and vehicles – the purchase of materials and payment of tax debts featured with close to the same frequency (see Table 6).
Generally speaking, the managers of domestic-owned SMEs did not perceive borrowing as a signifi cant problem. Loans of less than a year’s maturity were easier to access than long-term credit (statistical tests corroborating the diff er- ence). Some 22% of companies felt it was diffi cult to take out loans of less than one year, while this ratio was 27% for loans of more than one year. Some 40% of the SMEs questioned reported no problems either borrowing for less than one year or for more than one year (see Table 7).
Borrowing goals
Financing structure clusters
Borrowing goals
Domestic- owned
SMEs (n = 36)
Dominance of owner’s
equity (n=4)
External fi nancing
present, borrowing rare (n=13)
External fi nancing
present, borrowing
frequent (n=41) Purchase of machinery,
equipment and vehicles 3.17 3.50 2.31 3.82
Purchase of real estate 1.83 2.25 1.46 1.64
Purchase of materials 2.61 3.50 2.38 2.30
Wage payments 1.94 2.50 1.62 2.20
Payment of debts
to suppliers 2.09 2.00 1.69 2.55
Payment of bank debts 1.97 2.75 1.54 1.80
Payment of tax debts 2.00 3.25 1.54 2.20
On a 5-grade Likert scale – 1: did not occur at all, 5: was very frequent
Table 7
Access to credit – opinions of the domestic-owned SME sector
Loans of up to
one year
Loans of more than one year
No. % No. %
Unable to access loan 8 6.5 13 10.7
Diffi cult to access loan 20 16.3 20 16.5
Moderately diffi cult 43 35.0 39 32.2
Easy access to loan 24 19.5 26 21.5
Very easy access 28 22.8 23 19.0
Total 123 100.0 121 100.0
Regular borrowers found securing loans the easiest, while those fi nancing pri- marily from owner’s equity found it moderately diffi cult. Th is means that a high proportion of owner’s equity at a company cannot be attributed to borrowing dif- fi culties, but may rather be explained by the fact that such companies have other fi nancing options at their disposal and are not obliged to take out credit.
Th e obtained results are in keeping with the 2009 Monitoring Report, where – among other things – participants were questioned about factors hindering growth. In 2009, companies saw high tax and social security burdens, the unpre- dictability of economic regulations, insuffi cient demand and intense competition as the factors most hindering growth. On a scale of 100, they rated insuffi cient capital at 31 and a shortage of credit at 15, compared to a value of 76 assigned to high taxes, for example (see Monitoring Report 2009). A 2006 survey by the European Commission also revealed no serious fi nancing problems, with 86% of companies declaring themselves satisfi ed with their fi nancing situation (cited by Ganczer T., 2010). We can thus assume that in 2013, it is not a lack of credit which has primarily hindered the growth of Hungary’s SME sector.
Despite the fact that accessing loans is not a serious problem for the majority of SMEs, opportunities for accessing credit were seen as deteriorating compared to the years preceding the crisis. Overall, no statistically signifi cant diff erence was ap- parent in the assessment of short or long-term loans. Less than 15% of companies sensed improving tendencies, while the majority (43–47%) experienced no change in borrowing opportunities and more than 40% saw deteriorating tendencies (see Table 8). Examining the question according to fi nancing structure clusters, the situation gives even greater pause for thought. On the one hand, the average opinion in all the clusters indicated a deteriorating tendency, while on the other hand frequent borrowers – as the companies with the greatest amount of experi- ence of taking out credit – gave the most negative assessment of the direction of change. In this cluster of companies, we experienced a statistically signifi cant dif- ference with regard to the diffi culty of accessing short or long-term loans. In the case of long-term credit, the change was seen as even more unfavourable. Th ese deteriorating borrowing opportunities are corroborated by several other studies.
Changes in opportunities for accessing credit compared to the pre-crisis period – opinions of the domestic-owned SME sector
Loans of up to
one year
Loans of more than one year
No. % No. %
Signifi cantly
deteriorated 16 12.8 14 11.8
Deteriorated 38 30.4 36 30.3
No change 54 43.2 56 47.1
Improved 13 10.4 8 6.7
Signifi cantly
improved 4 3.2 5 4.2
Total 125 100.0 119 100.0
Despite the assessment of companies that borrowing opportunities have deterio- rated compared to the pre-crisis situation, the general level of satisfaction with banks can still be seen as favourable. Th is is also apparent in the fact that the ma- jority of enterprises said they do not intend to change their bank. Th e likelihood of changing banks was greatest at companies that borrow frequently, 21% of whom regarded this as conceivable in future.
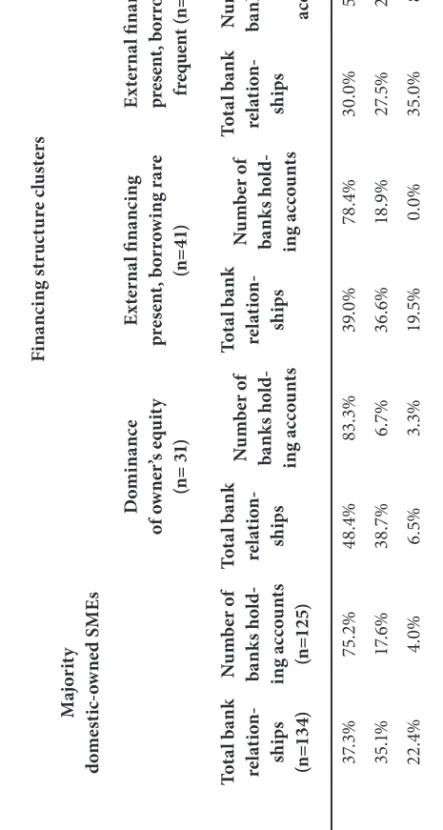
Some 75% of majority domestic-owned SMEs had accounts at a single bank, this proportion being even higher (83%) in the case of companies primarily fi nancing from their own resources. However, among frequent borrowers this fi gure was only 59% (in this cluster, 29% of companies had accounts at two banks, and 8%
at three banks). Th e majority of companies had relationships with two or three banks. Frequently borrowing companies had dealings with signifi cantly more banks (2.28) than those primarily fi nancing from owner’s equity (1.74). (See de- tailed data in Table 9.)
Table 9 Distribution of companies according to number of banking relationships
Nu mb er of ba nk rela tio nship s
Majority domestic-owned SMEs
Financing structure clusters Dominance of owner’s equity (n= 31)
External fi nancing present, borrowing rare (n=41)
External fi nancing present, borrowing frequent (n=40) Total bank relation- ships (n=134)
Number of banks hold- ing accounts (n=125) Total bank relation- ships
Number of banks hold- ing accounts Total bank relation- ships
Number of banks hold- ing accounts Total bank relation- ships
Number of banks hold- ing accounts 137.3%75.2%48.4%83.3%39.0%78.4%30.0%59.5% 235.1%17.6%38.7%6.7%36.6%18.9%27.5%29.7% 322.4%4.0%6.5%3.3%19.5%0.0%35.0%8.1% 4 or more5.2%3.2%6.5%6.7%4.9%2.7%7.5%2.7% Total100.0%100.0%100.0%100.0%100.0%100.0%100.0%100.0%
bank (a grade of 4 on a 5-grade scale). No statistically signifi cant diff erence could be shown between the general assessments of frequent borrowers and companies primarily fi nancing from owner’s equity; however, diff erences could be observed regarding individual elements of the banking relationship. In general, companies evaluated the fl ow of obligatory or requested information the most favourably (grade above 4). While frequent borrowers felt that the fl ow of information from their company to the bank was stronger (4.61 compared to 4.16), companies primarily fi nancing from equity regarded the bank’s supply of information more favourably (3.91 in the case of voluntary supply of information) than frequent borrowers (3.55). Th e least favourable assessments were given for notifi cation of changes in the fi nancial environment (3.46) and the solving of problems beyond obligatory tasks (3.49), but even in these two cases we can speak of neutral rather than negative assessments. A comparison of banking assessments also confi rms the earlier conclusion that the reason companies primarily fi nancing from equity do not generally take out bank loans is not that they would not be granted them, or that they have a bad opinion of banks, but rather because they have diff erent fi nancing policies. It is important to add to this conclusion that, as a basic principle in conducting research into competitiveness, incorporated companies employing more than 50 people and operating for at least four years were sought in forming the sample.
In the case of more than 70% of companies in the examined sample of domestic- owned SMEs, there was no request to reschedule loan repayments or interest payments, nor any payment default. Frequent requests for rescheduling arose at only 12% of the companies borrowing most frequently, while no companies did so in the other two clusters. Companies regarded default on payment as even less typical. Around 20% of frequent borrowers declared that default on loan repayments or interest payments was moderate, while – in their own assessment – this was not typical at all of 78% of these companies. (See Tables 10 and 11.)
Table 10
Frequency of requests to reschedule loan repayments or interest payments
Frequency of rescheduling
requests
Financing structure clusters Domestic-
owned SMEs (n = 90)
Domi- nance of owner’s
equity (n=13)
External fi nancing
present, borrowing rare
(n=24)
External fi nancing
present, borrowing frequent (n=41)
Never 71.1% 69.2% 70.8% 75.6%
Rarely 11.1% 7.7% 12.5% 12.2%
Moderate 10.0% 23.1% 16.7% 0.0%
Frequent 7.8% 0.0% 0.0% 12.2%
Very frequent 0.0% 0.0% 0.0% 0.0%
Total 100.0% 100.0% 100.0% 100.0%
Table 11
Frequency of default on loan repayments or interest payments
Frequency of default on payment
Financing structure clusters Domestic-
owned SMEs (n = 92)
Domi- nance of owner’s
equity (n=14)
External fi nancing
present, borrowing rare
(n=24)
External fi nancing
present, borrowing frequent (n=41)
Never 77.2% 92.9% 79.2% 78.0%
Rarely 8.7% 0.0% 20.8% 2.4%
Moderate 12.0% 7.1% 0.0% 19.5%
Frequent 0.0% 0.0% 0.0% 0.0%
Very frequent 2.2% 0.0% 0.0% 0.0%
Total 100.0% 100.0% 100.0% 100.0%
Of the surveyed domestic-owned SMEs, 65% did not take part in any tenders at all between 2009 and 2013. Th e greatest number of companies participated in tenders within the framework of the New Széchenyi Plan, followed in popularity by the New Hungary Rural Development Programme and support programmes fi nanced purely from domestic sources (ministries, local governments, foundations). (Th e values in Table 12 must be treated with caution as the proportion of those responding to ques- tions related to tenders was 51%. In the case of tenders, the distribution ratios were determined in proportion to the number of companies fi lling out the questionnaire, but in assigning values to all the tenders we presumed that companies not fi lling out the questionnaire had not taken part in any tenders at all.) However, a comparative evaluation of the tenders concerned provides us with a relatively reliable picture. Th e companies’ own assessments are in harmony with the actual frequency of participa- tion in tenders. In terms of improving the competitiveness of companies, the New Széchenyi Plan was regarded as the most important, followed by the New Hungary Rural Development Programme and support programmes fi nanced purely from do- mestic sources (ministries, local governments, foundations). (See Table 13.)
Some 43% of questioned companies sought help in writing applications for all tenders, while 35% had no help at all. On average companies worked with a collaborating part- ner in a little more than half of tenders (53.2%). More than half of respondent com- panies (54.4%) proved successful in all their tenders, while the proportion of those whose tender participation was always unsuccessful was less than 10%. Some 61.4%
of enterprises declared their intention to participate in various tenders in future.
Overall companies regarded tenders as useful in terms of improving their com- petitiveness. Th e greatest number agreed with the contention that without sup- port through tenders they would not have been able to implement investments in an economical manner. Th e fi nancing from tender funds of investments already decided upon earlier was typically more prevalent than the initiation of new in- vestments in response to tender opportunities. Th e assessment of company man- agers was that investments realized through tender funding enhanced their com- pany’s competitiveness, although they did not see tenders contribute to increasing the number of employees. (See Table 14.)
Approximately half the companies not taking part in tenders gave their reasons for non-participation. Th e primary reason for not participating in tenders (48%) was that they had no need for additional funding. Some 22% of companies did not have enough information about the tender conditions, 35% regarded the process as too complicated, and 25% did not satisfy the tender conditions.
Despite the fact that companies have sensed a small improvement in the tender- ing system in the last fi ve years, complete satisfaction is still lacking. Company
managers agreed only moderately that the tendering system focuses on the right areas and groups of companies, at the same time still sensing problems with the transparency of the system. (See Table 15.)
Table 12
Frequency of participation in tenders
Number of tenders
Tenders 0 1 2 3 4 5 6 or
more New Széchenyi Plan (n=84) 47.6% 22.6% 9.5% 8.3% 4.8% 3.6% 0.0%
New Hungary Rural Develop-
ment Programme (n=78) 61.5% 20.5% 9.0% 5.1% 2.6% 0.0% 1.3%
Support provided from EU funds through individual government decisions (n=62)
88.7% 6.5% 3.2% 0.0% 1.6% 0.0% 0.0%
Other tenders co-fi nanced
by EU (n=70) 75.7% 10.0% 7.1% 4.3% 0.0% 1.4% 1.4%
Other foreign-fi nanced ten-
ders (n=57) 94.7% 1.8% 1.8% 0.0% 0.0% 1.8% 0.0%
Support programmes fi nanced purely from domestic sources (ministries, local govern- ments, foundations) (n=65)
72.3% 15.4% 4.6% 3.1% 1.5% 1.5% 1.5%
All tenders (n=199) 65.8% 9.5% 8.0% 3.5% 3.0% 4.0% 6.0%
Table 13
Tenders seen as most important in terms of competitiveness (opinions of majority domestic-owned SMEs)
No. %
New Széchenyi Plan 24 38.10%
New Hungary Rural Development Programme 15 23.80%
Support programmes fi nanced purely from domestic
sources (ministries, local governments, foundations) 13 20.60%
Other tenders co-fi nanced by EU 9 14.30%
Support provided from EU funds through individual
government decisions 2 3.20%
Other foreign-fi nanced tenders 0 0.00%
Total 63 100.00%
Impact of tenders on operation of companies
Mean No. Standard
deviation Tenders created a signifi cant source of fi nancing
for investments already decided upon earlier. 3.57 76 1.389 Tender opportunities motivated our company to
carry out new investments, which we would not have otherwise initiated due to a lack of capital.
3.54 76 1.418
Developments and investments realized through tender funding enhanced our com- pany’s competitiveness.
3.65 78 1.375
Developments and investments implemented through tenders could not have been carried out in an economical manner without the support thus obtained.
3.78 76 1.282
Th e number of employees has increased signifi - cantly in the wake of investments realized with the help of tenders.
2.75 77 1.339
On a 5-grade Likert scale – 1: do not agree at all, 5: agree entirely
Table 15
Assessment of tendering system
Mean No. Standard
deviation Th e tendering system is transparent and pub-
lic, and the results in keeping with evaluation criteria.
2.92 115 1.125
Th e transparency of the tendering system has
much improved in the last fi ve years. 3.12 116 1.12 Th e tendering system focuses on the right areas
and groups of companies. 3.09 114 1.052
Th e goals of the tendering system and its power to boost the economy have much improved in the last fi ve years.
3.20 115 1.053
Our company can gain access to tender fund- ing more easily than our most important competitors.
2.18 119 2.049
On a 5-grade Likert scale – 1: do not agree at all, 5: agree entirely
SUMMARY
During our research we have gained a relatively positive picture of the fi nancing situation of enterprises. At the same time, we must be aware that start-ups, young enterprises and micro-enterprises, which struggle the most with fi nancing wor- ries, were not represented in the analysed database.
Overall borrowing activity remains below the European Union average, but not due to diffi culties in taking out loans. Th e majority of enterprises have had no problem borrowing, although they have sensed deteriorating opportunities to ac- cess credit compared to the period before the crisis. It has proven harder to access long-term credit than loans of less than a year’s maturity – or enterprises have experienced less favourable tendencies in this regard.
Th e most common goal of borrowing was to purchase machinery, equipment and vehicles. Even among companies which typically borrow frequently, the settle- ment of debts was not a characteristic borrowing goal, although the picture is clouded by the fact that for these enterprises one of the most important fi nancial goals has been to preserve liquidity, while their profi tability does not reach the industry average.
In keeping with earlier results, the general level of satisfaction with banks is still favourable, as also apparent in the fact that most companies do not intend to change their bank.
Our investigation corroborated the results of earlier research showing that higher profi tability went hand in hand with a higher ratio of owner’s equity. Our research results suggest that a high ratio of owner’s equity in a fi nancing structure does not conceal diffi culties with borrowing, but rather the availability of other fi nancing options for enterprises that fi nance themselves primarily from their own resourc- es, so that they are not obliged to borrow.
Our presumption is that a lack of credit or external funding was not a primary obstacle to growth among the examined companies in 2013.
Of the surveyed domestic-owned SMEs, 65% did not take part in any tenders at all between 2009 and 2013. Th e greatest number participated in tenders within the framework of the New Széchenyi Plan, and these tenders were regarded as the most important in terms of improving competitiveness. Some 54% of respond- ent companies were successful in all their tenders, while the proportion of those whose tender participation was always unsuccessful was less than 10%. In around half of all tenders, companies sought help from a collaborating partner in writ- ing applications. Although companies have sensed a small improvement in the tendering system in the last fi ve years, general satisfaction is still lacking, with problems experienced primarily with regard to the transparency of tenders.
Chikán – Czakó – Wimmer (2014): Struggling through rugged terrain. Flash report on the re- sults of the 2013 questionnaire-based survey. http://unipub.lib.uni-corvinus.hu/1528/1/BCE%20 VKK%20GYORSJELENTES%202014_2.pdf
Gál, V. (2013): Distinctive features of the capital structure of Hungarian small and medium-sized enterprises. Dissertation. http://www.gtk.ke.hu/fi les/tiny_mce/File/doktori/disszertacio_gal_
veronika.pdf
Ganczer, T. (2010): Characteristics of the SME sector and its fi nancing options under the economic crisis, compared with the expansion seen at the turn of the millennium. Budapest Business School thesis. http://elib.kkf.hu/edip/D_15039.pdf
Némethné, G. A. – Sinkovics, A. (2007): An empirical study of the funding and capital structure of non-fi nancial enterprises operating in Hungary, 1995–2003. Közgazdasági Szemle, April, 2007 pp. 350–375. http://epa.oszk.hu/00000/00017/00136/pdf/5nemethne-gal-sinkovics.pdf
Monitoring Report (2009): Development strategy of small and medium-sized enterprises, 2007–
2013. Annual interim monitoring report 2009.
Sinkovics, A. (2003): Changes in the capital structure of enterprises in Hungary, 1995–2002.