The original published PDF available in this website:
1
https://onlinelibrary.wiley.com/doi/abs/10.1111/jbi.13485 2
Journal of Biogeography (2019) 46: 304-315.
3
4
Predicting beta diversity of terrestrial and aquatic beetles using ecogeographical 5
variables: insights from the replacement and richness difference components 6
7
Jani Heino1*, Janne Alahuhta2, Simone Fattorini3 & Dénes Schmera4,5 8
1 Finnish Environment Institute, Biodiversity Centre. P.O. Box 413, FI‒90014 Oulu, Finland.
9
2 Geography Research Unit, University of Oulu. P.O. Box 3000, FI‒90014 Oulu, Finland.
10
3Department of Life, Health & Environmental Sciences, University of L'Aquila, Via Vetoio, 11
Coppito, 67100 L'Aquila, Italy 12
4MTA Centre for Ecological Research, Balaton Limnological Institute, Klebelsberg K. u. 3, 13
H-8237 Tihany, Hungary 14
5MTA Centre for Ecological Research, GINOP Sustainable Ecosystem Group, Klebelsberg K.
15
u. 3, H-8237 Tihany, Hungary 16
17
*Correspondence: jani.heino@environment.fi 18
19
BIOSKETCH 20
The authors are interested in all aspects of biodiversity, ranging from spatial patterns in 21
species distributions through different facets of biodiversity to their conservation 22
implications.
23
ACKNOWLEDGEMENTS 24
We dedicate this paper to all people who have contributed to the faunistics of beetles in 25
Northern Europe. We would like to express our gratitude to three anonymous referees for 26
their comments on a previous version of this paper. This research was supported by the 27
OTKA K128496 and GINOP 2.3.3-15-2016-00019 grants.
28
29
ORCID 30
Jani Heino: orcid.org/0000-0003-1235-6613 31
Janne Alahuhta: orcid.org/0000-0001-55149361 32
Simone Fattorini: orcid.org/0000-0002-4517-2135 33
Dénes Schmera: orcid.org/0000-0003-1248-8413 34
Abstract
35
Aim: We examined the responses of the beta diversity of aquatic and terrestrial beetles to 36
ecogeographical variables, including climate, land cover and land use, across Northern 37
Europe.
38
Location: Northern Europe (Denmark, Sweden, Norway and Finland).
39
Methods: Information on the occurrence of ground beetles and diving beetles across 40
Northern European biogeographic provinces was collated from literature sources. Beta 41
diversity was examined using Jaccard dissimilarity coefficient as well as its replacement and 42
richness difference components. Each of the three dissimilarity matrices (responses) was 43
modelled using various ecogeographical variables (predictors) by generalized dissimilarity 44
modelling (GDM).
45
Results: The magnitude of total beta diversity was relatively similar between ground beetles 46
and diving beetles, but the richness difference component contributed more than the 47
replacement component to total beta diversity in ground beetles, whereas the opposite was 48
true for diving beetles. The predictor variables most influential in GDM in accounting for 49
spatial variation in beta diversity varied between the two beetle groups as well as between the 50
replacement and richness difference components. In general, the richness difference 51
component of ground beetles responded strongly to latitude and associated climatic variables, 52
whereas the replacement component of diving beetles varied strongly along the same 53
geographical gradient.
54
Main conclusions: Our findings suggest that the study of the determinants of biodiversity 55
patterns benefits from the partitioning of beta diversity into different components and from 56
comparing terrestrial and aquatic groups. For example, our findings suggest that the strong 57
predicting and mitigating the effect of ongoing global change on the composition of regional 59
biotas.
60
61
KEYWORDS 62
biodiversity, climate, generalized dissimilarity modelling, land cover, land use, mean annual 63
temperature.
64
1 ǀ INTRODUCTION 65
66
Owing to the fact that ongoing global change is threatening the diversity of populations, 67
species and assemblages (Sala et al., 2000; Heino et al., 2009), understanding the factors 68
underlying spatial variation of biodiversity remains at the heart of biogeography, ecology and 69
conservation biology. However, different components of biodiversity may respond differently 70
to global change and natural environmental variation (Socolar et al., 2016). Species diversity 71
can be decomposed into alpha, beta and gamma components (Whittaker, 1960), all of which 72
may respond to various historical, environmental and geographical factors (Mittelbach, 73
2012). While most previous studies focused on patterns in alpha or gamma diversity 74
(Hillebrand, 2004; Field et al., 2009), beta diversity has received considerable renewed 75
interest in recent years (Tuomisto, 2010; Anderson et al., 2011).
76
Beta diversity can be defined as the variation in assemblage composition among 77
sampling units or the extent of change in assemblage composition along gradients (Legendre 78
et al., 2005; Tuomisto et al., 2006), and it can further include different components (e.g.
79
replacement and richness difference components; Podani & Schmera, 2011). Species 80
replacement is related to factors affecting changes in species identities between sites, whereas 81
richness difference informes about factors determining differences in the number of species 82
(Legendre, 2014). However, given the paucity of empirical studies using this approach 83
(Baiser et al., 2012; Tonial et al., 2012; Vad et al., 2017), it is difficult to (i) make 84
conclusions about the relative importance of these components, and (ii) if these components 85
respond differently to environmental and geographical gradients. An alternative approach 86
would be to decompose total beta diversity into turnover and nestedness components 87
(Baselga, 2010), but we opted to focus on the replacement and richness difference 88
components (Podani & Schmera, 2011) because we were interested in any variation related to 89
richness differences between sites instead of nestedness-related patterns (Carvalho et al.
90
2012; Legendre, 2014).
91
Although beta diversity is gaining increasing, comparative studies on beta diversity 92
patterns between biological assemblages inhabiting contrasting environments are mostly 93
lacking (but see Fattorini, 2010; Heino & Alahuhta, 2015). For example, terrestrial 94
assemblages are typically driven by climate-related variables (e.g., Hortal et al., 2011), 95
whereas local habitat conditions, such as water quality, often structure variation in aquatic 96
assemblages even at broad spatial scales (e.g., Alahuhta, 2015). One possible explanation 97
may be that not only the terrestrial ecosystems are directly influenced by climate (i.e. air 98
temperature), whereas actual water temperature is naturally more important than air 99
temperature to aquatic organisms (e.g. water may buffer extreme changes in air 100
temperatures), but also the role of water is fundamentally different for aquatic species 101
distributions (e.g., Heino, 2011). For instance, terrestrial assemblages are mainly affected by 102
the accessibility of water in the ground for primary producers, drinking water for animals and 103
different moisture conditions for different animal species (e.g., Begon et al., 2006), whereas 104
the survival of aquatic species depends more on the quality and movement of water in 105
freshwater environments (Wetzel, 2001; Allan & Castillo, 2007). Because the underlying 106
structuring factors for terrestrial versus aquatic assemblages do not necessarily co-vary 107
geographically, aquatic organisms can be used to disentangle and contrast some of the 108
mechanisms believed to underlie the most pervasive diversity patterns in the world (Brown, 109
2014).
110
Beetles are a hyperdiverse group of insects, with different families inhabiting 111
terrestrial, semi-aquatic and aquatic environments (Thomas, 2008). A highly diverse 112
terrestrial family of beetles, ground beetles (Coleoptera: Carabidae), has been studied from 113
ecological, evolutionary and biogeographical perspectives for a long time (Lindroth, 1985;
114
Lövei & Sunderland, 1996; Dajoz, 2002; Kotze et al., 2011). Previous studies have found 115
clear geographical patterns in their regional diversity and assemblage composition, which 116
have been associated with concurrently varying climate conditions (Heino & Alahuhta, 117
2015). In particular, temperature and humidity are two important environmental factors 118
influencing the behaviour and ecology of ground beetles (e.g., Rainio & Niemelä, 2003), for 119
which reason these insects are regarded as a model group for research on the effects of 120
climate change (e.g., Müller-Kroehling, 2014). For example, temperature may influence their 121
flight, speed of digestion, larval survival and life-history phenology (Thiele, 1977;
122
Butterfield, 1996; Lövei and Sunderland, 1996), whereas humidity may be important in 123
regulating behavioural patterns and habitat affinity (e.g., Kagawa & Maeto, 2009). However, 124
landscape features and more localised environmental variations also affect the distributions of 125
ground beetles (Thiele, 1977; Lindroth, 1985; Lövei & Sunderland, 1996). Ground beetle 126
assemblages are strongly influenced by habitat structure, especially as reflected by vegetation 127
(Brose 2003; Koivula et al., 1999; Taboada et al. 2008; Koivula, 2011). Thus, ground beetle 128
assemblages host species characteristic of particular habitats, reflect variation in structural 129
features (e.g. soil characteristics), and may be particularly sensitive to anthropogenic 130
alterations (Rainio & Niemelä, 2003; Koivula, 2011). For these reasons, ground beetle 131
distributional patterns can be strongly influenced by land use (Eyre et al., 2003; Eyre & Luff, 132
2004; Kotze et al., 2011). Thus, it is important to examine the influence of land cover on 133
ground beetle assemblages in a broad-scale biogeographical context (Heino & Alahuhta, 134
2015). A highly diverse aquatic family of beetles, diving beetles (Coleoptera: Dytiscidae), has 135
also been the focus of numerous ecological and biogeographical studies. Some studies, 136
addressed to associate their distributions and diversity to local environmental variables 137
(Nilsson, Elmberg and Sjöberg, 1994; Nilsson & Söderberg, 1996), have emphasised that 138
diving beetle assemblages are mostly driven by vegetation characteristics, invertebrate prey 139
abundance, fish predation and geographical location of water bodies. On the other hand, 140
studies at broad scales have suggested that assemblage composition of diving beetles is 141
mostly driven by climatic variables, with additional influences by landscape features (Heino 142
& Alahuhta, 2015). However, no previous study has aimed to find out if and how geography, 143
climate, land cover and anthropogenic land use variables affect the replacement and richness 144
difference components of beta diversity in these two major beetle groups inhabiting different 145
environments.
146
Here, we focused on the beta diversity of ground beetles and diving beetles through 147
examining the responses of total beta diversity and its replacement and richness difference 148
components to climate, land cover and geographical gradients across Northern Europe. Our 149
previous study found that both ground beetle and diving beetle assemblages were mostly 150
driven by mean annual temperature and, secondarily, by various other climatic and land cover 151
variables (Heino & Alahuhta, 2015). However, it is still not clear whether this assemblage 152
differentiation across Northern Europe is manifested by species replacement, richness 153
difference or both, and whether the identified ecogeographical drivers have similar effects on 154
these beta diversity components. In our previous study, we used constrained ordination and 155
constrained clustering methods, and did not examine the drivers of replacement and richness 156
difference components. In the present study, we expected that (i) the replacement component 157
would be driven by land cover and land use variables (because species composition typically 158
shows turnover along long environmental gradients; e.g., Gaston & Blackburn, 2000; Qian &
159
Ricklefs, 2012; König et al., 2017) and (ii) the richness difference component would be 160
driven by geographical and climatic variables (because history and climate shape variation in 161
species richness at large scales; e.g., Hillebrand, 2004; Field et al., 2009). In the final stage, 162
we mapped the observed responses of beta diversity and its components to show their broad- 163
scale latitudinal and longitudinal patterns in Northern Europe. Our findings should contribute 164
to discussion of the ongoing global change effects on insect biodiversity in high-latitude 165
areas.
166
167
2 ǀ METHODS 168
169
2.1 ǀ Study area 170
171
We analysed beetle distribution and environmental data derived from the 101 biogeographic 172
provinces belonging to Denmark, Sweden, Norway and Finland (Väisänen et al., 1992;
173
Väisänen & Heliövaara, 1994). Prior to the analyses, we merged various small coastal 174
provinces in Norway to provide a better and more accurate representation of species ranges 175
(Heino & Alahuhta, 2015; Heino et al., 2015). After these modifications, the number of 176
provinces remaining in the analyses was 79. Each province has typical characteristics of 177
climate and land cover, and “biogeographic province” is thus a relatively homogeneous study 178
unit. We used the 79 provinces as sampling units (i.e. grain size), and all the species found in 179
a biogeographic province were pooled to represent a single assemblage.
180
181
2.2 ǀ Species data 182
183
We analysed the same literature data as in Heino and Alahuhta (2015) for two adephagan 184
beetle groups: ground beetles (Carabidae; Lindroth, 1985; 1986) and diving beetles 185
(Dytiscidae; Nilsson & Holmen, 1995). Ground beetles are mainly terrestrial insects, which 186
are predatory, omnivorous, granivorous or herbivorous species as adults and mostly predatory 187
as larvae (Lindroth, 1985; Lövei & Sunderland, 1996; Dajoz, 2002). Diving beetles dwell in 188
fresh waters and sometimes in brackish waters, and they are mostly predatory as larvae and 189
predators or scavengers as adults (Nilsson & Holmen, 1995). These two beetle groups are 190
relatively species rich in Northern Europe. However, Carabidae comprised more species 191
(total number of species = 388; mean number of species per province = 159, sd = 56.9) than 192
Dytiscidae (total number of species = 155; mean = 78.9, sd = 19.3; paired t-test; p < 0.001) 193
based on the literature data (Lindroth, 1985, 1986; Nilsson & Holmen, 1995). Although these 194
biological data are already rather old, they represent good information about species 195
distributions across Northern Europe and can be easily associated with predictor variable data 196
derived for a period between 1960s and 1990s. Although additional beetle distributional data 197
may be available in more recent faunistic publications, we opted to not use them because our 198
predictor variable are older in comparison to these recent assessments. The presence-absence 199
data we used are based on various faunistic and ecological surveys across Northern Europe 200
and comprise the work of a large number of scientists and amateur entomologists. For this 201
reason, the sampling effort might be different among the provinces to an unknown extent, and 202
this variation cannot be accounted for in the present analyses. However, the very long time of 203
sampling effort, the multitude of people that collected data, the variety of used techniques and 204
sampled habitats, and the relatively small number of species occurring in the study area, 205
suggest that faunal inventories were comprehensive by the dates the books were published.
206
207
2.3 ǀ Predictor variables 208
209
Among the multiple correlated climatic variables available in WorldClim (Hijmans et al., 210
2005), we selected those that are presumably the most important for insect distributions.
211
These climate variables were: average annual temperature (°C), maximum temperature of the 212
warmest month (°C), minimum temperature of the coldest month (°C), precipitation of the 213
wettest month (mm) and precipitation of the driest month (mm). The climate variables were 214
averaged values for the period 1960-1990 for each biogeographical province and were 215
derived from WorldClim with 0.93 km × 0.93 km resolution (Hijmans et al., 2005). Because 216
most of the aforementioned climate variables were strongly intercorrelated (r ≥ 0.80), we 217
used only average annual temperature and precipitation of the wettest month in the statistical 218
analyses. These two are also conceptually the most important climatic variables affecting 219
biodiversity at high latitudes. Land cover and land use variables were percentages of fresh 220
water, forests, open areas, wetlands, agricultural areas and urban areas. These variables were 221
obtained from European CORINE 2006 with 100m resolution. For the suitability of 222
CORINE-based land use and land cover variables in these types of studies in northern 223
Europe, see Heino & Alahuhta (2015). Although the land cover data is from the mid-2000s, 224
most drastic changes in the land cover happened in Northern Europe between 1950 and 1980, 225
when the current road and peatland drainage networks were established and a large 226
proportion of people moved from the countryside to urban environments (Seppälä, 2005).
227
Development of agriculture changed landscapes already thousands of years ago in Southern 228
Fennoscandia (Eriksson et al., 2002), after which changes in the quantity of agricultural land 229
has been considerably modest. Finally, average elevation and elevation range within the 230
province were also considered as land cover variables, as these variables are related to the 231
environmental variation along elevation gradients. Elevation variables were obtained from 232
3D Digital Elevation Model over Europe with 25m resolution. Because these two variables 233
were strongly correlated (r = 0.95), only average elevation was used in the statistical analysis.
234
235
2.4. ǀ Statistical methods 236
237
We first calculated beta diversity components for each beetle group based on Jaccard 238
dissimilarity coefficient. We thus followed the approach devised by Podani & Schmera 239
(2011) and Carvalho et al. (2012). In this scheme, total beta diversity is decomposed into 240
replacement and richness difference components: Btotal = Brepl + Brich. Btotal reflects 241
both species replacement and loss-gain; Brepl refers to replacement of species identities 242
alone, and Brich relates to species loss-gain or richness differences alone. A recent review 243
found this decomposition a suitable approach for addressing complex issues in beta diversity 244
(Legendre, 2014). We thus produced dissimilarity matrices based on each of the three 245
components for each beetle group using the ‘beta’ function in the R package BAT (Cardoso et 246
al., 2015).
247
Second, we modelled variation in biological dissimilarities using Generalized 248
Dissimilarity Modelling (GDM: Ferrier et al., 2007). GDM is a technique for modelling 249
spatial variation in assemblage composition between pairs of geographical locations, and it 250
can be based on any dissimilarity matrix as response. These were, in our case, pairwise 251
Btotal, Brepl and Brich dissimilarity matrices for each beetle group. GDM is based on matrix 252
regression, and it can accommodate nonlinearities typical in ecogeographical datasets. These 253
nonlinearities occur for two reasons: (i) the curvilinear response between increasing 254
ecological distance and observed compositional dissimilarity, and (ii) the variation in the rate 255
of compositional dissimilarity at different position along ecogeographical gradients (Ferrier et 256
al., 2007). It is thus a highly useful technique for large-scale assessments of assemblage 257
composition. In consistency with other generalized linear models, the GDM model is 258
specified based on two functions: (i) a link function (in our case, 1-exp[y]) defining the 259
relationship between the response (i.e. compositional dissimilarity between sites) and the 260
linear predictor (i.e. inter-site distances based on any ecogeographical variable, including 261
geographical distance between sites), and (ii) a variance function defining how the variance 262
of the response depends on the predicted mean (Ferrier et al., 2007). We ran the GDM 263
models, plotted the I-splines (which are monotone cubic spline functions) for each predictor 264
variable (and geographical distance) and assessed the impacts of the predictor variables 265
(which are estimated as the variance explained by the predictor when all the others are kept 266
constant) on the response dissimilarities using the functions ‘gdm’ and ‘gdm.varImp’
267
available in the R package gdm (Manion et al., 2017). Prior to running GDMs, we checked 268
for multicollinearity among the predictor variables. The highest correlation was between 269
agriculture and mean annual temperature (Pearson r = 0.80), but the other correlations were 270
lower (r < 0.70 or r > - 0.70). Hence, we did not remove any of the predictor variables shown 271
in the final models. Also, GDM is known to be robust to multicollinearity among predictor 272
variables (e.g., Glassman et al., 2018). We did not standardize the predictor variables in our 273
focal analyses, as a number of authors have followed a similar approach (e.g., Fitzpatrick et 274
al., 2013), and because this facilitates understanding variation in beta diversity along actual 275
environmental gradients. However, we also ran the analyses using standardized predictor 276
variables (mean = 0, SD = 1), but the main inferences did not change (i.e. the same predictor 277
variables were the most important irrespective of whether or not we standardized the 278
variables, and the explained deviance did not differ too much between the two approaches).
279
For all above analyses, we assessed the uncertainty in the fitted I-splines by plotting I-splines 280
with error bands using a bootstrapping approach (Shyrock et al., 2015). We used 100 281
iterations in bootstrapping, and 70% of the sites were retained from the full site-pair table 282
when subsampling the data.
283
Third, we produced RGB colour maps using province scores from three non-metric 284
multidimensional (NMDS) axes simultaneously. NMDS is considered as a highly robust 285
unconstrained ordination method that can be utilised in ecology and biogeography (Minchin, 286
1987). For our present purpose, we ran 20 3-dimensional NMDS solutions based on random 287
starts, and selected for mapping the solution of three NMDS axes with the lowest stress 288
value. These NMDS axes were calculated separately based on total beta diversity, 289
replacement and richness difference dissimilarity matrices for each beetle group using the 290
function ‘metaMDS’ with the R package vegan (Oksanen et al., 2017). The stress values were 291
acceptable and ranged from 0.016 to 0.199, with the exception of the replacement 292
component-related ordination of ground beetles for which the stress value was 0.242. The 293
colour mapping routines were conducted using the functions ‘recluster.col’ and 294
‘recluster.plot.sites.col’ from the R package recluster (Dapporto et al., 2015) and the results 295
were plotted on the maps of the study area.
296
Finally, we used GDM to examine latitudinal and longitudinal patterns in total beta 297
diversity and its components across the study area. We thus ran GDM to regress each 298
dissimilarity matrix, Btotal, Brepl and Brich, with both latitudinal distance and longitudinal 299
distance. We again used bootstrapping as above to assess the uncertainty in the resulting I- 300
splines.
301
302
3 ǀ RESULTS 303
304
Regarding the decomposition of total beta diversity into replacement and richness difference 305
components, there were no clear differences between ground beetles and diving beetles (Fig.
306
1). Total beta diversity hardly differed between the beetle groups, with average values being 307
very similar (ground beetles: 0.52; diving beetles: 0.49). However, while the richness 308
difference component was slightly more important than the replacement component for 309
ground beetles (average replacement = 0.23, average richness difference = 0.29), the opposite 310
was true for diving beetles (average replacement = 0.28, average richness difference = 0.21).
311
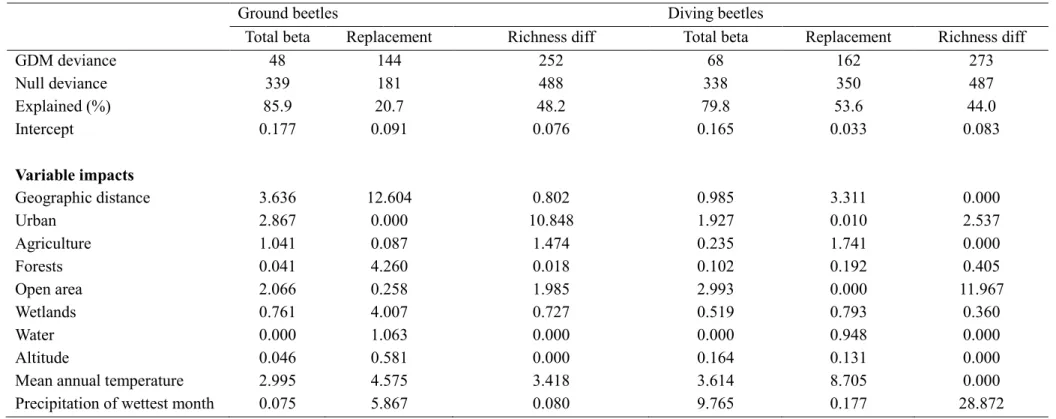
There were some differences in the explained deviance between the beetle groups and 312
the components of beta diversity when using the selected 10 predictor variables (Table 1).
313
Total beta diversity of ground beetles was slightly better explained than that of diving beetles, 314
but the opposite was true for the replacement component. The richness difference component 315
of ground beetles was slightly better explained than that of diving beetles.
316
The total beta diversity of ground beetles was best explained by geographical 317
distance, followed by mean annual temperature, urban land use and open areas (Table 1). Of 318
these variables, geographical distance and mean annual temperature had almost linear 319
relationships with beta diversity variation, urban areas first had an increasing relationship and 320
then reached a plateau, and open areas had a slightly curvilinear increasing relationship 321
(Supporting Information, Fig. S1). Other variables had only weak or no relationships with 322
total beta diversity of ground beetles. The replacement component of ground beetles was 323
most strongly impacted by geographic distance, followed by precipitation, mean annual 324
temperature, forest cover and wetland cover (Fig. S2). Of these, geographic distance showed 325
a relationship that first increased rapidly after which the pattern levelled off. Mean annual 326
temperature had a closely similar relationship to that of geographic distance, and the other 327
important variables had slightly curvilinear increasing impacts on the replacement 328
component. The richness differences component of ground beetles was most clearly related to 329
urban land use and mean annual temperature, of which the former had a very steep increasing 330
effect that decreased with higher urban land uses (Fig. S3). Mean annual temperature had 331
The total beta diversity of diving beetles was mostly impacted by precipitation, 333
followed by mean annual temperature and open areas (Table 1). These variables showed 334
slightly curvilinear, almost sigmoidal and almost linear relationships, respectively, with total 335
beta diversity (Fig. S4). The replacement component of diving beetles was mostly related to 336
mean annual temperature and geographic distance, which had almost linear relationships with 337
this component (Fig. S5). Finally, the richness difference component was mostly driven by 338
precipitation, followed by open areas and urban land use. These variables showed slightly 339
curvilinear relationships with richness difference (Fig. S6).
340
The NMDS-based maps of total beta diversity and its replacement and richness 341
difference components showed some differences (Fig. 2). While total beta diversity varied 342
quite similarly along latitudinal and longitudinal gradients across Northern Europe, the 343
replacement and richness difference components showed some striking differences between 344
the two beetle groups. The replacement component of ground beetles and diving beetles 345
showed clear differences between Denmark and southern Sweden, whereas the richness 346
difference component showed different patterns for ground beetles and diving beetles. As a 347
result, ground beetles showed a latitudinal gradient in richness difference, whereas a 348
longitudinal gradient was more pronounced in the case of diving beetles across the provinces 349
based on visual inspections.
350
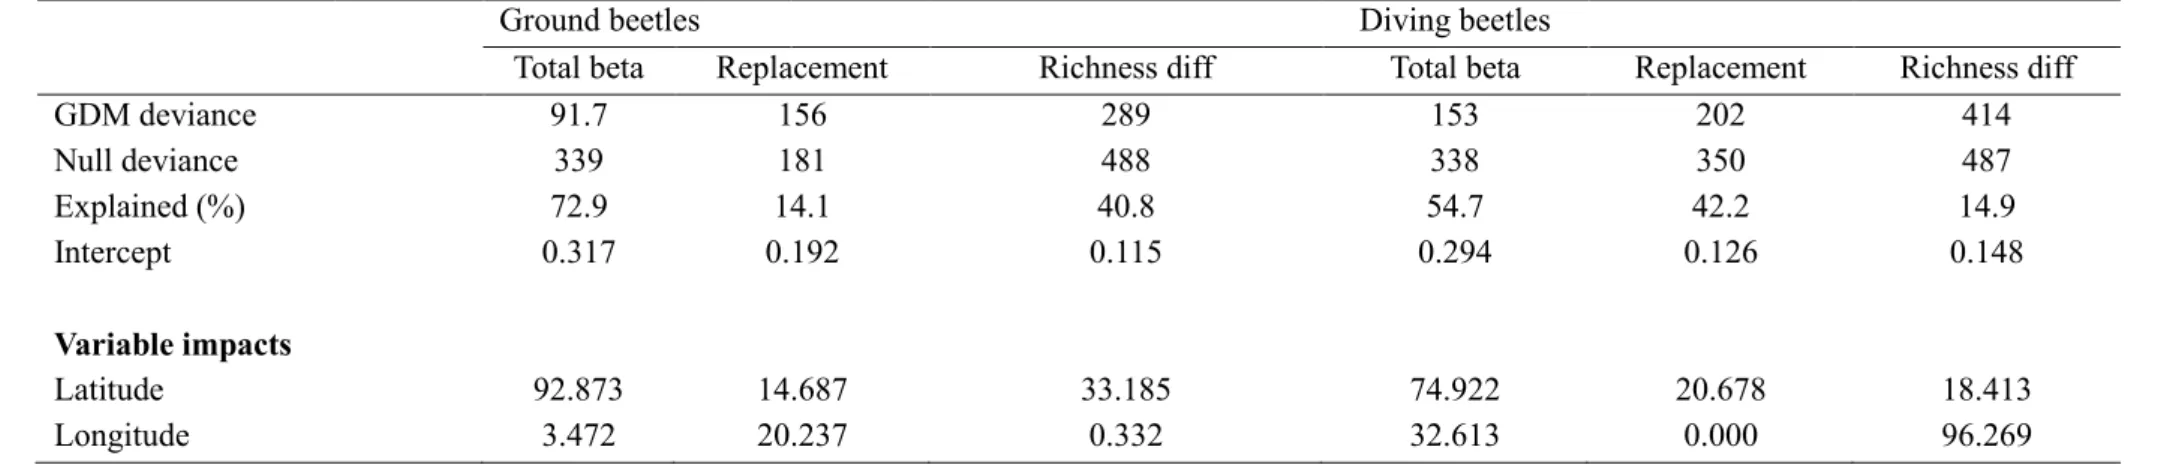
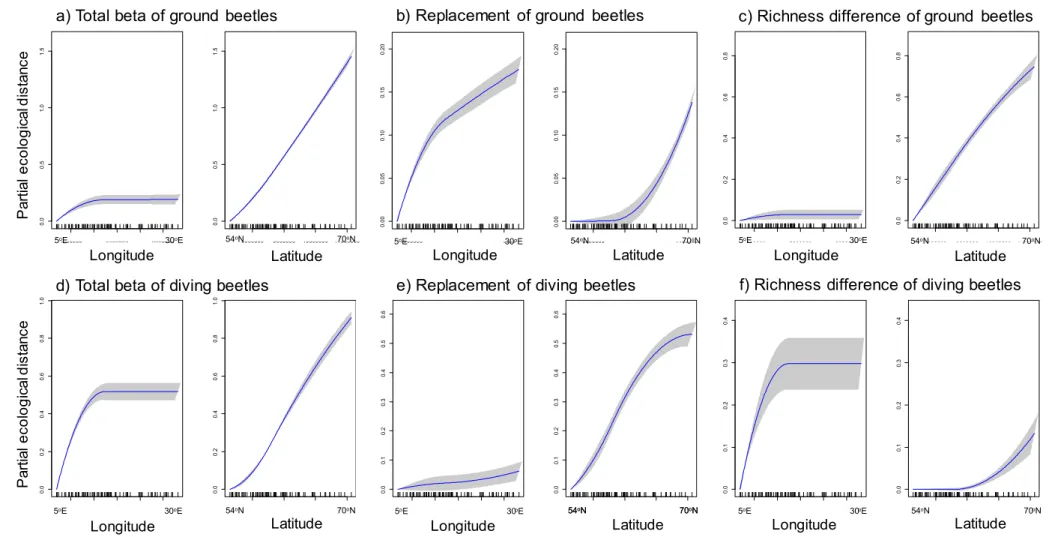
The visual inspections were also largely corroborated by the results of additional 351
GDMs, with total beta diversity being strongly related to latitude in both beetle groups, 352
whereas the replacement and richness difference components showed differences between the 353
beetle groups (Fig. 3). For ground beetles, the richness difference component was strongly 354
correlated to latitude, whereas the replacement component of diving beetles showed a strong 355
relationship with latitude. These relationships were almost linear. There was also a major 356
geographical break in the replacement component of ground beetles at latitude of 62oN to 357
63oN, after which the species compositional variation increased rapidly (Fig. 3b). Similarly, 358
there was a clear break, followed by a plateau, in the richness difference component of diving 359
beetles at a longitude of 10oE to 11oE (Fig. 3f). These visual inspections were corroborated by 360
the numerical results of the GDM analysis (Table 2).
361
362
4 ǀ DISCUSSION 363
364
There is a substantial lack of studies that have compared the beta diversity patterns of 365
multiple insect groups based on the same study units and identical statistical methods 366
(Fattorini, 2010; Heino & Alahuhta, 2015). Here, we contrasted biogeographical patterns in 367
the total beta diversity and its replacement and richness difference components for terrestrial 368
(ground beetles) and aquatic (diving beetles) insects.
369
We found that different factors drove the most variation in the assemblages of ground 370
beetles and diving beetles, and these differences were also contingent on the beta diversity 371
measure in question. Total beta diversity of ground beetles responded most strongly to (i) 372
geographic distance between provinces, which expresses the importance biogeographical and 373
historical factors (such as the presence of geographical barriers, the distribution of suitable 374
habitats, and the effects of glaciations); (ii) mean annual temperature, indicating the role of 375
current climatic forcing; and (iii) urban land use, suggesting that provinces with varying 376
degrees of urbanization harbour different ground beetle assemblages. For diving beetles, total 377
beta diversity was mostly related to (i) precipitation of the wettest month, describing a 378
gradient from the Atlantic coast of Norway in the west to continental areas in Eastern Finland 379
in the east; (ii) mean annual temperature, which varies markedly from south to north across 380
the study area (Heino et al., 2015); and (iii) open areas, implying that the provinces having 381
open areas versus forested areas harbour different diving beetle assemblages. The weak 382
impact of geographical distance in diving beetles may be due to their dispersal capabilities.
383
Diving beetles live in spatially discrete and sometimes ephemeral habitat patches, and many 384
species are therefore assumed to be very active dispersers, able to move between suitable 385
localities sometimes even on multiple occasions within an individual’s lifetime (Bilton, 386
2014). Although large-sized ground beetles move relatively speedily on the ground, being 387
able to disperse over distances in the order of kilometres, and many species are able to fly, 388
high habitat fragmentation and geographical barriers are known to prevent many species from 389
colonizing most patches (Kotzke et al., 2011; Elek et al., 2014). This can be especially true 390
for flightless ground beetle species, which are constrained by habitat fragmentation at larger 391
spatial scales. For these cases, geographical distance is likely to exert increased importance in 392
comparison to diving beetles that are better dispersers, as observed in our study.
393
The few previous studies that have decomposed total beta diversity into the 394
replacement and richness difference components have found that their relative importance 395
varies among study systems and organisms (Baiser et al., 2012; Tonial et al., 2012; Victorero 396
et al., 2018). Using an alternative approach to partition beta diversity into the turnover and 397
nestedness components (Baselga, 2010), Soininen et al. (2018) observed that the turnover 398
component was clearly more important that the nestedness component in a meta-analysis of 399
269 data points. This finding is similar to that of a global comparative study of lake 400
macrophytes that showed the preponderance of the turnover component over the nestedness 401
component (Alahuhta et al., 2017). In our study, the predictors of the replacement component 402
varied somewhat between the two beetle groups. For ground beetles, geographic distance was 403
by far the most important variable affecting differences in species composition between 404
provinces. This effect is plausible given the rather large geographical area and the legacy of 405
historical influences in the study region (e.g. post-Ice Age colonization may still be ongoing;
406
Hortal et al., 2011). Geographical distance was followed by precipitation, mean annual 407
temperature, forest cover and wetland cover. These variables were likely to be related to 408
effects of climate and habitat differences on species composition, as already observed in 409
previous accounts on ground beetle distributions in the study area (Lindroth 1985, 1986). For 410
diving beetles, the replacement component was mostly driven by mean annual temperature 411
and geographic distance, suggesting strong south-north changes in species identities along a 412
temperature gradient. These findings are in accordance with previous accounts of species 413
distributions, emphasising that diving beetles are sensitive to temperature that may strongly 414
contribute to their distributions at both local and regional scales (Nilsson & Holmen, 1995;
415
Heino & Alahuhta, 2015).
416
The variables best explaining the richness difference components of ground beetles 417
and diving beetles were strikingly different. While the richness difference component of 418
ground beetles was mostly related to urban land use (impact: 10.8) and mean annual 419
temperature (impact: 3.4), that of diving beetles was mostly impacted by precipitation 420
(impact: 28.8) and cover of open areas (impact: 11.9). These findings suggest that species 421
loss-gain occurs mostly along urbanization and temperature gradients in ground beetles, with 422
more species occurring in southernmost provinces with a higher urban land use cover than in 423
more northerly provinces in the study area. While the positive effect of temperature is 424
consistent with geographical patterns observed in most organisms (Currie et al., 2004;
425
Hawkins et al., 2004; Lomolino et al., 2010), the increase of ground beetle richness with 426
urbanization is counter-intuitive, because urbanization has typically negative effects on insect 427
diversity (McKinney, 2002; Martinson & Raupp, 2013; New, 2015). This unexpected positive 428
association can be explained by assuming that species richness and human settlements both 429
respond positively to energy availability, because the higher the energy, the greater the 430
biomass and the number of individuals to be sustained, which, in turn, allow more species to 431
maintain viable populations within an area (Gaston, 2005; Evans & Gaston, 2005). Thus, it 432
can be hypothesised that early human populations settled in a clumped fashion and grew 433
more readily in the warmer and more productive areas represented by southern provinces, 434
where there is high abundance and diversity of plants and animals that can be used as food or 435
for other purposes, and where climate is milder. This hypothesis is supported by the fact that 436
the richness difference component of ground beetles was also related to mean annual 437
temperature, which increases southwards. As regards the negative effects of urbanization, 438
they can really operate, but their influence may be masked at coarse spatial resolutions as that 439
used in this study, because remnants of suitable biotopes can be found even where human 440
population density is high (Fattorini et al., 2016).
441
We also found that latitude strongly affected the richness difference component of 442
beta diversity in ground beetles, but not so much in diving beetles. The effects of 443
recolonization after the Ice Age are expected to be higher for the richness difference 444
component (see also Hortal et al., 2011), since few species (especially the most tolerant and 445
mobile) were able to recolonize or disperse to areas strongly affected by historical climatic 446
changes, especially those located at high latitudes (Fattorini & Ulrich, 2012a; 2012b). Thus, 447
the influence of latitude on the richness difference component of beta diversity of ground 448
beetles is consistent with the hypothesis that the spatial distribution of dispersal-limited 449
species is still significantly affected by historical processes, as observed for ground beetles 450
(see also Schuldt & Assmann, 2009). By contrast, the possible impact of Ice Age history on 451
the current distribution of diving beetles seems to have been erased by their ability to long 452
dispersal to reach scattered suitable habitat patches. In diving beetles, species loss-gain most 453
likely occurs along a gradient from coastal (higher precipitation) to continental (lower 454
precipitation) provinces. Especially the amount of precipitation may influence habitat 455
availability and habitat types for diving beetles, with temporary ponds and pools, as 456
important habitats for some diving beetle species (Nilsson & Holmen, 1995), being probably 457
uncommon in provinces with continuously high precipitation. In addition, water level 458
fluctuations in permanent lakes and rivers may affect aquatic vegetation, thereby affecting 459
habitat availability for diving beetles. Finally, increased precipitation may result in nutrient 460
leaching to aquatic ecosystems (Soininen et al., 2015), which influences the chemical 461
environment for diving beetles and might therefore affect their geographical distribution.
462
Thus, in addition to historical influences, present-day latitudinal and longitudinal 463
distributions of beetles may also be affected by environmental factors that vary 464
geographically (Heino & Alahuhta, 2015). Disentangling the effects of Ice Age history and 465
contemporary environmental conditions may be especially difficult in a region, such as 466
Northern Europe, where these two sets of factors co-vary strongly geographically.
467
Our findings showed that the magnitudes of beta diversity changes varied depending 468
on the beta component considered and in relation with the main habitat of the study group.
469
These findings suggest that the analysis of the determinants of biodiversity patterns will 470
benefit from the partitioning of beta diversity into different components (Podani & Schmera, 471
2011; Legendre, 2014), as these components are determined by different ecogeographical 472
factors in animals inhabiting contrasting environments. Knowing which ecogeographical 473
factors affect present-day biodiversity patterns is also a prerequisite for predicting alterations 474
in species distributions in the face of global change. For example, the presence of strong 475
climatic gradients in beta diversity have important implications for predicting, adapting and 476
mitigating the effect of ongoing climate change on the composition of biological 477
assemblages: (i) the species composition in areas of cold climates will likely become to 478
resemble that currently present in more southerly regions (Hickling et al., 2006) and (ii) some 479
species with northern distributions may go extinct with climate change (Thomas et al., 2006).
480
However, these two topics deserve further and more direct modelling studies in the context of 481
hyperdiverse insect groups. Although we analysed patterns at the scale of biogeographic 482
provinces, our findings do point out that various factors should be taken into account in the 483
conservation biogeography of highly diverse organism groups in terrestrial and aquatic 484
realms to facilitate understanding nuances in biodiversity patterns.
485
486
REFERENCES 487
488
Alahuhta, J. (2015) Geographic patterns of lake macrophyte communities and species 489
richness at regional scale. Journal of Vegetation Science, 26, 564-575.
490
Alahuhta, J., Kosten, S., Akasaka, M., Auderset, D., Azzella, M., Bolpagni, R., Bove, C.P., 491
Chambers, P.A., Chappuis, E., Ilg, C., Clayton, J., de Winston, M., Ecke, F., Gacia, E., 492
Gecheva, G., Grillas, P., Hauxwell, J., Hellsten, S., Hjort, J., Hoyer, M.V., Kolada, A., 493
Kuoppala, M., Lauridsen, T., Li, E.-H., Lukács, B.A., Mjelde, M., Mikulyuk, A., 494
Mormul, R.P., Nishihiro, J., Oertli, B., Rhazi, L., Rhazi, M., Sass, L., Schranz, C., 495
Søndergaard, M., Yamanouchi, T., Yu, Q., Wang, H., Willby, N., Zhang, X.-K. &
496
Heino, J. (2017) Global variation in the beta diversity of lake macrophytes is driven 497
by environmental heterogeneity rather than latitude. Journal of Biogeography, 44, 498
1758-1769.
499
Allan, J.D. & Castillo, M.M. (2007) Stream Ecology. Structure and Function of Running 500
Waters. Second Edition. Springer, New York.
501
Anderson, M. J., Crist, T. O., Chase, J. M., Vellend, M., Inouye, B. D., Freestone, A. L., 502
Sanders, N. J., Cornell, H. V., Comita, L. S., Davies, K. F., Harrison, S. P., Kraft, N.
503
J., Stegen, J. C. & Swenson, N. G. (2011), Navigating the multiple meanings of β 504
diversity: a roadmap for the practicing ecologist. Ecology Letters, 14, 19-28.
505
Baiser, B., Olden, J.D., Record, S., Lockwood, J.L., & M.L. McKinney (2012) Pattern and 506
process of biotic homogenization in the New Pangaea. Proceedings of the Royal 507
Society B: Biological Sciences, 279, 4772-4777.
508
Baselga, A. (2010) Partitioning the turnover and nestedness components of beta diversity.
509
Global Ecology and Biogeography, 19, 134-143.
510
Begon, M., Townsend, C.R., Harper, J.L. (2005) Ecology: From Individuals to Ecosystems.
511
fourth Edition. Wiley-Blackwell, Oxford.
512
Bilton, D.T. (2014) Dispersal in Dytiscidae, In: Donald, E. (ed.) Ecology, Systematics, and 513
the Natural History of Predaceous Diving Beetles (Coleoptera: Dytiscidae), pp.387- 514
407. Springer, New York.
515
Brose, U. (2003) Bottom-up control of carabid beetle communities in early successional 516
wetlands: mediated by vegetation structure or plant diversity? Oecologia, 135, 407- 517
413.
518
Brown, J.H. (2014) Why are there so many species in the tropics? Journal of Biogeography, 519
41, 8-22.
520
Butterfield, J.E. (1996) Carabid life-cycle strategies and climate change: a study on an 521
altitude transect. Ecological Entomology, 21, 9-16.
522
Cardoso, P., Rigal, F. & Carvalho, J. C. (2015) BAT – Biodiversity Assessment Tools, an R 523
package for the measurement and estimation of alpha and beta taxon, phylogenetic 524
and functional diversity. Methods in Ecology and Evolution, 6, 232-236.
525
Carvalho, J.C., Cardoso, P. & Gomes, P. (2012) Determining the relative roles of species 526
replacement and species richness differences in generating beta-diversity patterns.
527
Global Ecology and Biogeography, 21, 760-771.
528
Currie, D.J., Mittelbach, G.G., Cornell, H.V., Field, R., Guégan, J.F., Hawkins, B.A., 529
Kaufman, D.M., Kerr, J.T., Oberdorff, T., O’Brien, E. & Turner, J.R.G. (2004) 530
Predictions and tests of climate-based hypotheses of broad-scale variation in 531
taxonomic richness. Ecology Letters, 7, 1121e1134.
532
Dajoz, R. (2002) Les Coléoptères Carabides et Ténébrionidés. Ecologie et Biologie.
533
Lavoisier, Paris.
534
Dapporto, L., Ramazzotti, M., Fattorini, S., Vila, R., Talavera, G. & Dennis, R.H.L. (2015) 535
Package ‘recluster’. Ordination Methods for the Analysis of Beta-Diversity Indices.
536
Version 2.8. https://cran.r-project.org/web/packages/recluster/recluster.pdf 537
Elek, Z., Drag, L., Pokluda, P., Čížek, L.& Bérces, S. (2014) Dispersal of individuals of the 538
flightless grassland ground beetle, Carabus hungaricus (Coleoptera: Carabidae), in 539
three populations and what they tell us about mobility estimates based on mark- 540
recapture. European Journal of Entomology, 111, 663-668.
541
Eriksson, O., Cousins, S.A.O. & Bruun, H.H. (2002) Land-use history and fragmentation of 542
traditionally managed grasslands in Scandinavia. Journal of Vegetation Science, 13, 543
743-748.
544
Eyre, M.D., Luff, M.L., Staley, J.R. & Telfer, M.G. (2003) The relationship between British 545
ground beetles (Coleoptera, Carabidae) and land cover. Journal of Biogeography, 30, 546
719-730.
547
Eyre, M.D. & Luff, M.L. (2004) Ground beetle species (Coleoptera, Carabidae) associations 548
with land cover variables in northern England and southern Scotland. Ecography, 27, 549
417-426.
550
Evans, K.L. & Gaston, K.J. (2005) People, energy and avian species richness. Global 551
Ecology and Biogeography, 14, 187-196.
552
Fattorini, S. (2010) The influence of geographical and ecological factors on island beta 553
diversity patterns. Journal of Biogeography, 37, 1061-1070.
554
Fattorini, S. & Ulrich, W. (2012a) Drivers of species richness in European Tenebrionidae 555
(Coleoptera). Acta Oecologica, 36, 255-258.
556
Fattorini, S. & Ulrich, W. (2012b) Spatial distributions of European Tenebrionidae point to 557
multiple postglacial colonization trajectories. Biological Journal of the Linnean 558
Society, London, 105, 318-329.
559
Fattorini, S., Galassi, D.M.P. & Strona, G. (2016) When human needs meet beetle 560
preferences: tenebrionid beetle richness covaries with human population on the 561
Mediterranean islands. Insect Conservation and Diversity, 9, 369-373.
562
Ferrier, S., Manion, G., Elith, J. & Richardson, K. (2007) Using generalized dissimilarity 563
modelling to analyse and predict patterns of beta diversity in regional biodiversity 564
assessment. Diversity and Distributions, 13, 252-264.
565
Field, R., Hawkins, B.A., Cornell, H.V., Currie, D.J., Diniz-Filho, J.A.F., Guegan, J.-F., 566
Kaufman, D.M., Kerr, J.T., Mittelbach, G.G., Oberdorff, T., O'Brien, E.M. & Turner, 567
J.R.G. (2009) Spatial species-richness gradients across scales: a meta-analysis.
568
Journal of Biogeography, 36, 132-147.
569
Fitzpatrick, M.C., Sanders, N.J., Normand, S., Svenning, J.C., Ferrier, S. Gove, A.D. &
570
Dunn, R.R. (2013) Environmental and historical imprints on beta diversity: insights 571
from variation in rates of species turnover along gradients. Proceedings of the Royal 572
Society B, 280, 20131201.
573
Gaston, K.J. (2005) Biodiversity and extinction: species and people. Progress in Physical 574
Geography, 29, 239-247.
575
Gaston, K.J. & Blackburn, T.M. (2000) Pattern and Process in Macroecology. Blackwell 576
Science, Oxford.
577
Glassman, S.I., Wang, I.J. & Bruns, T.D. (2017) Environmental filtering by pH and soil 578
nutrients drives community assembly in fungi at fine spatial scales. Molecular 579
Ecology, 26, 6960-6973.
580
Hawkins, B.A. & Diniz-Filho, J.A.F. (2004) ‘Latitude’ and geographic patterns in species 581
richness. Ecography, 27, 268-272.
582
Heino, J. (2011) A macroecological perspective of diversity patterns in the freshwater realm.
583
Freshwater Biology, 56, 1703–1722.
584
Heino, J. & Alahuhta, J. (2015) Elements of regional beetle faunas: faunal variation and 585
compositional breakpoints along climate, land cover and geographical gradients.
586
Journal of Animal Ecology, 84, 427-441.
587
Heino, J., Alahuhta, J. & Fattorini, S. (2015) Phylogenetic diversity of regional beetle faunas 588
at high latitudes: patterns, drivers and chance along ecological gradients. Biodiversity 589
and Conservation, 24, 2751-2767.
590
Heino, J., Virkkala, R. & Toivonen, H. (2009) Climate change and freshwater biodiversity:
591
detected patterns, future trends and adaptations in northern regions. Biological 592
Reviews, 84, 39-54.
593
Hickling, R., Roy, D. B., Hill, J. K., Fox, R. & Thomas, C. D. (2006) The distributions of a 594
wide range of taxonomic groups are expanding polewards. Global Change Biology, 595
12, 450-455.
596
Hijmans, R.J., Cameron, S.E., Parra, J.L., Jones, P.G. & Jarvis, A. (2005) Very high resolution 597
interpolated climate surfaces for global land areas. International Journal of 598
Climatology, 25, 1965-1978.
599
Hillebrand, H. (2004) On the generality of the latitudinal diversity gradient. American 600
Naturalist, 163, 192-211.
601
Hortal, J., Diniz‐Filho, J. A., Bini, L. M., Rodríguez, M. Á., Baselga, A., Nogués‐Bravo, D., 602
Rangel, T. F., Hawkins, B. A. & Lobo, J. M. (2011) Ice age climate, evolutionary 603
constraints and diversity patterns of European dung beetles. Ecology Letters, 14, 741- 604
748.
605
Kagawa, Y. & Maeto, K. (2014) Ground beetle (Coleoptera: Carabidae) assemblages 606
associated with a satoyama landscape in Japan: the effects of soil moisture, weed 607
height, and distance from woodlands. Applied Entomology and Zoology, 49, 429-436.
608
Koivula., M., Punttila., P., Haila, Y. & Niemelä, J. (1999) Leaf litter and the small-scale 609
distribution of carabid beetles (Coleoptera, Carabidae) in the boreal forest.
610
Ecography, 22, 424-435.
611
Koivula, M. (2011) Useful model organisms, indicators, or both? Ground beetles (Coleoptera, 612
Carabidae) reflecting environmental conditions. ZooKeys, 100, 287-317.
613
König, C., P. Weigelt, P. & Kreft, H. (2017) Dissecting global turnover in vascular plants.
614
Global Ecology and Biogeography, 26, 228-242.
615
Kotze, D. J., Brandmayr, P., Casale, A., Dauffy-Richard, E., Dekoninck, W., Koivula, M. J., 616
Lövei, G. L., Mossakowski, D., Noordijk, J., Paarmann, W., Pizzolotto, R., Saska, P.,
Schwerk, A., Serrano, J., Szyszko, J., Taboada, A., Turin, H., Venn, S., Vermeulen, R.
618
& Zetto, T. (2011) Forty years of carabid beetle research in Europe - from taxonomy, 619
biology, ecology and population studies to bioindication, habitat assessment and 620
conservation. ZooKeys, 100, 55-148.
621
Legendre, P. (2014) Replacement and richness difference components. Global Ecology and 622
Biogeography, 23, 1324-1334.
623
Legendre, P., Borcard, D. & Peres-Neto, P. R. (2005) Analyzing beta diversity: Partitioning 624
the spatial variation of community data. Ecological Monographs, 75, 435-450.
625
Lindroth, C.H. (1985) The Carabidae (Coleoptera) of Fennoscandia and Denmark. Fauna 626
Entomologica Scandinavica, 15, 1-225.
627
Lindroth, C.H. (1986) The Carabidae (Coleoptera) of Fennoscandia and Denmark. Fauna 628
Entomologica Scandinavica, 15, 226-497.
629
Lomolino, M.V., Riddle, B.R., Whittaker, R.J. & Brown, J.H. (2010) Biogeography. Fourth 630
Edition. Sinauer, Sunderland.
631
Lövei, G. L. & Sunderland, K. D. (1996) Ecology and behaviour of ground beetles 632
(Coleoptera: Carabidae). Annual Review of Entomology, 41, 231–256.
633
Manion, G., Lisk, M., Ferrier, S., Nieto-Lugilde, D., Mokany, K. & Fitzpatrick, M.C. (2017) 634
gdm: Generalized Dissimilarity Modeling. R package version 1.3.4.
635
https://CRAN.R-project.org/package=gdm 636
Martinson, H. M. & Raupp, M.J. (2013) A meta-analysis of the effects of urbanization on 637
ground beetle communities. Ecosphere 4: 60. http://dx.doi.org/10.1890/ES12- 638
00262 639
McKinney, M.L. (2002) Urbanization, biodiversity and conservation. BioScience, 52, 883- 640
890.
641
Minchin, P.R. (1987) An evaluation of relative robustness of techniques for ecological 642
ordinations. Vegetatio, 69, 89-107.
643
Mittelbach, G.G. (2012) Community Ecology. Sinauer, Sunderland.
644
Müller-Kroehling, S., Jantsch, M.C., Fischer, H.S., & Fischer, A. (2014) Modelling the 645
effects of global warming on the ground beetle (Coleoptera: Carabidae) fauna of 646
beech forests in Bavaria, Germany. European Journal of Entomology, 111, 35- 647
648 49.
New, T. R. (2015) Insect Conservation and Urban Environments. Springer, New York.
649
Nilsson, A.N., Elmberg, J. & Sjöberg, K. (1994) Abundance and species richness patterns of 650
predaceous diving beetles (Coleoptera, Dytiscidae) in Swedish lakes. Journal of 651
Biogeography, 21, 197-206.
652
Nilsson, A.N. & Holmen, M. (1995) The Aquatic Adephaga of Fennoscandia and Denmark 2.
653
Dytiscidae. Fauna Entomologica Scandinavica, 32, 1-188.
654
Nilsson, A.N. & Söderberg, H. (1996) Abundance and species richness patterns of diving 655
beetles (Coleoptera, Dytiscidae) from exposed and protected sites in 98 northern 656
Swedish lakes. Hydrobiologia, 321, 83-88.
657
Oksanen, J., Blanchet, F.G., Kindt, Friendly, M., R., Legendre, P., McGlinn, D., Minchin, 658
P.R., O'Hara, R.B., Simpson, G.L., Solymos, P., Stevens, M.H.H., Szoecs, E. &
659
Wagner, H. (2017) vegan: Community Ecology Package. R package version 2.4-5.
660
http://CRAN.R-project.org/package=vegan.
661
Podani, J. & Schmera, D. (2011) A new conceptual and methodological framework for 662
exploring and explaining pattern in presence-absence data. Oikos, 120, 1625-1638.
663
Qian, H. & Ricklefs, R.E. (2012) Disentangling the effects of geographic distance and 664
environmental dissimilarity on global patterns of species turnover. Global Ecology 665
and Biogeography, 21, 341-351.
666
Rainio, J. & Niemelä, J. (2003) Ground beetles (Coleoptera: Carabidae) as bioindicators.
667
Biodiversity & Conservation, 12, 487-506.
668
Sala, O. E., F. S. Chapin, J. J. Armesto, E. Berlow, J. Bloomfield, R. Dirzo, E. Huber- 669
Sanwald, L. F. Huenneke, R. B. Jackson, A. Kinzig, R. Leemans, D. M. Lodge, H. A.
670
Mooney, M. Oesterheld, N. L. Poff, M. T. Sykes, B. H. Walker, M. Walker, and D. H.
671
Wall. (2000) Global biodiversity scenarios for the year 2100. Science, 287, 1770- 672
1774.
673
Schuldt, A. & Assmann, T. (2009) Environmental and historical effects on richness and 674
endemism patterns of carabid beetles in the western Palaearctic. Ecography, 32, 705- 675
714.
676
Seppälä, M. (ed). (2005). The Physical Geography of Fennoscandia. Oxford University 677
Press. Oxford.
678
Shryock, D. F., Havrilla, C.A., DeFalco, L.A., Esque, T.C., Custer, N.A. & T. E. Wood (2015) 679
Landscape genomics of Sphaeralcea ambigua in the Mojave Desert: a multivariate, 680
spatially-explicit approach to guide ecological restoration. Conservation Genetics, 16, 681
1303-1317.
682
Socolar, J.B., Gilroy, J., W. Kunin, W. & Edwards, D. 2016. How should beta-diversity 683
inform biodiversity conservation? Trends in Ecology and Evolution, 31, 67-80.
684
Soininen, J., Bartels, P., Heino, J., Luoto, M. & Hillebrand, H. (2015) Toward more integrated 685
ecosystem research in aquatic and terrestrial environments. BioScience, 65, 174-182.
686
Soininen, J., Heino, J. & Wang, J. (2018) A meta-analysis of nestedness and turnover 687
components of beta diversity across organisms and ecosystems. Global Ecology and 688
Biogeography, 27, 96-109.
689
Taboada, A., Kotze, D.J., Tárrega, R. & Salgado, J.M. (2008) Carabids of differently aged 690
reforested pinewoods and a natural pine forest in a historically modified landscape.
691
Basic and Applied Ecology, 9, 161-171.
692
Thiele, H. U. (1977) Carabid Beetles in Their Environments. Springer, Berlin.
693
Thomas, C.D., France, A.M.A. & Hill J. K. (2006) Range retractions and extinction in the 694
face of climate warming. Trends in Ecology and Evolution, 21, 415-416.
695
Thomas, M.C. (2008) Beetles (Coleoptera). In: Capinera, J.L. (ed.) Encyclopedia of 696
Entomology. Second edition, pp. 437-447. Springer, New York.
697
Tonial, M.L.S., Silva, H.L.R., Tonial, I.J., Costa, M.C., Silva Júnior, N.J. & Diniz-Filho, 698
J.A.F. (2012) Geographical patterns and partition of turnover and richness 699
components of beta-diversity in faunas from Tocantins river valley. Brazilian Journal 700
of Biology, 72, 497-504 701
Tuomisto, H. (2010) A diversity of beta diversities: straightening up a concept gone awry.
702
Part 1. Defining beta diversity as a function of alpha and gamma diversity.
703
Ecography, 33, 2-22.
704
Tuomisto, H. and Ruokolainen, K. (2006) Analyzing or explaining beta diversity?
705
Understanding the targets of different methods of analysis. Ecology, 87, 2697-2708.
706
Väisänen, R. & Heliövaara, K. (1994) Hot-spots of insect diversity in northern Europe.
707