1 The original published PDF available in this website:
1
https://www.sciencedirect.com/science/article/pii/S0048969719318212?via%3Dihub 2
3
Spatiotemporal variations of pharmacologically active compounds in surface waters of a 4
summer holiday destination 5
6
Gabor Maasz1*, Matyas Mayer2, Zita Zrinyi1, Eva Molnar1, Monika Kuzma2, Istvan Fodor1, Zsolt 7
Pirger1# and Péter Takács3#
8 9
1 NAP Adaptive Neuroethology, Department of Experimental Zoology, Balaton Limnological 10
Institute, MTA-Centre for Ecological Research, 8237 Tihany, Hungary 11
2 Department of Forensic Medicine, Medical School, University of Pecs, 7624 Pecs, Hungary 12
3 Department of Hydrozoology, Balaton Limnological Institute, MTA-Centre for Ecological 13
Research, 8237 Tihany, Hungary.
14 15
*Address correspondence to Dr. Gabor Maasz, Department of Experimental Zoology, Balaton 16
Limnological Institute, MTA-Centre for Ecological Research, 8237 Tihany, Hungary 17
E-mail: maasz.gabor@okologia.mta.hu 18
Tel.: +36 87 448 244 19
20
# equally credited authors 21
2 22
Abstract 23
The release of pharmacologically active compounds (PhACs) into aquatic ecosystems 24
poses an environmental risk resulting in a chronic exposure of non-target organisms. A great 25
variety of PhACs, of generally low concentrations, and the complicated sample preparation, 26
makes circumstantial the accurate detection and quantification. Additionally, there is little 27
information published about the spatiotemporal variation of the PhAC load in a larger catchment 28
area utilised for touristic purposes. In addition to the natural biotic and abiotic changes, the 29
seasonal variation of tourism also has a dramatic impact on water quality and the natural 30
ecosystem in larger catchment areas. Therefore, our aim was to develop a reliable solid-phase 31
extraction (SPE)-supercritical fluid chromatography tandem mass spectrometry (SFC-MS/MS) 32
method for simultaneous multi-residue analysis of drugs to reveal the spatiotemporal changes in 33
the PhAC contaminations in the waters of an important touristic region, the catchment area of the 34
largest shallow lake in Central Europe, Lake Balaton (Hungary). The environmental application 35
of the developed method revealed 69 out of the traced 134 chemical compounds, including 15 36
PhACs, which were detected from natural waters for the first time. Wastewater treatment plant 37
(WWTP) loads have a major role in the PhAC contamination of the studied area; at the same 38
time, the mass tourism-induced PhAC contamination was also detectable. Furthermore, the 39
impact of tourism was indicated by elevated concentrations of recreational substances (e.g., 40
3
caffeine and illicit drugs) in the touristic season affecting the water quality of this important 41
summer holiday destination.
42 43
Keywords: Shallow lake, Environmental monitoring, Mass Spectrometry, Solid Phase 44
Extraction, Pharmaceuticals, Multi-residue analysis 45
46
1. Introduction 47
Efficient sewage treatment plays a key role in preserving freshwaters in appropriate 48
condition (Goel, 2006). However, the wastewater treatment technology used today is still not able 49
to eliminate all kinds of pollutants. Several PhACs, which are excreted and entered into the 50
sewage system, are not eliminated completely by WWTP, therefore, these contaminants appear in 51
the recipient natural waters (Postigo et al., 2010). The concentration of these pollutants is 52
generally low (ng/l to μg/l range) (Silva et al., 2012), therefore, only the more recently developed 53
analytical techniques (e.g. liquid chromatography coupled mass spectrometry) are sensitive 54
enough for their detection and exact quantification in environmental samples (Bianchi et al., 55
2018). The reason could be that while the effects of certain pollutants, such as heavy metals and 56
pesticides (Dean et al., 1972), have been analysed for a long time, the importance of PhACs has 57
just been recognised in the last decades (Daughton and Ternes, 1999). Besides the low 58
concentration levels, the large number and the great structural variety of the potentially detectable 59
PhACs makes it difficult to determine the contamination level of the recipient freshwaters 60
(Kasprzyk-Hordern, 2010; Kolpin et al., 2002). Because of the abovementioned features, usually 61
a limited number of components are surveyed in environmental samples (Cantwell et al., 2018;
62
Gomez et al., 2007; Musolff et al., 2009; Roberts and Thomas, 2006). In addition, there are only a 63
4
few recently published notes about the spatiotemporal distribution of PhACs in larger drainage 64
systems (Carpenter and Helbling, 2018; Guzel et al., 2018; Lindholm-Lehto et al., 2015).
65
Chemical pollutants, like PhACs, of surface water poses a threat to the aquatic 66
environment, with effects such as acute and chronic toxicity in aquatic organisms, accumulation 67
of pollutants in the ecosystem and loss of habitats and biodiversity, and also pose a threat to 68
human health. According to the Environmental Quality Standards Directive (Directive 69
2008/105/EC) for determination of anthropogenic chemical pollutions at a global level, a new 70
Watch List (WL) is needed to provide high-quality monitoring information on the concentrations 71
of polluting substances in the aquatic environment. The surface water WL supports the 72
identification of priority substances for regulation under the Water Framework Directive. The 73
first WL was established in 2013 under the Directive 2008/105/EC (as amended by Directive 74
2013/39/EU), collecting four PhACs (E1, E2, EE2 and diclofenac). After, the WL was modified 75
based on the Joint Research Center (JRC) Technical Report in 2015 (EU Commission JRC 2015) 76
and in April 2018 (EU Commission JRC 2018), additionally, the latter provided several 77
recommendations for the second WL. New candidate WL substances should be selected among 78
substances posing a potential risk for the environment, but for which there is not enough good 79
quality monitoring data to confirm this risk. Therefore, there is a continuing need for the 80
development and optimisation of sensitive analytical techniques to detect and measure 81
environmental substances.
82
Environmentally high throughput analysis is an analytical challenge when the criteria are 83
optimal sample preparation for more types of drugs together with an analytical system with 84
appropriate capacity. Multi-residue analysis achieves simultaneous drug screening. The most 85
commonly used sample preparation method for the multi-residue analysis is solid phase 86
extraction (SPE). One of the greatest challenges with multi-residue analysis is the selection of 87
5
sorbent able to give acceptable recoveries for all compounds characterised by different 88
physicochemical properties (Baker and Kasprzyk-Hordern, 2011). The number of processable 89
molecules can be increased by using mixed stationary phases via SPE procedures.
90
Besides the sample preparation, there is the limitation of past analytical systems used in 91
determining the number of detectable molecules. Nowadays, by using an analytical method based 92
on supercritical fluid chromatography/tandem mass spectrometry (SFC-MS/MS), we can achieve 93
detection of some pesticides (e.g., dinotefuran, fenbuconazole, isofenphos-methyl) and their 94
metabolites in environmental samples (e.g., honey, fruits, vegetables, cereals, soil and water) 95
(Granby et al., 2004; Hernandez et al., 2011; Kamel, 2010). Application of carbon dioxide (CO2), 96
as supercritical fluid has many benefits. It is non-toxic, and has low viscosity and high diffusivity, 97
contributing greatly to improving the separation efficiency and reducing the organic solvents 98
utilisation (Chen et al., 2015; 2016; Tao et al., 2018). The MS/MS is able to overcome the 99
traditional incompatibility, offering high resolution and narrow peaks (Chen et al., 2016).
100
Summarised, this technique provides a rapid, efficient, sensitive, reliable and environmentally 101
friendly solution for detection of several pesticide compounds in environment samples (Chen et 102
al., 2015; Tao et al., 2018). Moreover, it is also important to mention that SFC-MS/MS can be a 103
powerful tool in the simultaneous analysis of a wide range of compounds (multi-residue analysis) 104
in difficult matrices that require high sensitivity and rapid screening capacity. For example, 441 105
pesticide compounds were determined simultaneous in a food sample by applying the SFC- 106
MS/MS analytical method (Fujito et al., 2017). In addition, the instrumental improvements have 107
led to the emergence of ultrahigh performance supercritical fluid based chromatography 108
(UHPSFC) that merges the advantages of SFC and ultrahigh performance liquid chromatography 109
technology. Also UHPSFC-MS/MS analytical methods have already been developed for the 110
simultaneous analysis of several PhACs in environmental matrices. This novel technique was 111
6
well-suited for the simultaneous analysis of 23 veterinary and human PhACs in wastewater 112
samples (Camacho-Munoz et al., 2016).
113
Beyond the traditional economic sectors (agriculture, industry), tourism has become an 114
important water utiliser in the last decades (Gossling et al., 2012). At the same time, the growing 115
tourism industry frequently has a negative impact on natural ecosystems (Hadwen et al., 2005;
116
Katircioglu, 2014; Mihalic, 2000). In addition, to the elevated macronutrient (N, P) intake 117
through the increased PhACs and personal care products load, tourism may have a potentially 118
negative effect on the quality of surface waters (Gonzalez-Alonso et al., 2017; Mandaric et al., 119
2017). These tourism-generated negative effects may occur seasonally. Seasonal changes induced 120
by anthropogenic factors were also observed earlier using physico-chemical variables (Barakat et 121
al., 2016; Vega et al., 1998), microbiological indicators (Lenart-Boron et al., 2016) and 122
physicochemical parameters of water and bacterial water quality indicators (Bojarczuk et al., 123
2018).
124
Therefore, our aim was to develop a fast and reliable SPE-SFC-MS/MS method suitable 125
for multi-residue analysis of drugs in environmental samples. In this study, we focused on the 126
psychoactive drug contamination, which can be classified into the alkaloid, antiepileptic, 127
antipsychotic/antidepressant, anxiolytic, dissociative anesthetic/psychedelic, 128
narcotic/sedative/anticonvulsant, opioid/morphine derivatives and stimulant/hallucinogen groups.
129
Furthermore, other widely used and chronically administered drug groups, such as cardiovascular 130
drugs, hormone/hormone derivatives, local anesthetic and nonsteroidal anti-inflammatory drugs 131
(NSAIDs) were also investigated. Additionally, our other aim was to reveal the spatiotemporal 132
changes in the PhACs concentration in the waters of an important summer holiday destination, 133
the catchment area of Lake Balaton (Hungary) using our fast and reliable developed method.
134
2. Materials and methods 135
7 2.1 Study area
136
Our study was carried out on the catchment area of Lake Balaton, Hungary (Table S1, 137
Fig. 1), which is one of the largest (A: 594 km2, mean depth: 3.2 m, V: ~1.8 km3) freshwater 138
shallow lakes in Central Europe (Istvánovics et al., 2007). The lake and its catchment area can be 139
characterised by diverse flora and fauna (Istvanovics et al., 2008; Palffy et al., 2013; Specziar et 140
al., 2009). Its largest tributary is the River Zala, which empties into the westernmost basin of the 141
lake. Its mean discharge of 8 m3/s supplies almost 50% of the lake's total surface water input. The 142
only outflow of the lake is the artificial Sió canal, situated in the eastern basin of the lake at 143
Siófok, joining the Balaton catchment (A: 5775 km2) to the Danubian River Network (Fig.1). The 144
human population shows uneven spatial and temporal distribution in this area. While the largest 145
town in the catchment area (~60,000 inhabitants), Zalaegerszeg, is located on the riverbank of 146
River Zala about 80 river kms from the Lake. Two-thirds of the total permanent inhabitants 147
(~380,000) of the catchment, are distributed at the near-coastal area of the lake (“Lake Balaton 148
Resort Area” LBRA, see: URL1). There is no considerable industrial activity in the catchment 149
area of the lake, therefore, this region is characterised as a barely contaminated area by industrial 150
pollutants (e.g., heavy metals) (Nguyen et al., 2005). The LBRA is an internationally important 151
tourist attraction and recreation center visited by about 2,000,000 tourists a year. The number of 152
guest-nights, which exceeds the 6’,400,000 per year, is unevenly distributed, and weighted to two 153
summer months (July and August), mostly to the southern shoreline of the eastern basin of the 154
Lake, at the area of Zamárdi and Siófok (Horvath, 2011).
155
The increased, but uncoordinated utilisation of the catchment’s environmental resources 156
caused massive eutrophication of the lake at the end of the 1970s (Hatvani et al., 2014; Puczkó 157
and Rátz, 2000). For this reason, in the early 1980s, a regional nutrient load control strategy was 158
worked out for Lake Balaton. Among others, 1) a “filtering” shallow wetland (mean depth ~1.2 159
8
m) was reconstructed in two “phases” at the estuary of River Zala (Kis Balaton Water Protection 160
System (KBWPS) 1 and 2 (Fig. 1A)) (Tatrai et al., 2000) and 2) several WWTPs were built and 161
the larger existing WWTPs (e.g., in Zalaegerszeg and Keszthely) were expanded with tertiary 162
treatment (chemical P precipitation). Nowadays, more than 40 WWTPs can be found in the 163
catchment of Lake Balaton (Fig.1A). Their capacity varies between 2 and 50,000 m3/day. The 164
largest WWTP is situated to the city of Zalaegerszeg. Here, we have to note that the cleared 165
wastewater intake exceeds the 30% of the mean discharge of the recipient Zala section (URL2).
166
3) To minimise the direct treated sewage load into the lake, a sewage transfer duct system was 167
constructed at the southern and eastern near-coastal area, which collects and draws most of the 168
purified communal sewage away from the Lake Balaton catchment (Fig.1A). At the same time, 169
the WWTPs situated away from the lake, empty their outflow into the tributaries of the lake.
170
2.2 Sample collection and on-site hydrophysico-chemical parameter recordings 171
Designation of sampling sites (Fig. 1A) was based on earlier screening (Avar et al., 172
2016a), where the main sources of contamination and contaminated locations were determined on 173
the catchment area of Lake Balaton. All water samples were collected in June (summer), August 174
(summer), and November (autumn) of 2017, and in April (spring) of 2018 within one day from 175
10 sampling sites. Six sites were designated on the littoral region of the lake, two on the area of 176
the KBWPS and two on River Zala, upstream and downstream of the municipal WWTP of 177
Zalaegerszeg (Table S1, Fig. 1A).
178
All samples were collected in amber silanised glass bottles (2 L) with Teflon faced caps 179
(Thermo Fisher Scientific). The oxygen saturation, conductivity, pH and temperature were 180
measured during the collections (Table S1) using Voltcraft DO100 oxygen meter and HANNA 181
HI98129 multimeter. To further protect sample preparation, the samples were transported back to 182
the laboratory in a dark and iced cool box within 4 hours.
183
9 2.3 Chemicals, reagents and materials
184
All analytes and internal standards (IS) were of high purity available (>97%). Analyte 185
names and CAS numbers are shown in Table S3. Solvents and additives to solid phase extraction 186
and SFC-MS/MS analysis were all of LC–MS quality and purchased from Scharlab, with the 187
exception of ammonium solution (20% in water) and formic acid (100%), which were purchased 188
from VWR. The IS were dissolved in methanol (MeOH) or acetonitrile (ACN) at a concentration 189
of 1 or 0.1 g/L: Citalopram-d6 (#C-090, Sigma-Aldrich), Carbamazepine-d10 (#C-094, Sigma- 190
Aldrich), 13C3-E2 (#13E2-122, Lipomed AG) and N-ethyl-oxazepam (#OXA-325, Lipomed 191
AG). Individual stock solutions were purchased or prepared from solid substance in either ACN 192
or MeOH at a concentration of 1 or 0.1 g/L and stored in the dark at −20°C. Mixed standard 193
solutions were prepared at 10 mg/L in MeOH and diluted as necessary to prepare working 194
solutions on a daily basis.
195
2.4 Sample preparation, SPE and derivatisation 196
One liter of each samples was acidified with 100% formic acid (compatible with all tested 197
sorbent types) to pH 3.5–4.0. All IS were added to samples before filtration, the final 198
concentration was 5 ng/L to each IS (Citalopram-d6, Carbamazepine-d10, E2-13C3 and N-ethyl- 199
oxazepam) and were used for the quantification of samples. After spiking, samples were vacuum 200
filtered, first through a GF/A 1.6 µm glass microfibre filter (#1820-047, Whatman), and 201
subsequently, through a GF/F 0.7 µm glass microfibre filter (#516-0345, VWR). Samples were 202
stored in the dark at 4°C and extracted within 20 hours, thereby, the sample was fully prepared 203
within 24 hours from the sampling.
204
The SPE of samples was carried out with AutoTrace 280 automata SPE system (Thermo 205
Scientific). Nitrogen gas stream was utilised for the evaporation of SPE extracts. The method was 206
optimised through several preliminary experiments involving the following variables: type (Strata 207
10
X, X-CW, C8, C18E) and amount (100–500 mg) of sorbent, sample volume (0.5–2 L), 208
solvent/water portion of washing solutions (10–50%), elution (MeOH, ACN, 1–14%
209
NH4OH/ACN) and evaporation conditions (0.2–1 bar, 30–50°C) (see Supplementary information 210
“SPE optimisation” part).
211
The final SPE procedure was as follows. Initially, the Strata X-CW (33 µm, 200 mg/6mL, 212
#8B-S035-FCH, Phenomenex) column was conditioned with MeOH (3 mL) and equilibrated with 213
0.1% HCOOH/H2O (3 mL, pH 4), both at a flow rate of 10 mL/min. Acidified water samples 214
(1000 mL) were passed through the X-CW cartridge at a rate of 15 mL/min. Immediately 215
following loading, cartridges were washed with 0.1% HCOOH/H2O (6 mL, pH 4) and 20% ACN/
216
HCOOH/H2O both at a flow rate of 10 mL/min. The syringe of SPE automata was washed with 6 217
mL of ACN, then the cartridges were dried with N2 gas for 2 min to eliminate the aqueous 218
residues. The elution was performed by two steps to reach the optimal recovery of all analytes.
219
Firstly, for the restoration of optimal condition, the dried cartridge was soaked with 1 mL ACN 220
for 1 min, followed by the first elution with 100% ACN (4 mL) at a flow rate of 5 mL/min into 221
sample tube (Eluate1). The second elution was applied with 7% NH4OH/ACN (5 mL) at a flow 222
rate of 5 mL/min into a new sample tube (Eluate2). Then both eluates were evaporated to dryness 223
by nitrogen gas stream (35°C, 0.5 bar) and reconstituted with ACN (500-500 µL) induced by 224
ultrasound and vortex mixing. To maximum recovery, deactivated vials with PTFE septa 225
(Waters) 300 µL reconstituted samples were transferred. The basic, and some amphoteric, drugs 226
were analysed from Eluate2. Furthermore, the acidic, neutral and some amphoteric drugs were 227
measured from Eluate1 (Table S3). Derivatisation of steroid agents was performed to reach the 228
appropriate sensitivity. To the remainder of the 200 µL reconstituted sample (Eluate1), 160 µL 229
Na2CO3-t (0.1 M in water) and 20 µL dansyl-chloride (40 mM in ACN, #39220-1G-F, Sigma- 230
Aldrich) were added. These mixtures were incubated in a thermomixer (65°C, 300 rpm) for 10 231
11
min. After the incubation, the mixtures were centrifuged (20,000 rpm, 20°C) for 5 min, followed 232
by adding 80 µL toluene and vortex mixed. All samples were centrifuged again (20,000 rpm, 20 233
°C) for 5 min before being transferred to maximum recovery deactivated vials with PTFE septa 234
(Waters).
235
For quantitative analysis, five-point calibration curves were used in each external 236
standard. The waters were spiked with the standards, on which the total sample preparation 237
method was applied. The limit of detection (LOD) and limit of quantification (LOQ) were also 238
determined (Table S3) by analysis of spiked and fully prepared water samples.
239
2.5 SFC-MS/MS analysis 240
Measurements were performed by an ACQUITY UPC2 supercritical fluid 241
chromatography system (Waters) coupled with a Xevo TQ-S Triple Quadrupole Mass 242
Spectrometer (Waters). Data were recorded by MassLynx software (V4.1 SCN950) and evaluated 243
by TargetLynx XS software.
244
Separation of compounds was performed on a 3.0 mm x 100 mm, 1.7 µm particle size, 245
ACQUITY UPC2 BEH analytical column (#186007607, Waters). Chromatography was 246
performed at 45°C and the injected volume was 2 μL. The flow rate of the mobile phase was 1.2 247
mL/min. For the analysis of hormones and hormone derivatives from Eluate1 using 13C3-E2 248
internal standard, the mobile phase consisted of a mixture of carbon dioxide (A) and 5 mM 249
ammonium hydroxide in MeOH (B). The following gradient profile was used: 100% A at 0 min, 250
87.5% A at 0.5 min and 77.5% A at 4 min. For the analysis of acidic or neutral and some 251
amphoteric drugs from Eluate1 using Carbamazepine-d10 internal standard, the mobile phase 252
consisted of a mixture of carbon dioxide (A) and 30 mM ammonium hydroxide and 15 mM acetic 253
acid in methanol (B). The following gradient profile was used: 99.9% A in the beginning and 254
72.5% A at 5.5 min. For the analysis of basic and some amphoteric drugs from Eluate2 using 255
12
Citalopram-d6 and N-ethyl-oxazepam internal standards, the mobile phase consisted of a mixture 256
of carbon dioxide (A) and 30 mM ammonium hydroxide and 15 mM acetic acid in MeOH (B).
257
The following gradient profile was used: 99.9% A at 0 min. and 65.0% A at 7 min. A pre- 258
equilibration period lasting 2 min was applied before each injection. Constant 200 bar back 259
pressure was used to maintain the supercritical state.
260
To sustain a suitable electrospray, an additional solution consisting of 5 mM ammonium 261
hydroxide in MeOH was applied with a flow rate of 0.1 mL/min. This makeup solvent was 262
delivered by a Waters 515 HPLC Pump.
263
The MS measurement was performed in positive ion mode (except for some 264
antiepileptics). The ESI source was operated with a spray voltage of 3 kV in both positive and 265
negative ion modes; cone voltage was 30 V. The source was set at 150°C. Both desolvation and 266
cone gases were nitrogen delivered at 300 and 150 L/min, respectively. Desolvation gas was 267
tempered at 300°C. The collision gas was argon with a flow rate of 0.13 mL/min.
268
MS/MS experiments were performed in MRM (multiple reaction monitoring) mode with an 269
isolation window of 0.4 m/z. The utilised precursor-product ion transitions with the related 270
collision energies in Table S3 were indicated.
271
Peak detection and quantification was achieved using TargetLynx XS software (Waters).
272
The observed ions (mass in m/z) were accepted and quantified if they were within the following 273
limits: appropriate MS1 mass, retention time, MS2 masses, fragmentation pattern and IS 274
correction.
275
2.6 Data analysis and presentation 276
The frequency of occurrences and mean concentrations of the observed PhACs are 277
indicated on bar charts. Principal Component Analysis (PCA) was made using concentration data 278
of the PhACs grouped into 10 chemical classes to present the sample sites detachments in the 279
13
different study periods. Number of PhACs by sampling sites, periods and areas are indicated on 280
boxplots. The persistence of pharmaceutical composition was calculated using the Jaccard 281
similarity index. Similarity computations were made for each possible combination (n=6, June- 282
August, June-November, June-April, August-November, August-April, November-April) for 283
each site’s data. In this case, the similarity values ranged between 0 and 1, where 0 indicates that 284
the drug composition of the samples collected from the same site are absolutely different, and 1 285
indicates that the compared samples have identical composition. These results are presented on 286
boxplots as well. All pairwise comparisons were tested for significance by Kruskall-Wallis 287
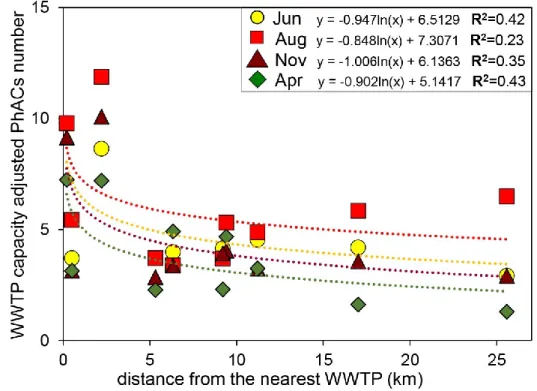
nonparametric tests. Regression analyses were made to reveal the role of WWTPs in the PhACs 288
pollution of the studied system. Numbers of the indicated PhACs per sites were presented as a 289
function of its distance from the nearest “upstream” WWTP which load empties into the 290
inflowing rivers or into the lake. In this case the WWTPs which loads are transferred beyond the 291
border of the watershed were not considered (Fig.1).
292
Hydrographic distances for each sample site from the nearest “upstream” WWTP, were 293
measured using Google Earth software (Gorelick et al., 2017). The coordinates, distances and 294
capacity of the nearest WWTPs are presented in Table S2. To decrease the effect of the 295
differences in WWTP capacities, the number of the indicated PhACs per site in each sample 296
period, were adjusted by the logarithm of capacity (m3/day) of the nearest WWTP. Additionally, 297
covariance analyses were made to test the equality and homogeneity of regression slopes. All 298
computations were executed using PAST statistical software (Hammer et al., 2001).
299
3. Results and discussion 300
3.1 Analytical processes 301
3.1.1 SPE optimisation 302
14
In this work, several sorbents were investigated, among them were polymer and silica- 303
based sorbents capable of non-polar and/or ion-exchange interactions (see section 2.3), with the 304
aim of achieving one sorbent extraction for all PhACs. The Strata X-CW was found to give the 305
highest recoveries for the majority of PhACs from those investigated. The Strata X-CW, as mixed 306
mode SPE, has lipophilic surface property like a generally used C18 sorbent, but it also has the 307
ability to bind the basic PhACs selectively due to its weak acidic character (Musile et al., 2018).
308
The acidic and neutral PhACs can be eluted selectively by organic solvents, meanwhile the basic 309
PhACs are retained. Finally, the elution of basic PhACs provides visibly cleaner extracts in 310
comparison to the phases with single interaction mode (Tolgyesi et al., 2018).
311
The optimal applied adsorbent amount to SPE was also tested because this parameter 312
seriously influences the final recoveries. If the used cartridge contains less adsorbent, the 313
overload is a real problem, but with use of internal standards, the lost amount can be controlled.
314
However, use of too high amount of adsorbent might lead to incomplete elution (Fontanals et al., 315
2017). Based on these data, 200 mg adsorbent was used considering that the type of matrix is 316
surface water.
317
Two wash steps were applied to remove matrix, provide cleaner extracts and improve 318
signal to noise ratio (S/N); firstly, acidified water followed by acidified ACN-water mixture. The 319
acidified water did not result in any loss of investigated PhACs. However, acidified ACN-water 320
mixture resulted in the breakthrough of less lipophilic compounds (e.g., levetiracetam, 321
amphetamine) and, subsequently, lower recoveries of these compounds. In spite of all this, due to 322
the significantly cleaner extracts provided by this second washing step, it was concluded that the 323
washing step should remain.
324
The use of mixed stationary phases and selective elutions phase by phase increased the 325
number of detectable PhACs and achieved the multi-residue analysis. The first step (organic 326
15
phase-ACN) ensured the selective elution of acidic and neutral compounds, including hormones, 327
which required further derivatisation. Consequently, the effectivity of derivatisation was 328
increased since the dansyl-chloride can also react with primary- and secondary-amine bases, 329
which are retained on the SPE column. The second step provided the appropriate elution of other 330
PhACs.
331
Deuterated and isotope labeled IS were added prior to SPE extraction in order to 332
minimalise the matrix effects and compensate for losses or enhancement of compounds during 333
the sample preparation procedure. The average absolute SPE recovery (to 5 ng/L spiked ultra- 334
high quality water) was 76.5%.
335
3.1.2 Quantification and method validation 336
Concentrations of compounds were calculated using the standard calibration curve for the 337
water spiked with compounds before extraction, which were constructed using a detector 338
response defined as the ratio of the peak ion (the specific product ion of the highest intensity as 339
qualifier ion) to the base peak ion of the related internal standard. The mean correlation 340
coefficient (R2) of the calibration curves was typically higher than 0.95 and showed linearity in 341
the range of 0.1–1000 ng/L for the majority of PhACs. The average method accuracy was 89.4%.
342
The method used achieved simultaneous quantitative analysis of 134 drugs, where the LOD and 343
LOQ values (Table S3) were 0.01–80.00 and 0.05–200.00 ng/L concentration range (mean 2.70 344
and 8.26 ng/L), respectively. In addition, the proposed analytical method offers rapid analysis 345
applying only one extraction with low limits of quantification, thus overcoming the drawbacks of 346
previously published procedures (Martin et al., 2011). Based on these data, the SPE-SFC-MS/MS 347
method was suitable to the multi-residue analysis of the freshwater samples.
348
3.2 Environmental application 349
16
The on-site measurements of hydrophysico-chemical parameters during the sample 350
collections did not show discrepancies from the seasonal averages (Table S1). Therefore, 351
considerable occasional local (sewage) pollution could not be detected on the sampled sites in the 352
sampling periods.
353
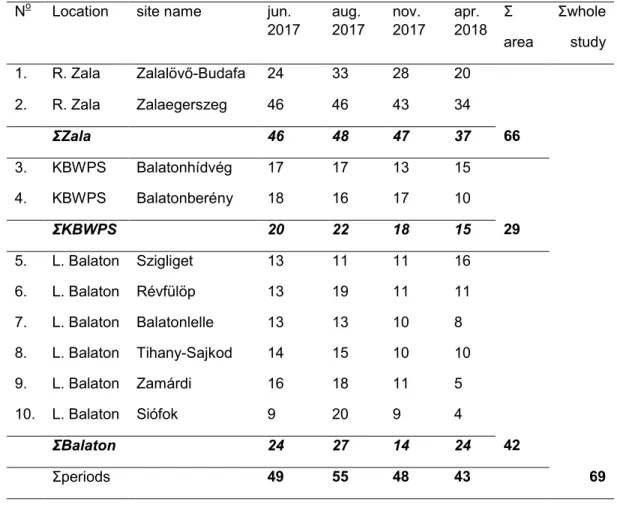
Altogether, 69 out of 134 PhACs were revealed from all samples (Table 1). In Fig. 2A, 354
the detected PhACs were ranked by their frequency of occurrence (FO). All detected PhACs, 355
according to their physiological effect, were grouped into 10 chemical classes. Cumulated values 356
of the classes were collected per sites on boxplots (Fig. S1) and the distribution of PhACs in the 357
classes per periods are presented on bar charts (Fig. 2B).
358
The number of PhACs per chemical class showed considerable differences.
359
Cardiovascular drugs showed the highest diversity (n=14), at the same time, only two NSAIDs 360
were detected (Table 1, Fig. 2B). According to the authors’ knowledge, 15 PhACs (lacosamide, 361
metoclopramide, procyclidine, buspirone, cinolazepam, practolol, propafenone, trimetazidine, 362
dibutylon, bupivacaine, tetracaine, ethylmorphine, 3-Cl-ephedrine, atropine, and atracurium) have 363
been described from natural waters for the first time from 69 detected PhACs (Table 1).
364
Out of the indicated pharmaceuticals only the antiepileptic carbamazepine (CBZ) (av.:
365
126.0 ng/L) appeared from all sites in each sampling period (FO: 100%). Besides the CBZ, there 366
were other five PhACs with FO beyond 95%. These most frequent pollutants were the 367
antiepileptic lamotrigine (FO: 98%, av.: 129.2 ng/L), the opioid tramadol (FO: 98%, av.: 31.8 368
ng/L), the antipsychotic tiapride (FO: 95%, av.: 65.5 ng/L), perindopril which is a cardiovascular 369
drug (FO: 95%, av.: 45.8 ng/L) and the hormone E1 (FO: 95%, av.: 1.8 ng/L). More than five 370
PhACs were detected in more than half of the samples, at the same time 11 pharmaceuticals were 371
indicated from only single samples. Our results did not show any trend in the FO of the different 372
chemical classes (Fig. 2A).
373
17
According to the published data, the CBZ is frequently recorded in high concentration in 374
several countries. In European surface waters: 75 and 294 ng/L in Austria, 70 and 370 ng/L in 375
Finland (Lindholm-Lehto et al., 2015; Vieno et al., 2006), 78 and 800 ng/L in France, 25 and 110 376
ng/L in Germany, and 30 and 150 ng/L in Switzerland; median and maximum concentration of 377
CBZ were measured, respectively (Ternes et al., 2004). Moreover, in river samples of the Baltic 378
Sea region, 138 ng/L mean CBZ was also found (UNESCO and HELCOM, 2017). A recent study 379
shows that CBZ is the most frequent PhAC in Turkish environmental samples (Guzel et al., 380
2018). The incomplete CBZ biodegradation and the insufficient capacity of soil microbes to 381
transform it might explain the persistent CBZ appearance in environmental waters (Martinez- 382
Hernandez et al., 2016). Lamotrigine also occurred frequently in South African surface water in 383
190 and 586 ng/L mean and maximum concentration, respectively (Wood et al., 2017).
384
Presumably, these contamination levels were provoked by persistent contaminations and 385
consumption habits of drug-users as well as intensive use and chronic administration.
386
Furthermore, the background of the persistent contaminations might be the high amount of drug 387
content per tablet (200–500 mg per tablets).
388
A further problem might be the low and variable elimination efficacy of WWTP. Gurke et 389
al (2015) notes lamotrigine is not eliminated, but concentrated in the studied WWTP, therefore, 390
its concentration was increased in its outflow (Gurke et al., 2015). The tramadol is also detected 391
in surface waters in some European countries, e.g., Estonia and Finland, and the highest tramadol 392
concentration (256 ng/L) was measured in river water (UNESCO and HELCOM, 2017). In 393
Germany, the concentrations of tramadol found in surface waters ranged from <LOQ to 381 ng/L 394
(Rua-Gomez and Puttmann, 2012). Presumably, these contamination levels were provoked by 395
persistent contaminations and low removal rates of WWTPs, which is approximately 3%
396
(UNESCO and HELCOM, 2017).
397
18
EU regulation put three estrogenic compounds (E1, E2 and EE2) on the WL of emerging 398
pollutants in 2013 (Directive 2013/39/EU); maximum acceptable LOD have been established for 399
them. These limits are 0.035 ng/L for EE2 and 0.4 ng/L for E1 and E2, which were also included 400
in the EU Commission Implementing Decision 2018/840. Our method (SPE-SFC-MS/MS) with 401
dansyl derivatisation is also appropriate (LOD 0.01 ng/L for E1, E2 and EE2) for monitoring 402
studies. The E1 shows the highest occurrence (97%) inside the hormones/hormone derivatives 403
group. The contamination levels of E2, EE2 and progestogens are similar to the earlier screening, 404
which partially investigates the catchment area of Lake Balaton (Avar et al., 2016a; Avar et al., 405
2016b).
406
As Fig. 3A indicates, the number of detected PhACs ranged between 4 and 46 per sample.
407
Their number was significantly highest on Site 2 (av.±SD: 44.3±5.7), followed by Site 1 (av.±SD:
408
26.3±5.6), which is also significantly different (p<0.05) from the other eight sampling sites (Fig.
409
3A). The highest number of PhACs (66) was detected in the Zala catchment, followed by the 410
Lake Balaton (42) and KBWPS sites (29) (Table 2). However, the mean number of detected 411
PhACs were highest in the Zala catchment (av.±SD: 34.3±10.0, min: 20, max: 46), while higher 412
values were detected in the KBWPS (av.±SD: 15.4±2.7, min: 10, max: 18) than in the lake 413
(av.±SD: 12.1±4.0, min: 4, max: 20) (Fig. 3B). These results indicate that the KBWPS receive 414
larger, but less variable, PhACs loads than the sites situated next to the lake. Furthermore, these 415
observations show that although the KBWPS receives the outflow water of several WWTPs (see:
416
Fig. 1), this wetland area not only reduces the macronutrient (N, P) load to the lake (Hatvani et 417
al., 2011; Kiedrzynska et al., 2008; Kovacs et al., 2011; Tatrai et al., 2000), but may play an 418
important role in the PhACs load management, as well. Many other works also suggest that 419
natural and artificial wetlands can be responsible for the decrease of PhACs contamination 420
(Auvinen et al., 2017; Breitholtz et al., 2012; Hijosa-Valsero et al., 2016; Li et al., 2014;
421
19
McEachran et al., 2018; Zhang et al., 2013). Presumably, the longer retention time (up to 30 422
days) and the relatively shallow water, which is favourable for the UV induced degradation 423
(Aullo-Maestro et al., 2017), and the elevated microbial activity could provide the similar 424
degradation of PhACs in the KBWPS. However, additional studies are needed to clearly explore 425
this observed effect in detail.
426
Not only the spatial, but the temporal distribution of the detected PhACs, showed a high 427
level of variation. The number of detected pharmaceuticals per sampling period fluctuated 428
between 43 and 55 (48.75±4.9). The average number of detected PhACs per site was significantly 429
(p<0.05) lower in the April 2018 time period than in August 2017 time period (Table 2 and Fig.
430
3C).
431
Although the result of the PCA analysis showed that most of the PhACs groups appeared 432
in highest concentrations at Site 2 (Fig. 3D), the PhACs composition showed a considerable level 433
of variation. On average, the persistence of the sample composition varied about 0.5–0.6, which 434
means that 50–60% of the detected PhACs were identical in two randomly chosen samples, 435
which originated from the same site. The highest average persistence level was indicated in Site 2 436
(0.594±0.1), where the highest number of PhACs were detected during our study. This result can 437
be attributed to the fact that this area has a large, and more or less permanent, population which 438
causes diverse, but more permanent PhACs loads into the recipient River Zala.
439
The two eastern-most sites showed the significantly lower persistence values (0.402±0.09 440
and 0.256±0.15, respectively) (Fig. 3E). These results can be explained by the fact that some 441
hallucinogens (e.g., ecgonine-methylester, MDMA) and some PhACs classified into the “Others”
442
group (e.g., ketamine, caffeine), appeared only in the summer (touristic season) period (Table S4, 443
Fig. 3D). And, whereas the wastewater of this area is collected and drained outside of the 444
catchment (Fig. 1), these PhACs are more likely to enter the pond by a direct load (urine and 445
20
waste) and/or the precipitation washes these components from the shoreline of the lake.
446
Therefore, in this case, the area is a summer holiday destination, so the elevated number and 447
concentration of mostly recreational substances (e.g., caffeine and illicit drugs) were indicated, 448
especially in the summer period at the shoreline of the lake. These assumptions are refined by the 449
results of regression and covariance analyses (Fig. 4). The adjusted number of PhACs per site 450
show decreasing trends away from the WWTPs in each sampling period. Results of covariance 451
analyses showed that no significant differences can be detected on the equality and homogeneity 452
of regression slopes for data from the four sampling periods (F=1.829, p=0.152, F=0.202 and 453
p=0.894, respectively). Therefore, it seems to be a permanent trend, which is only slightly 454
modified by the effect of tourism in the summer period. Our results indicate that the WWTPs may 455
be the most important sources of PhAC pollution in the studied water system. At the same time, 456
they show that through the periodically increased direct PhACs load, tourism may have a major 457
detectable impact effect on the quality of surface waters. Moreover, the shallow lakes, due to 458
their limited puffer capacity (caused by their low volume and the relatively long shoreline), seem 459
to be particularly at risk by PhACs exposure.
460
4. Conclusion 461
The new method was appropriate for simultaneous detection of multiple PhACs 462
characterised by highly different concentrations and chemical composition. Therefore, -the use of 463
mixed phase SPE makes the sample preparation easier and helps to reveal the effects of 464
contamination of PhACs in environmental samples. Results of our field investigations showed 465
that PhACs were detectable in each site, while their distribution and concentration represented 466
considerable spatiotemporal variations. On the sites characterised by permanent and dense 467
populations, PhACs used in human medicine (antiepileptics and cardiovascular drugs) dominated 468
the samples. While those sites exposed to mass tourism on average, recorded lower but more 469
21
variable PhACs contamination. Some significant seasonal outlier values of recreational 470
substances (e.g., caffeine and illicit drugs) were indicated in these sites, presumably due to their 471
direct load (e.g., urine) in the summer touristic period.
472
To summarise: the WWTP loads have a possible major role on the PhAC contamination 473
of the studied area. At the same time, the mass tourism induced PhAC contamination was also 474
detectable. Moreover, the interventions initially aimed to reduce the impact of macro-pollutants 475
(P, N) on the lake, but reduce its PhAC contamination in the recipient surface waters, as well.
476
Here we have to note, that via the sewage transfer duct system, the pollution is only shifted 477
through the border of the area to be protected. The optimal solution would be to improve the 478
PhACs elimination technology in the WWTPs in parallel with the application of quaternary 479
treatment on the effluent water, such as the retention of WWTP effluent in constructed wetlands 480
for a shorter period before release into natural surface waters.
481
Authors’ contribution 482
The study was design by MG, PZ and TP, and analytical methods were developed by MG, 483
MM and ZZ. The water collection was performed by MG and TP and the experimental work was 484
performed by ME, KM, FI. The manuscript was written by MG and TP with feedback from PZ.
485
Declaration of interest 486
The authors declare that there is no conflict of interest that could be perceived as 487
prejudicing the impartiality of the research reported.
488
Funding 489
This work was supported by PD-OTKA grants No. 124161 (MG), No. 115801(TP), National 490
Brain Project No. 2017-1.2.1-NKP-2017-00002 (PZ), Bolyai Foundation No. BO/00952/16/8 491
(PZ), BO/0022/18/8 (TP), Ministry of National Development and Lake Balaton Development 492
Council No. NFPF/248/2016-NFM_SZERZ.
493
22 494
23 References
495
Aullo-Maestro ME, Hunter P, Spyrakos E, Mercatoris P, Kovacs A, Horvath H, et al. 2017.
496
Spatio-seasonal variability of chromophoric dissolved organic matter absorption and 497
responses to photobleaching in a large shallow temperate lake. Biogeosci.; 14, 1215-1233.
498
https://doi.org/10.5194/bg-14-1215-2017.
499
Auvinen H, Havran I, Hubau L, Vanseveren L, Gebhardt W, Linnemann V, et al. 2017. Removal 500
of pharmaceuticals by a pilot aerated sub-surface flow constructed wetland treating 501
municipal and hospital wastewater. Ecol. Eng.. 100, 157-164.
502
http://hdl.handle.net/1854/LU-8503385.
503
Avar P, Maasz G, Takacs P, Lovas S, Zrinyi Z, Svigruha R, et al. 2016a. HPLC-MS/MS analysis 504
of steroid hormones in environmental water samples. Drug Test.Anal. 8, 124-128.
505
https://doi.org/10.1002/dta.1829.
506
Avar P, Zrinyi Z, Maasz G, Takatsy A, Lovas S, L GT, et al. 2016b. β-Estradiol and ethinyl- 507
estradiol contamination in the rivers of the Carpathian Basin. Environ. Sci. Pollut. Res.
508
Int. 23, 11630-8. https://doi.org/10.1007/s11356-016-6276-2.
509
Baker DR, Kasprzyk-Hordern B. 2011. Multi-residue analysis of drugs of abuse in wastewater 510
and surface water by solid-phase extraction and liquid chromatography-positive 511
electrospray ionisation tandem mass spectrometry. J. Chromatogr. A. 1218: 1620-1631.
512
https://doi.org/10.1016/j.chroma.2011.01.060.
513
Barakat A, El Baghdadi M, Rais J, Aghezzaf B, Slassi M. 2016. Assessment of spatial and 514
seasonal water quality variation of Oum Er Rbia River (Morocco) using multivariate 515
statistical techniques. Int. SoilWater Conser. Res. 4, 284-292.
516
https://doi.org/10.1016/j.iswcr.2016.11.002.
517
24
Bianchi F, Riboni N, Termopoli V, Mendez L, Medina I, Ilag L, et al. 2018. MS-Based 518
Analytical Techniques: Advances in Spray-Based Methods and EI-LC-MS Applications.
519
J. Anal. Methods Chem. https://doi.org/10.1155/2018/1308167.
520
Bojarczuk A, Jelonkiewicz L, Lenart-Boron A. 2018. The effect of anthropogenic and natural 521
factors on the prevalence of physicochemical parameters of water and bacterial water 522
quality indicators along the river Biaka, southern Poland. Environ. Sci. Pollut. Res. 25, 523
10102-10114. https://doi.org/10.1007/s11356-018-1212-2.
524
Breitholtz M, Naslund M, Strae D, Borg H, Grabic R, Fick J. 2012. An evaluation of free water 525
surface wetlands as tertiary sewage water treatment of micro-pollutants. Ecotoxicol.
526
Environ. Safety. 78, 63-71. https://doi.org/10.1016/j.ecoenv.2011.11.014.
527
Camacho-Munoz D, Kasprzyk-Hordern B, Thomas KV. 2016. Enantioselective simultaneous 528
analysis of selected pharmaceuticals in environmental samples by ultrahigh performance 529
supercritical fluid based chromatography tandem mass spectrometry. Anal. Chim. Acta.
530
934, 239-251. https://doi.org/10.1016/j.aca.2016.05.051.
531
Cantwell MG, Katz DR, Sullivan JC, Shapley D, Lipscomb J, Epstein J, et al. 2018. Spatial 532
patterns of pharmaceuticals and wastewater tracers in the Hudson River Estuary. Water 533
Res. 137, 335-343. https://doi.org/10.1016/j.watres.2017.12.044.
534
Carpenter CMG, Helbling DE. 2018. Widespread Micropollutant Monitoring in the Hudson River 535
Estuary Reveals Spatiotemporal Micropollutant Clusters and Their Sources. Environ. Sci.
536
Tech. 52, 6187-6196. https://doi.org/10.1021/acs.est.8b00945.
537
Chen XX, Dong FS, Xu J, Liu XG, Chen ZL, Liu N, et al. 2016. Enantioseparation and 538
determination of isofenphos-methyl enantiomers in wheat, corn, peanut and soil with 539
Supercritical fluid chromatography/tandem mass spectrometric method. J. Chromatogr. B- 540
25 Anal. Tech. Biomed. Life Sci. 1015, 13-21.
541
https://doi.org/10.1016/j.jchromb.2016.02.003.
542
Chen ZL, Dong FS, Li SS, Zheng ZT, Xu YW, Xu J, et al. 2015. Response surface methodology 543
for the enantioseparation of dinotefuran and its chiral metabolite in bee products and 544
environmental samples by supercritical fluid chromatography/tandem mass spectrometry.
545
J. Chromatogr. A. 1410, 181-189. https://doi.org/10.1016/j.chroma.2015.07.067.
546
Daughton CG, Ternes TA. 1999. Pharmaceuticals and personal care products in the environment:
547
Agents of subtle change? Environ. Health Perspect. 107, 907-938.
548
https://doi.org/10:.1289/ehp.99107s6907.
549
Dean JG, Bosqui FL, Lanouette KH. 1972. Removing heavy metals from waste water. Environ.
550
Sci. Technol. 6, 518-522. https://doi.org/10.1021/es60065a006.
551
Directive 2008/105/EC of the European Parliament and of the Council of 16 December 2008 on 552
environmental quality standards in the field of water policy, amending and subsequently 553
repealing Council Directives 82/176/EEC, 83/513/EEC, 84/156/EEC, 84/491/EEC, 554
86/280/EEC and amending Directive 2000/60/EC of the European Parliament and of the 555
Council. Special edition in Croatian: Chapter 15 Volume 006 P. 235 - 248. ELI:
556
http://data.europa.eu/eli/dir/2008/105/oj.
557
Directive 2013/39/EU: Directive 2013/39/EU of the European Parliament and of the Council of 558
12 August 2013 amending Directives 2000/60/EC and 2008/105/EC as regards priority 559
substances in the field of water policy Text with EEA relevance. ELI:
560
http://data.europa.eu/eli/dir/2013/39/oj.
561
EU Commission JRC 2015: Carvalho RN, Ceriani L, Ippolito A, Lettieri T. Development of the 562
first Watch List under the Environmental Quality Standards Directive, EUR 27142 EN, 563
26
Publications Office of the European Union, Luxembourg. https://doi.org/10.2788/101376, 564
JRC 95018.
565
EU Commission JRC 2018: Loos R, Marinov D, Sanseverino I, Napierska D, Lettieri T. Review 566
of the 1st Watch List under the Water Framework Directive and recommendations for the 567
2nd Watch List, EUR 29173 EN, Publications Office of the European Union, 568
Luxembourg. https://doi.org/10.2760/614367, JRC111198.
569
EU Commission Implementing Decision 2018/840: Commission Implementing Decision (EU) 570
2018/840 of 5 June 2018 establishing a watch list of substances for Union-wide 571
monitoring in the field of water policy pursuant to Directive 2008/105/EC of the European 572
Parliament and of the Council and repealing Commission Implementing Decision (EU) 573
2015/495 (notified under document C(2018) 3362). ELI:
574
http://data.europa.eu/eli/dec_impl/2018/840/oj.
575
Fontanals N, Marce RM, Borrull F. 2017. Solid-phase extraction followed by liquid 576
chromatography-high resolution mass spectrometry to determine synthetic cathinones in 577
different types of environmental water samples. J. Chromatogr. A. 1524, 66-73.
578
https://doi.org/10.1016/j.chroma.2017.10.002.
579
Fujito Y, Hayakawa Y, Izumi Y, Bamba T. 2017. Importance of optimizing chromatographic 580
conditions and mass spectrometric parameters for supercritical fluid 581
chromatography/mass spectrometry. J. Chromatogr. A. 1508, 138-147.
582
https://doi.org/10.1016/j.chroma.2017.05.071.
583
Goel PK. 2006. Water pollution: causes, effects and control. New Age Int. 418 p.
584
Gomez MJ, Bueno MJM, Lacorte S, Fernandez-Alba AR, Aguera A. 2007. Pilot survey 585
monitoring pharmaceuticals and related compounds in a sewage treatment plant located 586
27
on the Mediterranean coast. J. Chemosphere. 66, 993-1002.
587
https://doi.org/10.1016/j.chemosphere.2006.07.051.
588
Gonzalez-Alonso S, Merino LM, Esteban S, Lopez de Alda M, Barcelo D, Jose Duran J, et al.
589
2017. Occurrence of pharmaceutical, recreational and psychotropic drug residues in 590
surface water on the northern Antarctic Peninsula region. Environ. Pollut. 229, 241-254.
591
https://doi.org/10.1016/j.envpol.2017.05.060.
592
Gorelick N, Hancher M, Dixon M, Ilyushchenko S, Thau D, Moore R. 2017. Google Earth 593
Engine: Planetary-scale geospatial analysis for everyone. Rem. Sens. Environ. 202, 18-27.
594
https://doi.org/10.1016/j.rse.2017.06.031.
595
Gossling S, Peeters P, Hall CM, Ceron J-P, Dubois G, Lehmann LV, et al. 2012. Tourism and 596
water use: Supply, demand, and security. An international review. Tour. Manag. 33, 1-15.
597
https://doi.org/10.1016/j.tourman.2011.03.015.
598
Granby K, Andersen JH, Christensen HB. 2004. Analysis of pesticides in fruit, vegetables and 599
cereals using methanolic extraction and detection by liquid chromatography-tandem mass 600
spectrometry. Anal. Chim. Acta. 520, 165-176. https://doi.org/10.1016/j.aca.2004.05.088.
601
Gurke R, Rossler M, Marx C, Diamond S, Schubert S, Oertel R, et al. 2015. Occurrence and 602
removal of frequently prescribed pharmaceuticals and corresponding metabolites in 603
wastewater of a sewage treatment plant. Sci. Total Environ. 532, 762-770.
604
https://doi.org/10.1016/j.scitotenv.2015.06.067.
605
Guzel EY, Cevik F, Daglioglu N. 2018. Determination of pharmaceutical active compounds in 606
Ceyhan River, Turkey: Seasonal, spatial variations and environmental risk assessment.
607
Hum. Ecol. Risk Assess.Int. J. 1-16. https://doi.org/10.1080/10807039.2018.1479631.
608
28
Hadwen WL, Bunn SE, Arthington AH, Mosisch TD. 2005. Within-lake detection of the effects 609
of tourist activities in the littoral zone of oligotrophic dune lakes. Aquat. Ecosyst. Health 610
Manag. 8, 159-173. https://doi.org/10.1080/14634980590953211.
611
Hammer Ø, Harper DAT, Ryan PD. 2001. "PAST: Palaeontological statistics, ver. 1.89."
612
Palaeontol electron 4, no. 1 Paleontological Statistics Software Package for Education and 613
Data Analysis. Palaeontol. Electron. 4, 1-9.
614
Hatvani I, Clement A, Kovács J, Székely Kovács I, Korponai J. 2014. Assessing water-quality 615
data: The relationship between the water quality amelioration of Lake Balaton and the 616
construction of its mitigation wetland. J. Great Lakes Res. 40, 2014.
617
https://doi.org/10.1016/j.jglr.2013.12.010.
618
Hatvani IG, Kovacs J, Kovacs IS, Jakusch P, Korponai J. 2011. Analysis of long-term water 619
quality changes in the Kis-Balaton Water Protection System with time series-, cluster 620
analysis and Wilks' lambda distribution. Ecol. Eng. 37, 629-635.
621
https://doi.org/10.1016/j.ecoleng.2010.12.028.
622
Hernandez F, Portoles T, Pitarch E, Lopez FJ. 2011. Gas chromatography coupled to high- 623
resolution time-of-flight mass spectrometry to analyze trace-level organic compounds in 624
the environment, food safety and toxicology. Trac-Trends Anal. Chem. 30, 388-400.
625
https://doi.org/10.1016/j.trac.2010.11.007.
626
Hijosa-Valsero M, Reyes-Contreras C, Dominguez C, Becares E, Bayona JM. 2016. Behaviour of 627
pharmaceuticals and personal care products in constructed wetland compartments:
628
Influent, effluent, pore water, substrate and plant roots. J. Chemosphere. 145, 508-517.
629
https://doi.org/10.1016/j.chemosphere.2015.11.090.
630
29
Horvath Z. 2011. The economic impacts of conference tourism in Siofok, the “capital” of Lake 631
Balaton. GeoJ. Tour. Geosites. 7, 75-86. http://gtg.webhost.uoradea.ro/PDF/GTG-1- 632
2011/7_74_ZoltanHORVATH.pdf.
633
Istvanovics V, Honti M, Kovacs A, Osztoics A. 2008. Distribution of submerged macrophytes 634
along environmental gradients in large, shallow Lake Balaton (Hungary). Aquat. Bot.. 88, 635
317-330. https://doi.org/10.1016/j.aquabot.2007.12.008.
636
Istvánovics V, Clement A, Somlyódy L, Specziár A, G.-Tóth L, Padisák J. 2007. Updating water 637
quality targets for shallow Lake Balaton (Hungary), recovering from eutrophication.
638
Hydrobiol. 581, 305-318. https://doi.org/10.1007/s10750-006-0509-1.
639
Kamel A. 2010. Refined Methodology for the Determination of Neon icotinoid Pesticides and 640
Their Metabolites in Honey Bees and Bee Products by Liquid Chromatography-Tandem 641
Mass Spectrometry (LC-MS/MS). J. Agric. Food Chem. 58, 5926-5931.
642
https://doi.org/10.1021/jf904120n.
643
Kasprzyk-Hordern B. 2010. Pharmacologically active compounds in the environment and their 644
chirality. Chem. Soc. Rev. 39, 4466-4503. https://doi.org/10.1039/C000408C.
645
Katircioglu ST. 2014. International tourism, energy consumption, and environmental pollution:
646
The case of Turkey. Renew. Sustain. Energy Rev. 36, 180-187.
647
https://doi.org/10.1016/j.rser.2014.04.058.
648
Kiedrzynska E, Wagner I, Zalewski M. 2008. Quantification of phosphorus retention efficiency 649
by floodplain vegetation and a management strategy for a eutrophic reservoir restoration.
650
Ecol. Eng. 33, 15-25. https://doi.org/10.1016/j.ecoleng.2007.10.010.
651
Kolpin DW, Furlong ET, Meyer MT, Thurman EM, Zaugg SD, Barber LB, et al. 2002.
652
Pharmaceuticals, hormones, and other organic wastewater contaminants in US streams, 653
30
1999-2000: A national reconnaissance. Environ. Sci. Technol. 36, 1202-1211.
654
https://pubs.acs.org/doi/abs/10.1021/es011055j.
655
Kovacs J, Hatvani IG, Korponai J, Kovacs IS. 2011. Morlet wavelet and autocorrelation analysis 656
of long-term data series of the Kis-Balaton water protection system (KBWPS). Ecol. Eng.
657
37, 1438-1440. https://doi.org/10.1016/j.ecoleng.2010.06.028 658
Lenart-Boron A, Wolanin AA, Jelonkiewicz L, Zelazny M. 2016. Factors and Mechanisms 659
Affecting Seasonal Changes in the Prevalence of Microbiological Indicators of Water 660
Quality and Nutrient Concentrations in Waters of the Bialka River Catchment, Southern 661
Poland. Water Air Soil Pollut. 227:302. https://doi.org/10.1007/s11270-016-2931-y.
662
Li Y, Zhu G, Ng WJ, Tan SK. 2014. A review on removing pharmaceutical contaminants from 663
wastewater by constructed wetlands: Design, performance and mechanism. Sci. Total 664
Environ. 468, 908-932. https://doi.org/10.1016/j.scitotenv.2013.09.018.
665
Lindholm-Lehto PC, Ahkola HSJ, Knuutinen JS, Herve SH. 2015. Occurrence of 666
pharmaceuticals in municipal wastewater, in the recipient water, and sedimented particles 667
of northern Lake Päijänne. Environ. Sci. Pollut. Res. 22, 17209–17223. https://doi.org/
668
10.1007/s11356-015-4908-6.
669
Mandaric L, Diamantini E, Stella E, Cano-Paoli K, Valle-Sistac J, Molins-Delgado D, et al. 2017.
670
Contamination sources and distribution patterns of pharmaceuticals and personal care 671
products in Alpine rivers strongly affected by tourism. Sci.Total Environ. 590, 484-494.
672
https://doi.org/10.1016/j.scitotenv.2017.02.185.
673
Martin J, Buchberger W, Alonso E, Himmelsbach M, Aparicio I. 2011. Comparison of different 674
extraction methods for the determination of statin drugs in wastewater and river water by 675
HPLC/Q-TOF-MS. Talanta. 85. 2011 Elsevier B.V, Netherlands., pp. 607-615.
676
https://doi.org/10.1016/j.talanta.2011.04.017.
677
31
Martinez-Hernandez V, Meffe R, Herrera Lopez S, de Bustamante I. 2016. The role of sorption 678
and biodegradation in the removal of acetaminophen, carbamazepine, caffeine, naproxen 679
and sulfamethoxazole during soil contact: A kinetics study. Sci.Total Environ. 559, 232- 680
241. https://doi.org/10.1016/j.scitotenv.2016.03.131.
681
McEachran AD, Hedgespeth ML, Newton SR, McMahen R, Strynar M, Shea D, et al. 2018.
682
Comparison of emerging contaminants in receiving waters downstream of a conventional 683
wastewater treatment plant and a forest-water reuse system. Environ. Sci. Pollut. Res. 25, 684
12451-12463. https://doi.org/10.1007/s11356-018-1505-5.
685
Mihalic T. 2000. Environmental management of a tourist destination: A factor of tourism 686
competitiveness. Tour. Manag. 21, 65-78. https://doi.org/10.1016/S0261-5177(99)00096- 687
5.
688
Musile G, Cenci L, Piletska E, Gottardo R, Bossi AM, Bortolotti F. 2018. Development of an in- 689
house mixed-mode solid-phase extraction for the determination of 16 basic drugs in urine 690
by High Performance Liquid Chromatography-Ion Trap Mass Spectrometry. J.
691
Chromatogr. A. 1560, 10-18. https://doi.org/10.1016/j.chroma.2018.05.019.
692
Musolff A, Leschik S, Moeder M, Strauch G, Reinstorf F, Schirmer M. 2009. Temporal and 693
spatial patterns of micropollutants in urban receiving waters. Environ. Pollut. 157, 3069- 694
3077. https://doi.org/10.1016/j.envpol.2009.05.037.
695
Nguyen HL, Leermakers M, Osan J, Torok S, Baeyens W. 2005. Heavy metals in Lake Balaton:
696
water column, suspended matter, sediment and biota. Sci. Total Environ. 340, 213-230.
697
https://doi.org/10.1016/j.scitotenv.2004.07.032.
698
Palffy K, Presing M, Voeroes L. 2013. Diversity patterns of trait-based phytoplankton functional 699
groups in two basins of a large, shallow lake (Lake Balaton, Hungary) with different 700
trophic state. Aquat. Ecol. 47, 195-210. https://doi.org/10.1007/s10452-013-9434-3.
701
32
Postigo C, Lopez de Alda MJ, Barcelo D. 2010. Drugs of abuse and their metabolites in the Ebro 702
River basin: Occurrence in sewage and surface water, sewage treatment plants removal 703
efficiency, and collective drug usage estimation. Environ. Int. 36, 75-84.
704
https://doi.org/10.1016/j.envint.2009.10.004.
705
Puczkó L, Rátz T. 2000. Tourist and Resident Perceptions of the Physical Impacts of Tourism at 706
Lake Balaton, Hungary: Issues for Sustainable Tourism Management. J. Sustain. Tour. 8, 707
458-478. https://doi.org/10.1080/09669580008667380.
708
Roberts PH, Thomas KV. 2006. The occurrence of selected pharmaceuticals in wastewater 709
effluent and surface waters of the lower Tyne catchment. Sci.Total Environ. 356, 143-153.
710
https://doi.org/10.1016/j.scitotenv.2005.04.031.
711
Rua-Gomez PC, Puttmann W. 2012. Impact of wastewater treatment plant discharge of lidocaine, 712
tramadol, venlafaxine and their metabolites on the quality of surface waters and 713
groundwater. J. Environ. Monit. 14, 1391-1139. https://doi.org/10.1039/c2em10950f.
714
Silva LJG, Lino CM, Meisel LM, Pena A. 2012. Selective serotonin re-uptake inhibitors (SSRIs) 715
in the aquatic environment: An ecopharmacovigilance approach. Sci.Total Environ. 437, 716
185-195. https://doi.org/10.1016/j.scitotenv.2012.08.021.
717
Sipkay C, Hufnagel L, Révész A, Petrányi G. 2007. Seasonal dynamics of an aquatic 718
macroinvertebrate assembly (Hydrobiological case study of Lake Balaton No. 2). Appl.
719
Ecol. Environ. Res. 5, 63-78. https://doi.org/10.15666/aeer/0502_063078.
720
Specziar A, Eros T, Gyorgy AI, Tatrai I, Biro P. 2009. A comparison between the benthic Nordic 721
gillnet and whole water column gillnet for characterizing fish assemblages in the shallow 722
Lake Balaton. Annales De Limnologie-Int. J. Lim. 45, 171-180.
723
https://doi.org/10.1051/limn/2009016.
724
33
Tao Y, Zheng ZT, Yu Y, Xu J, Liu XG, Wu XH, et al. 2018. Supercritical fluid 725
chromatography-tandem mass spectrometry-assisted methodology for rapid 726
enantiomeric analysis of fenbuconazole and its chiral metabolites in fruits, vegetables, 727
cereals, and soil. Food Chem. 241, 32-39.
728
https://doi.org/10.1016/j.foodchem.2017.08.038.
729
Tatrai I, Matyas K, Korponai J, Paulovits G, Pomogyi P. 2000. The role of the Kis-Balaton Water 730
Protection System in the control of water quality of Lake Balaton. Ecol. Eng. 16, 73-78.
731
https://doi.org/10.1007/978-1-4020-4410-6_222.
732
Ternes TA, Janex-Habibi ML, Knacker T, Kreuzinger N, Siegrist H. 2004. Assessment of 733
technologies for the removal of pharmaceuticals and personal care products in sewage and 734
drinking water facilities to improve the indirect potable water reuse (POSEIDON).
735
Contract No. EVK1-CT-2000-00047. https://doi.org/:1.1.2001-30.6.2004.
736
Tolgyesi A, Giri A, Barta E, McDonald TJ, Sharma VK. 2018. Determination of Thyreostats in 737
Urine Using Supported Liquid Extraction and Mixed-Mode Cation-Exchange Solid-Phase 738
Extraction: Screening and Confirmatory Methods. J. Chromatogr. Sci. 56, 858-866.
739
https://doi.org/10.1093/chromsci/bmy054.
740
UNESCO and HELCOM. 2017. Pharmaceuticals in the aquatic environment of the Baltic Sea 741
region – A status report 2017; UNESCO Emerging Pollutants in Water Series – No. 1, 742
Baltic Sea Environments Proceedings No. 149. UNESCO Publishing, Paris.
743
Vega M, Pardo R, Barrado E, Debán L. 1998. Assessment of seasonal and polluting effects on the 744
quality of river water by exploratory data analysis. Water Res. 32, 3581-3592.
745
https://doi.org/10.1016/S0043-1354(98)00138-9.
746
Vieno NM, Tuhkanen T, Kronberg L. 2006. Analysis of neutral and basic pharmaceuticals in 747
sewage treatment plants and in recipient rivers using solid phase extraction and liquid 748
34
chromatography–tandem mass spectrometry detection. J. Chromatogr. A. 1134, 101-111.
749
https://doi.org/10.1016/j.chroma.2006.08.077.
750
Wood TP, Du Preez C, Steenkamp A, Duvenage C, Rohwer ER. 2017. Database-driven screening 751
of South African surface water and the targeted detection of pharmaceuticals using liquid 752
chromatography - High resolution mass spectrometry. Environ. Pollut. 230, 453-462.
753
https://doi.org/10.1016/j.envpol.2017.06.043.
754
Zhang DQ, Gersberg RM, Hua T, Zhu JF, Goyal MK, Ng WJ, et al. 2013. Fate of pharmaceutical 755
compounds in hydroponic mesocosms planted with Scirpus validus. Environ. Pollut. 181, 756
98-106. https://doi.org/10.1016/j.envpol.2013.06.016.
757
URL1: http://www.balatonregion.hu/en/lake-balaton-resort-area 758
URL2: https://www.vizugy.hu/?mapModule=OpGrafikon&AllomasVOA=164962F2-97AB- 759
11D4-BB62-00508BA24287&mapData=Idosor#mapModule 760
761
35 Figures and figure legends
762
763
Fig. 1. Distribution of the ten sampling sites in the studied drainage system (A). Black solid line 764
is the border of the Balaton catchment. Numbered rectangles identify sampling sites. Brown 765
circles in different sizes and colours show WWTPs with different capacities. Red line is sewage 766
transfer duct system. Red arrows show the direction of wastewater disposal. Geographic position 767
of Hungary in Europe and the Balaton catchment’s position in Hungary are indicated in the 768
inserts B and C, respectively.
769
36 770
Fig. 2. Frequency of occurrences (A) and mean concentrations (B) of the 69 recorded PhACs. In 771
the latter case, PhACs were classified into 10 chemical classes, and the 2-3 most characteristic 772
drugs were named per class (B).
773