ACTIVITY DENSITY OF CARABID BEETLES ALONG AN URBANISATION GRADIENT
Simone Fattorini1,*, Cristina Mantoni1, Davide Bergamaschi2, Lorenzo Fortini3 Francisco J. Sánchez3, Letizia Di Biase1 and Andrea Di Giulio3
1Department of Life, Health and Environmental Sciences, University of L’Aquila Via Vetoio, 67100, Coppito, L’Aquila, Italy
E-mails: simone.fattorini@univaq.it; https://orcid.org/0000-0002-4517-2135 cristina.mantoni@graduate.univaq.it; https://orcid.org/0000-0002-1981-0842
letizia.dibiase@graduate.univaq.it; https://orcid.org/0000-0001-5675-2904
2Department of Entomology, University of Arizona, Tucson, Arizona, USA E-mail: davbergamaschi@email.arizona.edu; https://orcid.org/0000-0001-8903-5151
3Department of Science, University of Roma Tre, Viale G. Marconi 446, 00146, Roma, Italy E-mails: lorenzo_fortini@alice.it; https://orcid.org/0000-0003-3324-9278
28csjf@gmail.com; https://orcid.org/0000-0003-2242-8641 andrea.digiulio@uniroma3.it; https://orcid.org/0000-0003-0508-0751
Several works have investigated the impact of urbanisation on carabid activity density using urban-rural gradients. Such works compared activity density recorded from green spaces located in different parts of a city and assigned to categories of increasing urban intensity, which poses two problems: (1) since the gradient is divided into categories, it is impossible to model continuous variations in biotic responses, and (2) sites representative of different urbanisation levels are not true segments of the same ecological continuum. To surpass these problems, we modelled variations in carabid activity density along an urban- rural transect within a single green space extending from the city centre of Rome to rural environments. Carabids were sampled by pitfall traps from sites distributed along the en- tire gradient. We used breakpoint regressions to model how (1) carabid activity density, (2) carabids/beetles ratio, (3) carabids/insects ratio and (3) carabids/arthropods ratio varied along the gradient. As already observed for various organisms in urban environments, we found that activity density of carabids and their contribution to the abundance of beetles, insects and arthropods, peaked in the middle of the gradient. This supports the intermedi- ate disturbance hypothesis, according to which moderate urbanisation may favour diver- sity by increasing habitat heterogeneity.
Keywords: Coleoptera, Carabidae, abundance, urban-rural gradient, urban ecology, Italy.
INTRODUCTION
Increasing urbanisation is considered a major threat to biodiversity (Mc-
Kinney 2002, 2006, McDonald et al. 2013). On the other hand, urban areas
offer many opportunities for biodiversity conservation. First, the high human
density in urban areas allows a reduction of anthropogenic pressures on natu-
ral ecosystems and improves the efficiency of resources uses (Worldwatch
Institute 2007, McDonald et al. 2013), making urban areas ‘‘our last best hope
for a sustainable future’’ (Eldredge & Horenstein 2014). Second, the presence of green spaces within cities may play important roles for the conservation of many species, including threatened ones (Angold et al. 2006, Jones & Leather 2012, Adler & Tanner 2013, Forman 2014, Fattorini & Galassi 2016). Ani- mal and plant responses to urbanisation are, however, extremely variable:
some taxa are negatively affected, others are favoured (McKinney 2008, Fat- torini 2011, 2019).
Among invertebrates, carabid beetles (Coleoptera Carabidae) are one of the best-investigated groups in urban ecology (Niemelä & Kötze 2009, Jones
& Leather 2012, New 2015). Most research has been focused on the response of carabids to increasing urbanisation by referring to the concept of the urban- rural gradient. In most cities, urbanisation intensity tends to decrease from the city centre to the most peripheral areas (McKinney 2008, Forman 2014).
Thus, ‘distance from city centre’ is the most commonly used measure for expressing the gradient and selecting sampling stations along with it (New 2015). This spatial gradient is associated with variation in many abiotic and biotic factors, such as human population density, housing density, proportion of impervious surfaces, soil compaction, proportion of natural areas, atmos- pheric pollution, temperatures, incidence of native species, incidence of alien species, etc. (McDonnell & Hahs 2008, Fattorini 2019). Research on the in- fluence of urbanisation on carabid communities has been mostly focused on variation in species richness and population abundances along the gradient (Niemelä & Kötze 2009, Jones and Leather 2012, New 2015). Since carabids are usually sampled using pitfall traps, which collect surface-active ground- dwelling animals, the number of collected individuals is in fact a function of both true population density and carabid movement on the soil surface. Thus, most research on carabid ecology uses measures of activity density to express how carabids respond to changes in environmental characteristics (French et al. 2001, Purtauf et al. 2005, Lafage et al. 2014).
Variation in carabid activity density along the urban-rural gradient may
follow different patterns. The most commonly observed pattern seems to be
an increase in activity density from the most urbanised areas to the rural ar-
eas, which is consistent with the idea that urbanisation has negative effects
on most species (Niemelä et al. 2002, New 2015). However, a hump-shaped
pattern, with the activity density peaking at the middle of the gradient, is also
common (Niemelä & Kötze 2009). This pattern can be interpreted in the con-
text of the ‘intermediate disturbance hypothesis’ (Connell 1978), in the form
of the disturbance heterogeneity model (Porter et al. 2001), since an interme-
diate urbanisation might increase habitat heterogeneity and hence resources
diversity and abundance (Fattorini 2019). A decrease in activity density from
the most to least urbanised areas seems an uncommon situation (Niemelä &
Kötze 2009) and might be due to the strong impact of the most tolerant spe- cies (Fattorini 2019).
Available studies on carabid responses to the urban-rural gradient typi- cally compared values of activity density recorded from different green spaces assigned to different classes of increasing urban intensity, usually indicated as “urban”, “suburban”, and “rural” (Niemelä & Kötze 2009, New 2015). This approach has two important limits. First, the gradient is divided into catego- ries and, therefore, it is impossible to model patterns of continuous variation along the gradient. Second, because the green spaces selected as representa- tive of the different levels of urbanisation are located in different parts of the city, they are not true segments of the same ecological continuum but may reflect a variety of conditions that cannot be subsumed by a hypothetically unique gradient.
Rome (Italy) is a large city with an ancient history of urbanisation, yet approximately half of its area is occupied by green spaces of various size and characterised by different ecological setting and forms of management. Some of the largest green spaces are remnants of the former rural ecomosaic known as “campagna romana”, a landscape of unrivalled historical and cultural importance (Celesti Grapow & Fanelli 1993, Lucchese & Pignatti 2009).
Among them, particularly important is the “Parco Regionale dell’Appia An- tica” (Appian Way Regional Park), the largest green space in Rome, extending from the city centre (where most of the park is embedded in a densely built-up matrix) to the borders of the city (where the park enters into the “campagna romana” rural landscape). This peculiar situation offers the intriguing oppor- tunity of investigating an urban-rural gradient within a single green space, thus surpassing the problems mentioned above associated with the use of different green spaces. For this reason, we started a research project using this green space to study how carabids respond to the urban-rural gradient. To the best of our knowledge, our research is the first that considered an urban-rural gradient within a single green space. In particular, in the present paper, we investigated how total carabid activity density varies along the urban-rural gradient. We also investigated spatial variations in the contribution of carabid abundance to the beetle, insect and arthropod communities along the gradient.
METHODS Study area
With about 3 million inhabitants, Rome is the largest Italian city and ranks third among those of the European Union, after Berlin and Madrid. Urban Rome is usually de- fined as the territory of the city encompassed by the great motorway ring (Grande Rac- cordo Anulare, GRA) that circumscribes an area of about 360 km2 (see Fattorini 2011,
Di Pietro et al. 2020). The Appia Antica Regional Park (41° 50’ 00” N – 12° 33’ 00” E) is a protected area of about 4,580 hectares, extending from the city centre of Rome to the neighbouring rural areas of Colli Albani (Fig. 1). The protected area includes archaeologi- cal zones along the ancient Appian Way, from the centre of Rome to the 10th Mile, includ- ing the Villa of the Quintilii and the Tombs of Via Latina. The park also includes two other smaller protected areas, the Caffarella Park and the Park of the Aqueducts.
The Appia Antica Regional Park includes a mosaic of cultivated fields and unculti- vated areas with different degrees of naturalness. The landscape is dominated by meadows and, to a lesser extent, by scrublands. Vegetation is mainly represented by the Mediterra- nean maquis (with Pistacia lentiscus, Rhamnus alaternus, and Euonimus europaeus). Due to the millenary human presence, ruderal species (such as Sonchus asper, Pteridium aquilinus, and Cymbalaria muralis), as well as cultivated species (especially Olea europaea and Prunus dulcis), are widespread. The area also incorporates fragments of wet meadows and ponds, and, along with watercourses, strips of riparian vegetation with poplars (Populus nigra), willows (Salix alba), and field elms (Ulmus minor). Detailed information on the vegetation of the study area can be found in Buccomino and Stanisci (2000) and Ceschin et al. (2006).
Carabid sampling
Within the study area, we designed a transect of about 8 km. Along the transect, we identified 9 sampling points at increasing distance from the city centre (Fig. 1): the closest site was at about 5.5 km from the city centre and was surrounded mainly by built-up areas (mini- mum distance from buildings: 300 m), the farthest site was at about 12 km, and it is near the GRA, i.e. at the borders of the city. A minimum distance of 500 m separated sampling sites.
Pitfall traps consisted of clear plastic cups (diameter: 9.5 cm, depth: 15 cm) sunk in the ground with the cup-lip level with the soil surface and covered by sloped stones to limit the rainwater influx and capture of non-target taxa. Covering stones were elevated 5–7 cm above the ground using four smaller stones at their corners. Each trap was filled with 250 mL of beer with salt, with a drop of unscented detergent to break the surface ten- sion. The number of pitfall traps varied among sites, from a mini- mum of 3 traps to a maximum of 16 Fig. 1. Map of urban Rome with lo- cation of the study area (the Appia Antica Regional Park, dashed area) and sampling sites (numbers: 1–9).
Map based on the Humanitarian layer of OpenStreetMap (© Open- StreetMap contributors): https://
www.openstreetmap.org/copy- right/en
traps, depending on site habitat heterogeneity. Moreover, the number of available traps per site varied because of trap damage and trap loss. Traps within sites were placed at ran- dom and separated by at least 10 meters from each other, to ensure independent sampling (Niemelä & Kötze 2009).
Sampling was conducted in four autumn sampling periods (from 18th October to 6th December) and four spring sampling periods (from 7th May to 24th June). Each sampling period lasted about ten days. We used this temporal distribution of sampling periods at the turn of two consecutive years because Mediterranean spring climatic conditions and hence biotic responses, recorded in a given spring-summer, are strongly influenced by those of the previous autumn-winter (Fanfani et al. 2014). Moreover, this sampling strategy al- lowed the estimation of activity density that included both autumn and spring breeders (see Paarman 1970, Hůrka 1986, Den Boer & Den Boer-Daanje 1990, Brandmayr et al.
2005). For each trapping period, traps were active for a minimum of 7 days to a maximum of 12. Variation in trapping duration and time between trapping sessions was due to un- stable weather conditions. Upon collection, trap content was rinsed with water and stored in vials with 70% ethanol.
Data analysis
Because the number of active traps and time of their functioning varied among sites and sampling periods, we standardised carabid abundance as activity density (AD). AD was calculated as the number of collected carabids divided by the sampling effort, ex- pressed as the number of traps × number of days/10 (Pizzolotto et al. 2018). For each site, we calculated the carabid activity density for the two sampling periods separately (autumn and spring AD values) and combined (total AD).
We also calculated, for each site and sampling period, the following proportions (percentages) to express the relative contribution of carabids to the local abundance of soil surface-active animals: CARCOL = Number of Carabidae/Total number of Coleop- tera; CARINS = Number of Carabidae/Total number of Insecta; CARART = Number of Carabidae/Total number of Arthropoda. Although pitfall traps might be less efficient for arthropods different from carabids, these values can be considered as rough estimates of the contribution of carabid activity density to the overall activity density of soil dwelling animals that, at each taxonomic level, have similar behaviours.
To test if AD values had similar spatial variations between seasons, we correlated site AD values recorded from the two periods by using a Spearman rank correlation coef- ficient. The same approach was used to test if values of CARCOL, CARINS and CARART showed similar patterns between seasons.
To test if average (median) carabid AD values varied between seasons, we compared the average (median) AD values from the two sampling periods by using Wilcoxon tests for paired samples. The same approach was used to test if average (median) CARCOL, CARINS and CARART values varied between periods.
To model how activity density varied along the urban-rural gradient, we calculated the distance of each sampling site from the city centre. “Distance from city centre” is a com- mon parameter of defining gradients or selecting sampling stations along with them when taken to correspond with the degree of urbanisation (New 2015). Namely, we measured the distance of each pitfall trap from the city centre and then calculated the average distance of the pitfall traps belonging to the same site as the “site distance” (D). Distances were
measured from Piazza Barberini, which is in- dicated as a geographic centroid of the urban area enclosed in the GRA (Salvati et al.
2016, 2019).
After visual in- spection revealing a mid-distance peak, vari- ation of AD along the urban-rural gradient was modelled using a breakpoint regression approach. In the break- point regression (also known as segmented regression), the inde- pendent variable is par- titioned into intervals, and a separate line seg- ment is fit to each inter- val. The boundaries be- tween the segments are breakpoints. Following this approach, we ap- plied a discontinuous model, which combines two linear relationships into a single equation:
AD = (b0 + b1 × D) × (D
≤ B) + (b3 + b2 × D) × (D
> B)
where AD and D are activity density and distance from the city centre, respectively; b0, b1, b2, and b3 are esti- mated parameters; B is the distance breakpoint, and (D ≤ B) and (D >
B) are logical variables that return 1 or 0 if true or false, respectively.
The parameters were estimated by using the Gauss-Newton algo- Table 1. Values of activity density (AD) and ratios of carabid beetles to total number of individual beetles (CARCOL), insects (CARINS), and arthropods (CARART) calculated for sites at different distance (km) from the city centre of Rome (Italy) within an urban park in autumn and spring. AutumnSpring SiteDistance ADCARCOLCARINCARARTADCARCOLCARINSCARART 1 5.4022.2805.6063.3431.9481.74410.7942.6791.574 2 5.7560.0360.3910.1500.0840.2131.3450.3290.235 3 6.1211.2927.5112.6061.3300.9524.5941.4340.762 4 6.8847.08331.19313.7106.9136.78622.1506.2454.054 5 7.64112.20952.36928.41714.7165.38135.9878.2063.570 6 9.3770.9338.5023.3071.4431.46418.9193.2771.650 711.1304.51415.6135.7662.6864.90020.8072.1101.555 811.3920.0000.0000.0000.0000.7006.3060.9220.473 911.8552.73514.7474.9382.8803.50025.1504.5951.787 Mean3.45415.1036.9153.5562.84916.2283.3111.740 SE1.3315.6323.0081.5530.7893.7600.8680.435 Median2.2808.5023.3431.9481.74418.9192.6791.574 Range0–12.2090–52.3690–28.4170–14.7160.213–6.7861.345–35.9870.329–8.2060.235–4.054
rithm. The breakpoint was set at 8 km, corresponding to the middle of the gradient. The same approach was used to model spatial variations in CARCOL, CARINS and CARART values. Spearman and Wilcoxon tests were conducted using PAST 4.01 (Hammer et al. 2001), whereas breakpoint regressions were done in STATISTICA v. 6.0 (StatSoft Inc. 2001).
RESULTS
We collected 683 Carabidae, 5,311 Coleoptera, 11,565 Insecta, and 21,571 Arthropoda in autumn, and 630 Carabidae, 4,351 Coleoptera, 20,693 Insecta, and 35,296 Arthropoda in spring, for a total of 1,313 Carabidae, 9,662 Coleo- ptera, 32,258 Insecta, and 56,867 Arthropoda. Carabidae represented about 12.9% of beetles, 5.9% of insects, and 3.2% of arthropods in autumn, and 14.5%
of beetles, 3.0% of insects, and 1.8% of arthropods in spring. Overall, carabids accounted for 13.6% of beetles, 4.1% of insects and 2.3% of arthropods.
We found no significant difference in median AD values between sea- sons (Wilcoxon paired test; Tables 1 & 2). Similarly, we did not find significant differences between seasons in median values (Wilcoxon paired test) of CAR- COL, CARINS and CARART (Tables 1 & 2). AD values in autumn followed the same spatial pattern recorded in spring (Spearman rank correlation test;
Table 2, Fig. 2). Similarly, spatial patterns of CARCOL, CARINS and CARA- RT values in autumn were correlated (Spearman rank correlation test) with those observed in spring (Table 2, Fig. 2).
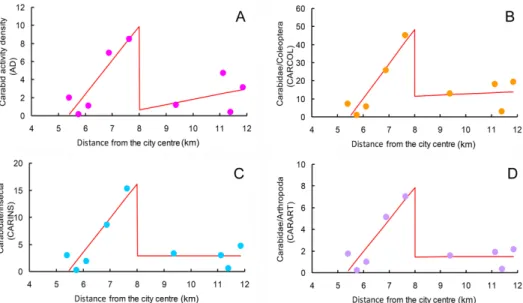
Breakpoint regressions (Table 3, Fig. 3) revealed that AD, CARCOL, CARINS, and CARART increased significantly from the beginning to the middle of the gradient, where a peak was detected in all cases (first regres- sion segment). The second regression segment was not significant in all cases.
However, in the case of AD, the slope (b
2) of the second regression was rela- tively high, suggesting a possible positive trend.
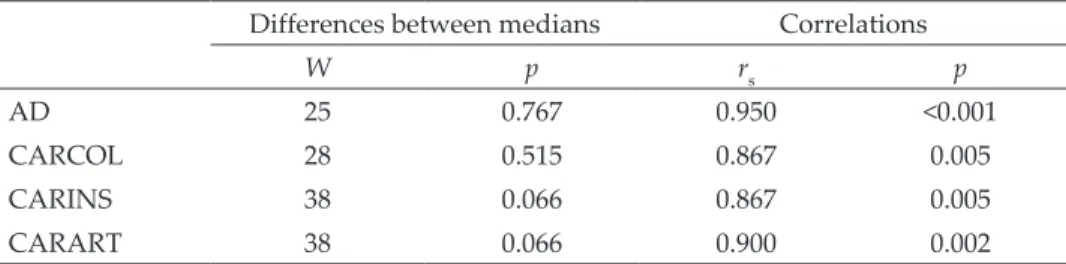
Table 2. Results of tests for differences (Wilcoxon paired test) and correlations (Spear- man test) in activity density (AD) and ratios of carabid beetles to total number of individ- ual beetles (CARCOL), insects (CARINS), and arthropods (CARART) between seasons (autumn versus spring) for nine sites within an urban park at different distance from the city centre of Rome (Italy). W = Wilcoxon statistic; rs = Spearman rank correlation coef-
ficient; p = probability. N = 9 in all cases.
Differences between medians Correlations
W p rs p
AD 25 0.767 0.950 <0.001
CARCOL 28 0.515 0.867 0.005
CARINS 38 0.066 0.867 0.005
CARART 38 0.066 0.900 0.002
DISCUSSION
Activity density of carabids in urban Rome showed similar values in autumn and spring. Carabid phenology is known to vary geographically in response to different climatic conditions (Thiele 1977, Brandmayr & Zetto 1986, Betz 1992, Holland 2002). Under Mediterranean climate, lowland car- abid communities appear to have two peaks of activity: a first, usually higher, peak in autumn (with a prevalence of autumn breeders) and a second, usu- ally lower peak in spring (Comandini & Vigna Taglianti 1990). Our results indicate that overall activity density in spring did not differ significantly from that recorded in autumn. This can be explained by assuming either a constant activity density over the year (as recorded by Brandmayr & Zetto 1986 in
Table 3. Results of breakpoint regressions of activity density (AD) and ratios of carabid beetles to total number of individual beetles (CARCOL), insects (CARINS), and arthro- pods (CARART) as a function of distance from the city centre of Rome (Italy) (in km). b0,b1, b2, and b3 are estimated parameters.
Estimate Standard Error t-value p-level
AD
b0 –20.119 7.088 –2.839 0.036
b1 3.748 1.105 3.391 0.019
b3 –4.039 11.666 –0.346 0.743
b2 0.585 1.063 0.551 0.606
CARCOL
b0 –104.960 28.368 –3.700 0.014
b1 19.178 4.424 4.335 0.007
b3 6.481 46.693 0.139 0.895
b2 0.624 4.253 0.147 0.889
CARINS
b0 –34.322 8.747 –3.924 0.011
b1 6.308 1.364 4.624 0.006
b3 2.777 14.398 0.193 0.855
b2 0.010 1.311 0.008 0.994
CARART
b0 –15.838 4.387 –3.611 0.015
b1 2.964 0.684 4.332 0.007
b3 1.403 7.220 0.194 0.854
b2 0.007 0.658 0.011 0.991
the lowland Mediterranean belt on the Triestine Karst) or the presence of two similar peaks. In this second circumstance, the spring peak might be similar to the autumn peak, and not lower as proposed by Comandini and Vigna Taglianti (1990).
In both seasons, spatial patterns of activity density showed their maxi- mum in the middle of the gradient, which indicates that variations in climate conditions did not change the AD spatial patterns. Our analyses based on to- tal AD values indicate that activity density increased linearly from the begin- ning of the transect (i.e. in the portion of the park near the city centre) to the middle, at about 7–8 km from the city centre. This result contrasts with previ- ous research on urban carabids showing a peak for rural areas (five cases out of the eight reported in Niemelä & Kötze 2009), but is consistent with others indicating a peak in suburban areas (three cases out of the eight reported in Niemelä & Kötze 2009). In fact, the eight urban-rural gradients investigated by Niemelä and Kötze (2009) divided each gradient into three zones (urban,
Fig. 2. Spatial variation in activity density (AD, panel A) and ratios of carabid beetles to total number of individual beetles (CARCOL, panel B), insects (CARINS, panel C), and arthropods (CARART, panel D) along the urban gradient (km from the city centre) in au-
tumn (brown cricles) and spring (green triangles)
suburban, rural) and compared activity density between them. Moreover, these three zones were identified, for each gradient, in different parts of the city characterised by different urbanisation intensity. Our approach allowed a more detailed analysis because we did not compare zones at different urbani- sation intensity, but modelled a continuous spatial gradient within the same green area from the city centre to rural areas at the border of the city.
More in general, our results are consistent with previous research report- ing high species abundance values in the middle of the urban-rural gradient.
For example, among vertebrates, Blair (1999) reported a peak in bird abun- dance with intermediate urbanisation levels, while Eötvös et al. (2020) found a higher predation pressure by ground active arthropods on sentinel prey in moderately disturbed suburban forest habitats, which is consistent with a higher activity density of these predators.
This middle peak can be explained by the disturbance heterogeneity model of species richness proposed by Porter et al. (2001). According to this model, a diversity peak in the middle of the gradient is the result of high habi- tat heterogeneity due to a combination of native and anthropogenic habitats.
Connell’s (1978) original formulation of the intermediate disturbance hy- pothesis proposes that in a community left undisturbed competitive exclusion
Fig. 3. Spatial variation in total activity density (AD, panel A) and ratios of carabid beetles to total number of individual beetles (CARCOL, panel B), insects (CARINS, panel C), and arthropods (CARART, panel D) along the urban gradient (km from the city centre). Red lines are fitted breakpoint regressions. Explained variances are as follows: R 2= 0.720 for for
AD, R2 = 0.794 for CARCOL, R2 = 0.830 for CARINS, and R2 = 0.816 for CARART
will eventually eliminate all but the late-successional species. However, too much disturbance also reduces overall diversity by eliminating species un- able of rapid recolonisation. Thus, there is an optimum degree of disturbance, which allows the maintenance of a maximum number of species. Therefore, the model proposed by Porter et al. (2001), which focuses on spatial heteroge- neity, is a modified version of Connell’s (1978) intermediate disturbance hy- pothesis, already evoked to explain an intermediate peak in diversity (Blair
& Launer 1997, Germaine & Wakeling 2001), and which is more based to temporal disturbance. It is also known that spatial diversity of urban habitats enhances species turnover (beta diversity) in plants and insects (Rebele 1994, Niemelä 1999). Thus it would be interesting, in the future, to see if the AD peak recorded in our study also corresponds to a peak in carabid species richness.
After the peak at about 8 km from the city centre, AD did not change significantly along the rest of the gradient (regression coefficient not signifi- cant). However, a certain positive trend is apparent. This suggests that, after decreasing sharply, AD tends to increase again, albeit slowly. This might sug- gest higher AD values in more natural areas, outside the urban-rural gradi- ent, possibly because an enhanced naturalness of the environment promotes a more evenly distribution of species abundance values.
Carabid relative abundance (as expressed by their proportion to total beetles, insects, and arthropods) followed the same basic patterns as activity density. First, average carabid relative abundances did not vary significantly between the two sampling seasons, which means that carabid beetle contribu- tion to the overall ground-dwelling beetle, insect and arthropod assemblages remains substantially the same. Second, carabid relative abundance followed the same spatial pattern of variation along the urban-rural gradient in the two sampling periods, which means that the relative contribution of carabids to total beetle, insect and arthropod abundance in soil-dwelling communities along the gradient does not change between seasons. Overall, these findings indicate that carabids play a prominent role in invertebrate community struc- ture in both autumn and spring along the gradient.
Interestingly, our results are similar to the pattern that can be obtained
by calculating the proportion of carabids to arthropods along the urban-rural
gradient in London (Davis 1978). To this end, we used Davis’ (1978) data of
the number of carabids and number of arthropods trapped in London gardens
at different distances from the city centre and applied a breakpoint regression
approach (we omitted two sites that were clearly anomalous in having too
few individuals of carabids and arthropods, respectively). We obtain that the
proportion of carabids to arthropods (CARART) followed the same pattern
observed in our study area: y = (-2.734+2.254 × D) × (D ≤ 20) + (35.130-0.696 ×
D) × (D>20), with R
2= 0.545 (distance breakpoint set at B = 20 km).
As for activity density, carabid relative abundance (CARCOL, CARINS, and CARART) increased linearly from the beginning of the transect (i.e. near the city centre) to the middle, then declined sharply and remain low until the end of the gradient. This indicates that the relative importance of carabids in shaping communities of soil-dwelling invertebrates changes along the gradient, similarly to their activity density. This is not an obvious result. For example, carabid beetles might have a high activity density, but a low rela- tive abundance, in a given site, and a low activity density, but a high relative abundance, in another – if carabids were abundant in the first and scarce in the second, but other beetles were much more abundant in the first site than in the second one.
The middle peak of carabid relative abundance (expressed as CARCOL, CARINS or CARART) can be explained by assuming that local habitat hetero- geneity promotes their abundance. However, increasing urbanisation has det- rimental effects more pronounced on these beetles than other members of the soil-dwelling animal communities, as indicated by the decrease in their rela- tive abundance with decreasing distance to the city centre. This might be due to the relative increase in the abundance of other, possibly more generalist groups. For example, patterns of ant abundance across a gradient from a for- est community to one associated with urban development in the Lake Tahoe Basin (USA) varied according to the functional groups (Sanford et al. 2008).
“Aerator ants” (which construct complex subterranean tunnels) had a hump-
shaped pattern peaking at the middle of the gradient, whereas “decomposer
ants” (which construct their tunnels in woody debris) had a monotonic de-
crease, “compiler ants” (which construct thatch mounds on ground) had a
slightly increasing monotonic pattern, and “generalist ants” had their lowest
abundance in the middle of the gradient (Sanford et al. 2008). These opposite
patterns in aerator and generalist ants have been interpreted in relation to a
disturbance. In general, the unimodal response in aerators can be considered
the result of spatial heterogeneity created by ground disturbance from human
activities and forest management, whereas the pattern in generalists can be
considered a compensatory effect, due to the ability of generalists to perform
some of the same ecosystem services provided by aerators when they are
absent due to their higher sensitivity to land degradation. Similarly, we can
hypothesise that the decreasing relative abundance in carabid beetles, which
are mainly predators, at increasing urbanisation in our urban-rural gradient
might be associated with an increase in the relative abundance of other func-
tional groups in the total number of beetles, insects, or arthropods. Further
research investigating spatial patterns of different functional groups along the
urban-rural gradient considered in our study is needed to test this hypothesis.
CONCLUSIONS
We found that carabid beetle activity density was similar in autumn and spring. This can be explained by assuming either a constant activity density over the year or the presence of two similar peaks. As already observed for various organisms in urban environments, we found that carabid activity density peaked in the middle of the urban-rural gradient. This supports the intermediate disturbance hypothesis, according to which moderate urbanisa- tion may favour diversity by increasing habitat heterogeneity. Proportions of carabids to total beetle, insect or arthropod abundance peaked in the middle of the gradient, which indicates that intermediate urbanisation favours car- abids more than most of the other taxa. Our findings regard cumulative activ- ity density, with no distinction among species or functional groups. Further research is therefore needed to investigate how different functional groups, species richness, diversity and individual species activity density respond to the urban-rural gradient.
*
Acknowledgements – We are grateful to Dr. Fabrizio Piccari of the Appia Antica Re- gional Park for his support during fieldwork and data collection and to an anonymous reviewer for his/her comments on a previous version of the manuscript. This research has been partially funded by the Grant of Excellence Departments, MIUR-Italy (ARTICOLO 1, COMMI 314 – 337 LEGGE 232/2016).
REFERENCES
Adler, F. R. & Tanner, C. J. (2013): Urban ecosystems: ecological principles for the built environ- ment. – Cambridge University Press, Cambridge, 357 pp.
Angold, P. G., Sadler, J. P., Hill, M. O., Pullin, A., Rushton, S., Austin, K., Small, E., Wood, B. & Wadsworth, R. (2006): Biodiversity in urban habitat patches. – Science of the Total Environment 360: 196–204. https://doi.org/10.1016/j.scitotenv.2005.08.035 Blair, R. B. (1999): Birds and butterflies along an urban gradient: surrogate taxa for as-
sessing biodiversity? – Ecological Applications 9: 164–170. https://doi.org/10.1890/1051- 0761(1999)009[0164:BABAAU]2.0.CO;2
Blair, R. B. & Launer, A. E. (1997): Butterfly diversity and human land use: Species as- semblages along an urban gradient. – Biological Conservation 80: 113–125. https://doi.
org/10.1016/S0006-3207(96)00056-0
den Boer, P. J. & den Boer–Daanje, W. (1990): On life history tactics in carabid beetles: are there only spring and autumn breeders? Pp. 247–258, In: Stork, N. E. (ed.): The role of ground beetles in ecological and environmental studies. Intercept, Andover.
Comandini, F. & Vigna Taglianti, A. (1990): Phenology of Carabid Beetle Communities along an Altitudinal Transect in Central Italy. Pp. 389–391. In: Stork, N. E. (ed.): The Role of Ground Beetles in Ecological and Environmental Studies. Intercept, Andover.
Brandmayr, P. & Zetto, T. (1986): Phenology of Ground Beetles and its Ecological Signifi- cance in Some of the Main Habitat Types of Southern Europe. Pp. 195–220. In: den Boer, P. J., Luff, M. L., Mossakowski, F. & Weber, F. (eds): Carabid Beetles – Their Adaptations and Dynamics. – Gustav Fischer, Stuttgart.
Brandmayr, P., Zetto, T. & Pizzolotto, R. (2005): I Coleotteri Carabidi per la valutazione ambientale e la conservazione della biodiversità. Manuale operativo. Manuali e Linee guida 34/2005. – APAT – Agenzia per la protezione dell’ambiente e per i servizi tecnici, Roma, 240 pp. [in Italian]
Buccomino, G. & Stanisci, A. (2000): Contributo alla conoscenza floristica della Valle della Caffarella (Roma). – Informatore botanico italiano 32: 3–15.
Celesti Grapow, L. & Fanelli, G. (1993): The vanishing landscape of the Campagna Romana. – Landscape and Urban Planning 24: 69–76. https://doi.org/10.1016/0169- 2046(93)90085-R
Ceschin, S., Cutini, M. & Caneva, G. (2006): Contributo alla conoscenza della vegetazione delle aree archeologiche romane (Roma). – Fitosociologia 43: 97–139.
Connell, J. H. (1978): Diversity in tropical rain forests and coral reefs. – Science 199: 1302–
1310. https://doi.org/10.1126/science.199.4335.1302
Davis, B. N. K. (1978): Urbanisation and the diversity of insects. Pp. 126–138. In: Mound, L.
A. & Waloff, N. (eds): Diversity of insect faunas. – Symposia of the Royal Entomo- logical Society of London, 9. Blackwell Scientific Publications, London,
Di Pietro, S., Mantoni, C. & Fattorini, S. (2020): Influence of urbanization on the avian species-area relationship: insights from the breeding birds of Rome. Urban Ecosystems https://doi.org/10.1007/s11252-020-01081-4
Eldredge, N. & Horenstein, S. (2014): Concrete jungle. New York city and our last best hope for a sustainable future. – University of California Press, Oakland, 288 pp.
Eötvös, C. B., Lövei, G. L. & Magura, T. (2020): Predation pressure on sentinel insect prey along a riverside urbanization gradient in Hungary. – Insects 11: 97. https://doi.
org/10.3390/insects11020097
Fanfani, A., Manes, F., Moretti, V., Ranazzi, L. & Salvati, L. (2014): Vegetation, precipita- tion and demographic response of a woodland predator: Tawny Owl Strix aluco as an indicator of soil aridity in Castelporziano forest. – Rendiconti Lincei. Scienze Fisiche e Naturali 26: 391–397. https://doi.org/10.1007/s12210-015-0392-7
Fattorini, S. (2011): Insect extinction by urbanization: a long term study in Rome. – Biologi- cal Conservation 144: 370–375. https://doi.org/10.1016/j.biocon.2010.09.014
Fattorini, S. (2019): Ecologia urbana. – Ediesse, Roma, 304 pp.
Fattorini, S. & Galassi, D. M. P. (2016): Role of urban green spaces for saproxylic beetle conservation: a case study of tenebrionids in Rome, Italy. – Journal of Insect Conserva- tion 20: 737–745. https://doi.org/10.1007/s10841-016-9900-z
Forman, R. T. (2014): Urban ecology: science of cities. – Cambridge University Press, Cam- bridge, 476 pp.
French, B. W., Elliott, N. C., Berberet, R. C. & Burd, J. D. (2001): Effects of riparian and grassland habitats on ground beetle (Coleoptera: Carabidae) assemblages in adjacent wheat fields. – Environmental Entomology 30: 225–234. https://doi.org/10.1603/0046- 225X-30.2.225
Germaine, S. S. & Wakeling, B. F. (2001): Lizard species distributions and habitat occupa- tion along an urban gradient in Tucson, Arizona, USA – Biological Conservation 97:
229–237. https://doi.org/10.1016/S0006-3207(00)00115-4
Holland, J. M. (2002): The agroecology of carabid beetles. – Intercept, Andover, 356 pp.
Hůrka, K. (1986): The developmental type of Carabidae in the temperate zone as a taxo- nomic character. Pp. 187–194. In: den Boer, P. J., Luff, M. L., Mossakowski, F. & We- ber, F. (eds): Carabid beetles – Their adaptations and dynamics. – Gustav Fischer, Stuttgart.
Hammer, Ø, Harper, D. A. T. & Ryan, P. D. (2001): PAST – PAlaeontological STatistics. – Palaeontologia Electronica 4: 1–9.
Jones, E. L. & Leather, S. R. (2012): Invertebrates in urban areas: a review. – European Jour- nal of Entomology 109: 463–478. https://doi.org/10.14411/eje.2012.060
Lafage, D., Secondi, J., Georges, A. & Bouzillé, J. B. (2014): Satellite-derived vegetation indices as surrogate of species richness and abundance of ground beetles in temper- ate floodplains. – Insect Conservation and Diversity 7: 327–333. https://doi.org/10.1111/
icad.12056
Lucchese, F. & Pignatti, E. (2009): La vegetazione nelle aree archeologiche di Roma e della Campagna Romana – Quaderni di Botanica ambientale e applicata 20: 3–89.
McDonald, R. I., Marcotullio, P. J. & Güneralp, B. (2013): Urbanization and global trends in biodiversity and ecosystem services. Pp. 31–52. In: Elmqvist, T., Frag kias, M., Goodness, J., Güneralp, B., Marcotullio, P. J., McDonald, R. I., Parnell, S., Schewenius, M., Sendstad, M., Seto, K. C. & Wilkinson, C. (eds): Urbanization, biodi- versity and ecosystem services: Challenges and opportunities: A global assessment. – Spring- er, Dordrecht.
McDonnell, M. J. & Hahs, A. (2008): The use of gradient analysis studies in advancing our understanding of the ecology of urbanizing landscapes: Current status and future di- rections. – Landscape Ecology 23: 1143–1155. https://doi.org/10.1007/s10980-008-9253-4 McKinney, M. L. (2002): Urbanization, biodiversity, and conservation: The impacts of
urbanization on native species are poorly studied, but educating a highly urban- ized human population about these impacts can greatly improve species conser- vation in all ecosystems. – Bioscience 52: 883–890. https://doi.org/10.1641/0006- 3568(2002)052[0883:UBAC]2.0.CO;2
McKinney, M. L. (2006): Urbanization as a major cause of biotic homogenisation. – Biologi- cal Conservation 127: 247–260. https://doi.org/10.1016/j.biocon.2005.09.005
McKinney, M. L. (2008): Effects of urbanization on species richness: a review of plants and animals. – Urban Ecosystems 11: 161–176. https://doi.org/10.1007/s11252-007-0045-4 New, T. R. (2015): Insect conservation and urban environments. – Springer, New York, 244 pp.
https://doi.org/10.1007/978-3-319-21224-1
Niemelä, J., Kotze, J., Ashworth, A., Brandmayr, P., Desender, K., New, T., Penev, L., Samways, M. & Spence J. (2000): The search for common anthropogenic impacts on biodiversity: a global network. Journal of Insect Conservation 4: 3–9. https://doi.
org/10.1023/A:1009655127440
Niemelä, J., Kotze, D. J. , Venn, S., Penev, L., Stoyanov, I., Spence, J., Hartley, D. & Montes de Oca, E. (2002): Carabid beetle assemblages (Coleoptera, Carabidae) across urban- rural gradients: an international comparison. – Landscape Ecology 17: 387–401. https://
doi.org/10.1023/A:1021270121630
Niemelä, J. & Kotze, D. J. (2009): Carabid beetle assemblages along urban to rural gra- dients: a review. – Landscape and Urban Planning 92: 65–71. https://doi.org/10.1016/j.
landurbplan.2009.05.016
Niemelä, J. (1999): Ecology and urban planning. – Biodiversity and Conservation 8: 119–131.
https://doi.org/10.1023/A:1008817325994
Porter, E. E., Forschner, B. R. & Blair, R. B. (2001): Woody fragmentation and canopy fragmentation along a forest-to-urban gradient. – Urban Ecosystems 5:131-151. https://
doi.org/10.1023/A:1022391721622
Paarman, W. (1970): Untersuchungen über die Jahresrhythmik von Laufkäfern (Coleo- ptera, Carabidae) in der Cyrenaika (Libyen, Nordafrika). – Oecologia 5: 325–333.
https://doi.org/10.1007/BF00815498
Pizzolotto, R., Mazzei, A., Bonacci, T., Scalercio, S., Iannotta, N., Brandmayr, P. (2018):
Ground beetles in Mediterranean olive agroecosystems: Their significance and func- tional role as bioindicators (Coleoptera, Carabidae). – PLoS ONE 13: e0194551. https://
doi.org/10.1371/journal.pone.0194551
Purtauf, T., Dauber, J. & Wolters, V. (2005): The response of carabids to landscape simplification differs between trophic groups. – Oecologia 142:458–464. https://doi.
org/10.1007/s00442-004-1740-y
Rebele, F. (1994): Urban ecology and special features of urban ecosystems. – Global Ecology and Biogeography Letters 4: 173–187. https://doi.org/10.2307/2997649
Salvati, L., Venanzoni, G., Serra, P. & Carlucci, M. (2016): Scattered or polycentric? Un- tangling urban growth in three southern European metropolitan regions through exploratory spatial data analysis. – The Annals of Regional Science 57: 1–29. https://doi.
org/10.1007/s00168-016-0758-5
Salvati, L., Ciommi, M. T., Serra, P. & Chielli, F. M. (2019): Exploring the spatial structure of housing prices under economic expansion and stagnation: The role of socio-demo- graphic factors in metropolitan Rome, Italy. – Land Use Policy 81: 143-152. https://doi.
org/10.1016/j.landusepol.2018.10.030
Sanford, M. P., Manley , P. N. & Murphy, D. D. (2008): Effects of urban development on ant communities: implications for ecosystem services and management. – Conserva- tion Biology 23: 131–141. https://doi.org/10.1111/j.1523-1739.2008.01040.x
StatSoft Inc. (2001): STATISTICA (data analysis software system), version 6. Computer program manuals. – Tulsa, USA, http://www.statsoft.com
Thiele, H.-U. (1977): Carabid beetles in their environments. – Springer Verlag, Berlin. https://
doi.org/10.1007/978-3-642-81154-8
Worldwatch Institute (2007): State of the World 2007: our urban future. – W. W. Norton &
Company Inc., New York, 288 pp.
Received March 13, 2020, accepted December 6, 2020, published December 28, 2020