The original published PDF available in this website:
https://onlinelibrary.wiley.com/doi/abs/10.1002/eco.2009
Habitat mapping of riverine fish by means of hydromorphological tools
Sándor Baranya1, Gábor Fleit1, János Józsa1,2, Zoltán Szalóky3, Balázs Tóth4, István Czeglédi5 and Tibor Erős3,5
1Budapest University of Technology and Economics, Department of Hydraulic and Water Resources Engineering, 1111 Budapest, Műegyetem rkp. 3. (E-mail:
baranya.sandor@epito.bme.hu)
2MTA-BME Water Management Research Group, 1051 Budapest Nádor u. 7.
3MTA Centre for Ecological Research, Danube Research Institute, 1113 Budapest, Karolina út 29.
4Duna-Ipoly National Park Directorate, 1121 Budapest, Költő u. 21
5MTA Centre for Ecological Research, Balaton Limnological Institute, 8237 Tihany, Klebelsberg Kuno u. 3.
Abstract
Hydromorphological features of rivers, such as flow depth, flow velocity, and the composition of bed material play a crucial role in the habitat selection of fish. Although these basic hydromorphological parameters can be determined with high spatial and temporal resolution using state‐ of‐ the‐ art investigation methods, only few studies deal with the connection of habitat parameters and abundance of fishes (i.e., habitat modelling) in large rivers. The aim of this study is to fill this gap by introducing the so‐ called habitat maps connecting the results of 3D hydrodynamic simulations and results of offshore fish ecological surveys. The steps of habitat modelling are introduced through the case study of the Danube River focusing on evaluating the habitat use and suitability of two fish species representative to this section of the river (i.e., the round goby Neogobius melanostomus and the Danube streber Zingel streber). A novel method for mapping the bed material composition, playing a crucial role in the habitat assessment, is also presented along the numerical modelling.
KEYWORDS
bed material mapping, Danube, habitat suitability, hydromorphology, numerical modelling
FIGURE 1 (a) Location of the study area; (b) digital elevation model of the study reach; (c) dried bed material samples (from the locations marked in b)
FIGURE 2 Grain size distribution curves of the bed material samples (the sampling locations of Samples 1-4 are indicated in Figure 1b)
FIGURE 3 Determination of mean bed shear stress value for a computational cell: (a) simulated local bed shear stress versus flow discharge; (b) probability distribution of flow discharge; (c) derived probability distribution of bed shear stress and the estimated mean value
FIGURE 4 Measured (left) versus simulated cross‐ sectional flow velocity distributions for two flow regimes: (a) Qlow = 1,150 m3/s and (b) Q1year = 2,900 m3/s (perspective view from downstream)
FIGURE 5 Measured versus simulated flow velocities for each ADCP cell
FIGURE 6 (a) Simulated mean bed shear stress field in the main channel (black dots indicate the location of bed material samplings); (b) relationships between grain‐ size fractions and simulated mean bed shear stress values at the bed material sampling points (error bars indicate the range of the simulated bed shear stress values); (c) simulated bed material map (small graph: comparison of measured and simulated D50 values; rectangles show the three bed material categories)
FIGURE 7 Relationships between fish abundance (i.e., CPUE: number of individuals per 500‐ m sample length) and physical habitat variables (depth, velocity, and bed material) for the (a) round goby, and for the (b) Danube streber. The response curves were fitted using the smoothing function of generalized additive models
FIGURE 8 Flow depth, flow velocity, and bed material composition based SI functions for the round goby (Neogobius melanostomus; blue) and for the Danube streber (Zingel streber;
red)
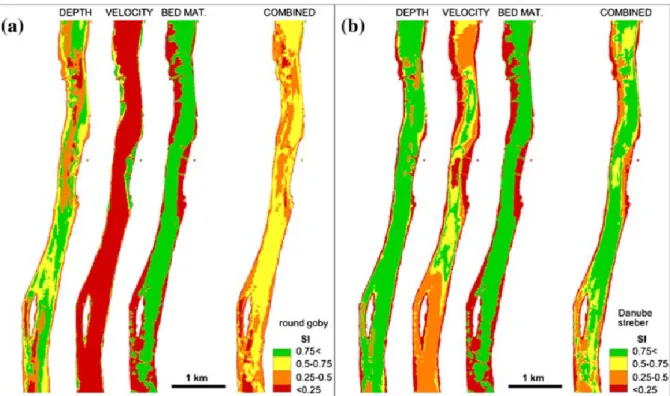
FIGURE 9 Habitat suitability maps at mean water (Qmean = 1,450 m3/s) for (a) the round goby (Neogobius melanostomus) and for (b) the Danube streber (Zingel streber). Values close to zero (<0.25 SI values, red) indicate unsuitable habitat conditions, whereas values close to one (0.75 < SI values, green) indicate preferred habitat conditions
FIGURE 10 Habitat suitability maps during flood (Q125years = 6,100 m3/s) for (a) the round goby (Neogobius melanostomus) and for (b) the Danube streber (Zingel streber). Values close to zero (<0.25 SI values, red) indicate unsuitable habitat conditions, whereas values close to one (0.75 < SI values, green) indicate preferred habitat conditions
FIGURE 11 Frequency distribution of the areal representation of four SI classes for (a) the round goby (Neogobius melanostomus) and for (b) the Danube streber (Zingel streber)