International Journal of
Molecular Sciences
Article
Dysregulation of Placental Functions and Immune Pathways in Complete Hydatidiform Moles
Jennifer R. King1,†, Melissa L. Wilson2,† , Szabolcs Hetey3, Peter Kiraly3, Koji Matsuo1 , Antonio V. Castaneda4, Eszter Toth3 , Tibor Krenacs5 , Petronella Hupuczi6,
Paulette Mhawech-Fauceglia4, Andrea Balogh3 , Andras Szilagyi3 , Janos Matko7 , Zoltan Papp6,8 , Lynda D. Roman1 , Victoria K. Cortessis1,2,* and
Nandor Gabor Than1,3,5,6,*
1 Department of Obstetrics and Gynecology, Keck School of Medicine, University of Southern California, Los Angeles, CA 90033, USA; jennyrenaeking@gmail.com (J.R.K.); koji.matsuo@med.usc.edu (K.M.);
lroman@usc.edu (L.D.R.)
2 Department of Preventive Medicine, University of Southern California, Los Angeles, CA 90033, USA;
melisslw@usc.edu
3 Systems Biology of Reproduction Research Group, Institute of Enzymology, Research Centre for Natural Sciences, H-1117 Budapest, Hungary; heteysz@gmail.com (S.H.); peter0kiraly@gmail.com (P.K.);
toth.eszter@ttk.hu (E.T.); balogh.andrea@ttk.hu (A.B.); szilagyi.andras@ttk.hu (A.S.)
4 Department of Pathology, Keck School of Medicine, University of Southern California, Los Angeles, CA 90033, USA; antonio.castaneda@osumc.edu (A.V.C.); pfauceglia@hotmail.com (P.M.-F.)
5 First Department of Pathology and Experimental Cancer Research, Semmelweis University, H-1085 Budapest, Hungary; krenacst@gmail.com
6 Maternity Private Clinic of Obstetrics and Gynecology, H-1126 Budapest, Hungary;
hupuczi.petronella@maternity.hu (P.H.); pzorvosihetilap@maternity.hu (Z.P.)
7 Department of Immunology, Institute of Biology, Eotvos Lorand University, H-1117 Budapest, Hungary;
matko@elte.hu
8 Department of Obstetrics and Gynecology, Semmelweis University, H-1088 Budapest, Hungary
* Correspondence: victoria.cortessis@med.usc.edu (V.K.C.); than.gabor@ttk.hu (N.G.T.);
Tel.:+1-(323)-865-0544 (V.K.C.);+36-(1)-382-6788 (N.G.T.)
† These authors contributed equally to this work.
Received: 17 September 2019; Accepted: 30 September 2019; Published: 10 October 2019
Abstract: Gene expression studies of molar pregnancy have been limited to a small number of candidate loci. We analyzed high-dimensional RNA and protein data to characterize molecular features of complete hydatidiform moles (CHMs) and corresponding pathologic pathways.
CHMs and first trimester placentas were collected, histopathologically examined, then flash-frozen or paraffin-embedded. Frozen CHMs and control placentas were subjected to RNA-Seq, with resulting data and published placental RNA-Seq data subjected to bioinformatics analyses. Paraffin-embedded tissues from CHMs and control placentas were used for tissue microarray (TMA) construction, immunohistochemistry, and immunoscoring for galectin-14. Of the 14,022 protein-coding genes expressed in all samples, 3,729 were differentially expressed (DE) in CHMs, of which 72% were up-regulated. DE genes were enriched in placenta-specific genes (OR=1.88,p=0.0001), of which 79% were down-regulated, imprinted genes (OR = 2.38, p = 1.54 × 10⁻⁶), and immune genes (OR=1.82,p=7.34×10⁻¹⁸), of which 73% were up-regulated. DNA methylation-related enzymes and histone demethylases were dysregulated. “Cytokine–cytokine receptor interaction” was the most impacted of 38 dysregulated pathways, among which 17 were immune-related pathways.
TMA-based immunoscoring validated the lower expression of galectin-14 in CHM. In conclusion, placental functions were down-regulated, imprinted gene expression was altered, and immune pathways were activated, indicating complex dysregulation of placental developmental and immune processes in CHMs.
Int. J. Mol. Sci.2019,20, 4999; doi:10.3390/ijms20204999 www.mdpi.com/journal/ijms
Keywords: choriocarcinoma; hydatidiform mole; galectin; gestational trophoblastic disease;
placental-specific gene; systems biology; trophoblast differentiation
1. Introduction
Gestational trophoblastic disease (GTD) is characterized by abnormal trophoblastic proliferation and includes hydatidiform mole (complete and partial) and gestational trophoblastic neoplasia (invasive mole, choriocarcinoma, placental site trophoblastic tumor, and epithelioid trophoblastic tumor) [1,2].
Diagnosis relies on clinical presentation and histologic assessment, and treatment is aimed at uterine evacuation with chemotherapy typically reserved for gestational trophoblastic neoplasia (GTN) [2,3].
Post-molar human chorionic gonadotropin (hCG) monitoring is an essential part of management for evaluating the development of GTN, which follows complete hydatidiform moles (CHMs) in ~15–20%
of cases [4]. Although GTN is considered among the most curable of all solid tumors with cure rates over 90%, unrecognized and misdiagnosed GTD can result in unnecessarily increased maternal morbidity and mortality [3].
The reported incidence of GTD varies by geographic location, race or ethnicity, maternal age, and histopathologic subtype. Hydatidiform mole reportedly complicates up to two per 1000 pregnancies in Southeast Asia and Japan, nearly twice that proportion reported in North America, Australia, New Zealand, and Europe [5]. This geographic variation has been partially attributed to racial and ethnic differences, as the prevalence of GTD is elevated in American Indians, Asians, and Hispanics across the world [6,7]. Asian and American Indian women have also been shown to have more aggressive disease, with increased risk of developing GTN compared to other ethnic groups [8,9].
Extremes of maternal age are also correlated with higher rates of CHMs, with an increased incidence among women over 40 years of age and under 20 years of age [10]. Beyond maternal age and ethnicity, prior GTD is the strongest risk factor for GTD, with an incidence of 1.3% [11].
These described risk factors (race/ethnicity and prior GTD) are in accord with an underlying genetic etiology of GTD [1,2,12]. The pathophysiology of hydatidiform moles involves overrepresentation of the paternal genome. The biparental diandric triploid karyotype of partial moles accords with dispermic fertilization, while androgenetic diploid karyotype of most CHMs is consistent with monospermic or dispermic fertilization. Recently, some women with recurrent androgenetic CHMs were shown to have bi-allelic deleterious mutations inMEI1(meiotic double-stranded break formation protein 1),TOP6BL (type 2 DNA topoisomerase 6 subunit B-like), andREC114(meiotic recombination protein REC114), leading to meiotic double-strand break formation and extrusion of all maternal chromosomes [13].
Absence of maternal imprinting of gene expression in hydatidiform moles has also been observed in the rare biparental hydatidiform moles due toNLRP7(NLR family pyrin domain containing 7) orKHDC3L (KH domain containing 3 like) mutations, suggesting a common endpoint of pathogenesis [12,14,15].
However, for the more common sporadic CHMs, little is known regarding mechanisms responsible for either pathogenesis or progression to GTN.
The few targeted gene expression studies on molar tissue and a recent meta-analysis of these studies showed that the main genes differentially expressed (DE) in molar tissues may be those involved in villous trophoblast differentiation [16]. However, these findings were based on a limited set of molecules, and these studies mostly targeted placenta- or trophoblast-specific transcripts that were known to be differentially expressed during trophoblast differentiation. A more comprehensive approach to identifying genes and pathways involved in the development of molar disease would be a genome-wide gene expression analysis using either microarrays or RNA-Seq, followed by protein-level validation of DE transcripts.
We sought to implement such a high-dimensional and systems biology approach, similar to that used in our recent study on the pathophysiological processes in preeclampsia [17], to gain more in-depth insight into CHM pathogenesis at RNA and protein levels. This high-dimensional, agnostic
study is the first to evaluate gene expression levels in CHMs using RNA-Seq followed by protein level validation of selected DE transcripts by immunostaining of tissue microarrays (TMA) and immunoscoring. The aim of our study is to identify genes with expression levels that differ in molar tissue from CHMs in comparison to placental chorionic tissue from uncomplicated pregnancies at similar stages of gestation. More complete understanding of the molecular pathways perturbed in CHMs may inform future efforts to improve procedures for early diagnosis and prognostication.
2. Results
2.1. The Transcriptome of First Trimester Placentas and CHMs
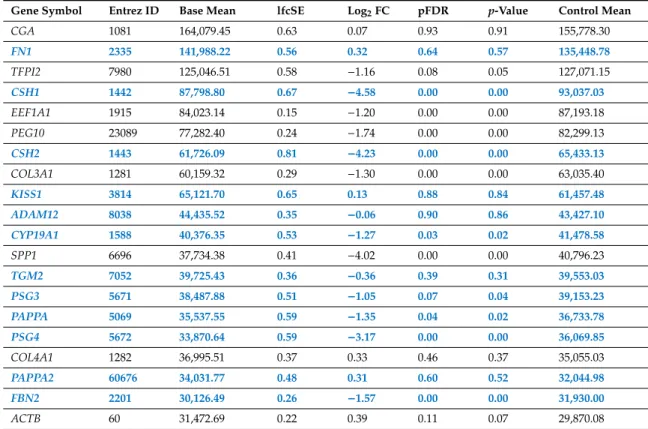
To evaluate absolute gene expression levels, mean expression values were calculated for both groups from RNA-Seq count data by normalizing for housekeeping genes. The highest expression in first trimester placentas was mostly detected for genes with placenta-specific or predominant placental expression [17–19]. Indeed, the 20 most highly-expressed genes (Table1) included genes previously shown to have predominant placental (n=2) or placenta-specific (n=12) expression and unique placental functions in humans. These encode hormones (CGA, chorionic gonadotrophin subunit alpha,CSH1andCSH2, chorionic somatomammotropin hormone 1 and 2), an estrogen synthesizing enzyme (CYP19A1, cytochrome P450 family 19 subfamily A member 1), proteases (ADAM12, ADAM metallopeptidase domain 12;KISS1, kisspeptin-1;PAPPAandPAPPA2, pregnancy-associated plasma protein A and A2;TFPI2, tissue factor pathway inhibitor 2), and immune proteins (PSG3andPSG4, placenta-specific glycoprotein 3 and 4).
Table 1.Genes encoding the 20 transcripts most highly expressed in first trimester placentas.
Gene Symbol Entrez ID Base Mean lfcSE Log2FC pFDR p-Value Control Mean
CGA 1081 164,079.45 0.63 0.07 0.93 0.91 155,778.30
FN1 2335 141,988.22 0.56 0.32 0.64 0.57 135,448.78
TFPI2 7980 125,046.51 0.58 −1.16 0.08 0.05 127,071.15
CSH1 1442 87,798.80 0.67 −4.58 0.00 0.00 93,037.03
EEF1A1 1915 84,023.14 0.15 −1.20 0.00 0.00 87,193.18
PEG10 23089 77,282.40 0.24 −1.74 0.00 0.00 82,299.13
CSH2 1443 61,726.09 0.81 −4.23 0.00 0.00 65,433.13
COL3A1 1281 60,159.32 0.29 −1.30 0.00 0.00 63,035.40
KISS1 3814 65,121.70 0.65 0.13 0.88 0.84 61,457.48
ADAM12 8038 44,435.52 0.35 −0.06 0.90 0.86 43,427.10
CYP19A1 1588 40,376.35 0.53 −1.27 0.03 0.02 41,478.58
SPP1 6696 37,734.38 0.41 −4.02 0.00 0.00 40,796.23
TGM2 7052 39,725.43 0.36 −0.36 0.39 0.31 39,553.03
PSG3 5671 38,487.88 0.51 −1.05 0.07 0.04 39,153.23
PAPPA 5069 35,537.55 0.59 −1.35 0.04 0.02 36,733.78
PSG4 5672 33,870.64 0.59 −3.17 0.00 0.00 36,069.85
COL4A1 1282 36,995.51 0.37 0.33 0.46 0.37 35,055.03
PAPPA2 60676 34,031.77 0.48 0.31 0.60 0.52 32,044.98
FBN2 2201 30,126.49 0.26 −1.57 0.00 0.00 31,930.00
ACTB 60 31,472.69 0.22 0.39 0.11 0.07 29,870.08
Placenta-specific genes are shown in bold blue. False discovery rate, pFDR; fold change, FC; log fold change standard error, lfcSE.
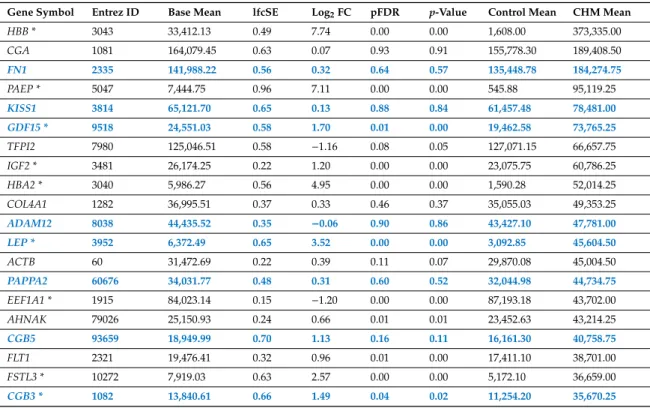
In CHMs, the overall median gene expression levels were ~13% higher than in normal placentas (control placentas: 337.7 vs. CHMs: 382.8). However, placenta-specific transcript levels were 23% lower in CHMs than in normal placentas (placentas: 3,729.6 vs. CHMs: 3,044.3), reflected in a lower number of placenta-specific genes (n=8) among the 20 most highly-expressed transcripts (Table2). In turn,
the 20 most abundant transcripts in CHMs encode proteins with immune, hormone, and oxygen transport functions (FSTL3, follistatin-like 3;HBA2, hemoglobin-alpha 2;HBB, hemoglobin-beta;IGF2, insulin-like growth factor 2;LEP, leptin;PAEP, progestogen-associated endometrial protein).
Table 2.Genes encoding the 20 transcripts most highly expressed in complete hydatidiform moles.
Gene Symbol Entrez ID Base Mean lfcSE Log2FC pFDR p-Value Control Mean CHM Mean
HBB * 3043 33,412.13 0.49 7.74 0.00 0.00 1,608.00 373,335.00
CGA 1081 164,079.45 0.63 0.07 0.93 0.91 155,778.30 189,408.50
FN1 2335 141,988.22 0.56 0.32 0.64 0.57 135,448.78 184,274.75
PAEP * 5047 7,444.75 0.96 7.11 0.00 0.00 545.88 95,119.25
KISS1 3814 65,121.70 0.65 0.13 0.88 0.84 61,457.48 78,481.00
GDF15 * 9518 24,551.03 0.58 1.70 0.01 0.00 19,462.58 73,765.25
TFPI2 7980 125,046.51 0.58 −1.16 0.08 0.05 127,071.15 66,657.75
IGF2 * 3481 26,174.25 0.22 1.20 0.00 0.00 23,075.75 60,786.25
HBA2 * 3040 5,986.27 0.56 4.95 0.00 0.00 1,590.28 52,014.25
COL4A1 1282 36,995.51 0.37 0.33 0.46 0.37 35,055.03 49,353.25
ADAM12 8038 44,435.52 0.35 −0.06 0.90 0.86 43,427.10 47,781.00
LEP * 3952 6,372.49 0.65 3.52 0.00 0.00 3,092.85 45,604.50
ACTB 60 31,472.69 0.22 0.39 0.11 0.07 29,870.08 45,004.50
PAPPA2 60676 34,031.77 0.48 0.31 0.60 0.52 32,044.98 44,734.75
EEF1A1 * 1915 84,023.14 0.15 −1.20 0.00 0.00 87,193.18 43,702.00
AHNAK 79026 25,150.93 0.24 0.66 0.01 0.01 23,452.63 43,214.25
CGB5 93659 18,949.99 0.70 1.13 0.16 0.11 16,161.30 40,758.75
FLT1 2321 19,476.41 0.32 0.96 0.01 0.00 17,411.10 38,701.00
FSTL3 * 10272 7,919.03 0.63 2.57 0.00 0.00 5,172.10 36,659.00
CGB3 * 1082 13,840.61 0.66 1.49 0.04 0.02 11,254.20 35,670.25
Placenta-specific genes are shown in bold blue. Differentially expressed genes are shown with asterisks. Complete hydatidiform mole, CHM; false discovery rate, pFDR; fold change, FC; log fold change standard error, lfcSE.
2.2. Differential Gene Expression in CHMs
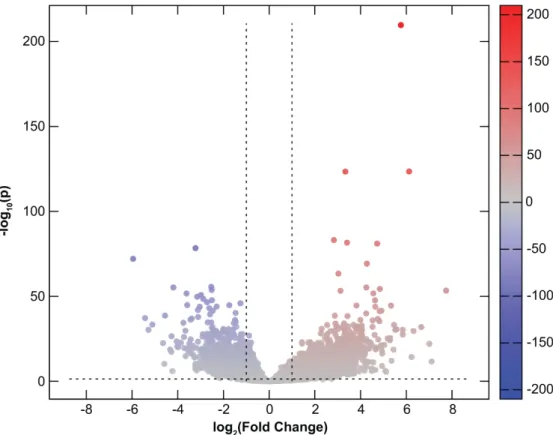
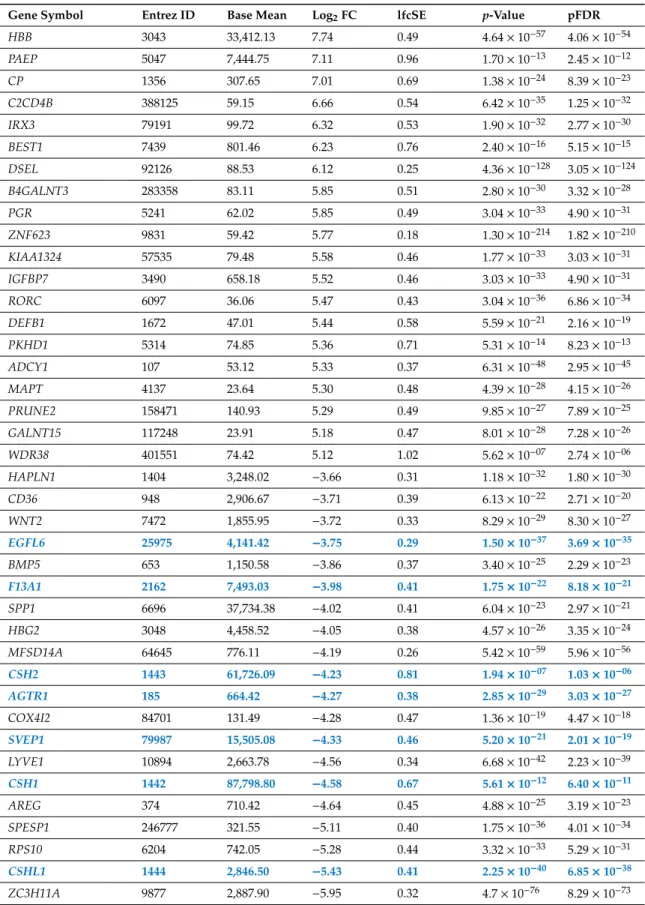
Among transcripts of 14,022 protein-coding genes analyzed with RNA-Seq, a total of 3,729 (27%) were found to be DE in CHMs in comparison to normal first trimester placental tissues. Of these, 2,667 (72%) were up-regulated while 1,062 (28%) were down-regulated in CHM tissues (Supplementary Table S1, Figure1). Of note, there were seven genes with placenta-specific expression among the top 20 transcripts most down-regulated but not up-regulated in CHMs (Table3).
Int. J. Mol. Sci. 2019, 20, x FOR PEER REVIEW 5 of 28
Figure 1. Differential gene expression in complete hydatidiform moles. All 14,022 expressed protein- coding genes are represented in terms of their measured differences in transcript abundance (x-axis) and the significance of the difference (y-axis) on a volcano plot. The significance is represented as negative log (base 10) of the adjusted p-value so that more significant differences in expression are plotted higher on the y-axis. Dotted lines represent the thresholds used to select the differentially expressed (DE) genes: <−1 and >1 for the magnitude of differential expression and pFDR < 0.05 for statistical significance. According to these criteria, of the 3,729 DE transcripts, 2,667 were up-regulated (depicted with red), while 1,062 were down-regulated (depicted with blue) in molar tissues.
Enrichment analysis revealed significant enrichment (OR = 1.88, p = 0.0001) of placenta-specific genes (Supplementary Table 2, Figure 2A) among DE genes. Of interest, 50 out of 63 (79%) placenta- specific DE genes, found to be expressed mainly by the trophoblast, were down-regulated. Among functions of products of these genes were growth hormones (CSHL1, chorionic somatomammotropin hormone-like 1; CSH1, CSH2), immune response (LGALS14, lectin, galactoside-binding, soluble, 14;
PSG4), cell attachment (EGFL6, EGF-like domain multiple 6; SMAGP, small cell adhesion glycoprotein; SVEP1, Sushi, Von Willebrand factor type A, EGF and pentraxin domain containing protein 1), coagulation and blood pressure regulation (AGTR1, angiotensin II receptor type 1; F13A1, coagulation factor XIII A chain), and cell differentiation and developmental processes (PAGE4, PAGE family member 4; PLAC1, placenta specific 1; RASA1, RAS P21 protein activator 1).
Figure 1. Differential gene expression in complete hydatidiform moles. All 14,022 expressed protein-coding genes are represented in terms of their measured differences in transcript abundance (x-axis) and the significance of the difference (y-axis) on a volcano plot. The significance is represented as negative log (base 10) of the adjustedp-value so that more significant differences in expression are plotted higher on the y-axis. Dotted lines represent the thresholds used to select the differentially expressed (DE) genes:<−1 and>1 for the magnitude of differential expression and pFDR<0.05 for statistical significance. According to these criteria, of the 3,729 DE transcripts, 2,667 were up-regulated (depicted with red), while 1062 were down-regulated (depicted with blue) in molar tissues.
Enrichment analysis revealed significant enrichment (OR=1.88,p=0.0001) of placenta-specific genes (Supplementary Table S2, Figure 2A) among DE genes. Of interest, 50 out of 63 (79%) placenta-specific DE genes, found to be expressed mainly by the trophoblast, were down-regulated. Among functions of products of these genes were growth hormones (CSHL1, chorionic somatomammotropin hormone-like 1;CSH1,CSH2), immune response (LGALS14, lectin, galactoside-binding, soluble, 14;PSG4), cell attachment (EGFL6, EGF-like domain multiple 6;SMAGP, small cell adhesion glycoprotein;SVEP1, Sushi, Von Willebrand factor type A, EGF and pentraxin domain containing protein 1), coagulation and blood pressure regulation (AGTR1, angiotensin II receptor type 1;F13A1, coagulation factor XIII A chain), and cell differentiation and developmental processes (PAGE4, PAGE family member 4; PLAC1, placenta specific 1; RASA1, RAS P21 protein activator 1).
Table 3. Genes encoding the 20-20 transcripts with highest and lowest expression in complete hydatidiform moles.
Gene Symbol Entrez ID Base Mean Log2FC lfcSE p-Value pFDR
HBB 3043 33,412.13 7.74 0.49 4.64×10−57 4.06×10−54
PAEP 5047 7,444.75 7.11 0.96 1.70×10⁻¹³ 2.45×10⁻¹²
CP 1356 307.65 7.01 0.69 1.38×10⁻²⁴ 8.39×10⁻²³
C2CD4B 388125 59.15 6.66 0.54 6.42×10⁻³⁵ 1.25×10−32
IRX3 79191 99.72 6.32 0.53 1.90×10⁻³² 2.77×10⁻³⁰
BEST1 7439 801.46 6.23 0.76 2.40×10⁻¹⁶ 5.15×10⁻¹⁵
DSEL 92126 88.53 6.12 0.25 4.36×10−128 3.05×10−124
B4GALNT3 283358 83.11 5.85 0.51 2.80×10⁻³⁰ 3.32×10⁻²⁸
PGR 5241 62.02 5.85 0.49 3.04×10⁻³³ 4.90×10⁻³¹
ZNF623 9831 59.42 5.77 0.18 1.30×10−214 1.82×10−210 KIAA1324 57535 79.48 5.58 0.46 1.77×10⁻³³ 3.03×10⁻³¹ IGFBP7 3490 658.18 5.52 0.46 3.03×10⁻³³ 4.90×10⁻³¹
RORC 6097 36.06 5.47 0.43 3.04×10−36 6.86×10⁻³⁴
DEFB1 1672 47.01 5.44 0.58 5.59×10⁻²¹ 2.16×10⁻¹⁹ PKHD1 5314 74.85 5.36 0.71 5.31×10⁻¹⁴ 8.23×10⁻¹³ ADCY1 107 53.12 5.33 0.37 6.31×10−48 2.95×10−45
MAPT 4137 23.64 5.30 0.48 4.39×10⁻²⁸ 4.15×10⁻²⁶
PRUNE2 158471 140.93 5.29 0.49 9.85×10⁻²⁷ 7.89×10⁻²⁵ GALNT15 117248 23.91 5.18 0.47 8.01×10⁻²⁸ 7.28×10⁻²⁶ WDR38 401551 74.42 5.12 1.02 5.62×10−07 2.74×10−06 HAPLN1 1404 3,248.02 −3.66 0.31 1.18×10⁻³² 1.80×10⁻³⁰
CD36 948 2,906.67 −3.71 0.39 6.13×10⁻²² 2.71×10⁻²⁰
WNT2 7472 1,855.95 −3.72 0.33 8.29×10⁻²⁹ 8.30×10⁻²⁷
EGFL6 25975 4,141.42 −3.75 0.29 1.50×10−37 3.69×10⁻³⁵
BMP5 653 1,150.58 −3.86 0.37 3.40×10⁻²⁵ 2.29×10⁻²³
F13A1 2162 7,493.03 −3.98 0.41 1.75×10⁻²² 8.18×10⁻²¹
SPP1 6696 37,734.38 −4.02 0.41 6.04×10⁻²³ 2.97×10⁻²¹
HBG2 3048 4,458.52 −4.05 0.38 4.57×10⁻²⁶ 3.35×10⁻²⁴
MFSD14A 64645 776.11 −4.19 0.26 5.42×10−59 5.96×10−56
CSH2 1443 61,726.09 −4.23 0.81 1.94×10−07 1.03×10−06
AGTR1 185 664.42 −4.27 0.38 2.85×10⁻²⁹ 3.03×10−27 COX4I2 84701 131.49 −4.28 0.47 1.36×10⁻¹⁹ 4.47×10⁻¹⁸ SVEP1 79987 15,505.08 −4.33 0.46 5.20×10⁻²¹ 2.01×10⁻¹⁹ LYVE1 10894 2,663.78 −4.56 0.34 6.68×10−42 2.23×10−39
CSH1 1442 87,798.80 −4.58 0.67 5.61×10⁻¹² 6.40×10⁻¹¹
AREG 374 710.42 −4.64 0.45 4.88×10⁻²⁵ 3.19×10⁻²³
SPESP1 246777 321.55 −5.11 0.40 1.75×10−36 4.01×10⁻³⁴ RPS10 6204 742.05 −5.28 0.44 3.32×10⁻³³ 5.29×10⁻³¹ CSHL1 1444 2,846.50 −5.43 0.41 2.25×10−40 6.85×10−38 ZC3H11A 9877 2,887.90 −5.95 0.32 4.7×10−76 8.29×10−73 Placenta-specific genes are depicted with bold blue. False discovery rate, pFDR; fold change, FC; log fold change standard error, lfcSE.
Since majority of these placenta-specific genes are most highly expressed in the trophoblast, we wished to learn whether their differential expression may reflect alterations in developmental or functional processes of the trophoblast. Therefore, we examined whether genes involved in villous trophoblast differentiation [19] (Figure2A) are enriched among molar DE genes. However, we found only minimal enrichment (OR=1.15,p=0.006).
Int. J. Mol. Sci. 2019, 20, x FOR PEER REVIEW 7 of 28
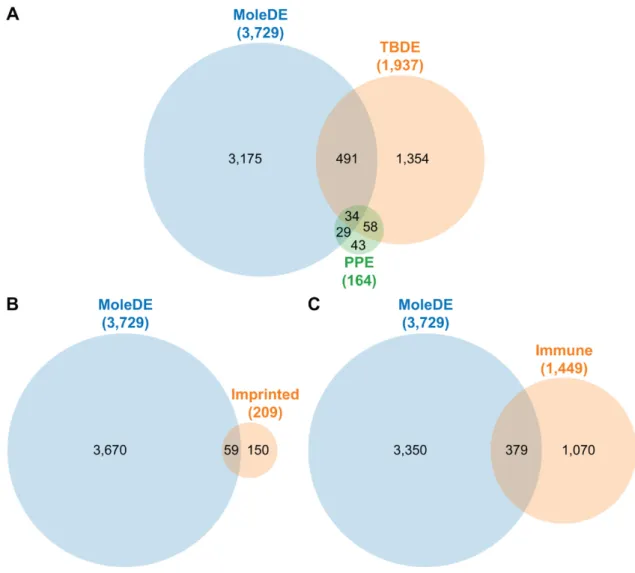
Figure 2. Venn diagrams of gene enrichment in complete hydatidiform moles. (A) Overlap between genes differentially expressed (DE) in complete hydatidiform moles (CHMs; MoleDE), and genes previously shown to have specific expression in the placenta (PPE) or during villous trophoblast differentiation (TBDE). (B) Overlap between genes DE in CHMs and previously described imprinted genes (Imprinted). (C) Overlap between genes DE in CHMs and genes previously shown to be involved in immune-related processes (Immune).
We also analyzed 25 genes that are involved in epigenetic programming (four DNA methyltransferases, three methylcytosine dioxygenases, a cytidine deaminase, and 17 histone demethylases) and found two DNA methylation-related enzymes (DNMT3A, DNA methyltransferase 3 alpha; TET3, Tet methylcytosine dioxygenase 3) and four histone demethylases (KDM4C, lysine demethylase 4C; KDM4D; KDM4E; KDM6B) to be dysregulated in CHMs. DNMT3A, which was down-regulated, is required for genome-wide de novo DNA methylation and parental imprinting [20]. TET3, which was up-regulated, plays a key role in epigenetic reprogramming of the zygotic paternal DNA [21]. All four histone (lysine) demethylases [22] were up-regulated. In addition, there was an enrichment of genes impacted by parental imprinting (Supplementary Table 3, Figure 2B) among DE genes (OR = 2.38, p = 1.54 × 10⁻⁶).
Of note, the DE gene list contained 379 genes involved in immune-related functions (Supplementary Table 4, Figure 2C), of which 278 (73%) were overexpressed in CHMs. Genes contributing to this enrichment (OR = 1.82, p = 7.34 × 10⁻¹⁸) included those encoding several cytokines, chemokines and their receptors (IL1A, interleukin 1 alpha; IL6, IL7, IL8/CXCL8, IL10, IL15, TGFB1, transforming growth factor beta 1; CXCR2, C-X-C chemokine receptor type 2; CXCR4, IL2RB, IL2RG, IL7R, IL15RA, TGFBR1), integrins (e.g., ITGA5, integrin subunit alpha 5; ITGAE, ITGAL, ITGAX, ITGB7, integrin subunit beta 7), and galectins (LGALS4, LGALS13, LGALS14).
Figure 2.Venn diagrams of gene enrichment in complete hydatidiform moles. (A) Overlap between genes differentially expressed (DE) in complete hydatidiform moles (CHMs; MoleDE), and genes previously shown to have specific expression in the placenta (PPE) or during villous trophoblast differentiation (TBDE). (B) Overlap between genes DE in CHMs and previously described imprinted genes (Imprinted). (C) Overlap between genes DE in CHMs and genes previously shown to be involved in immune-related processes (Immune).
We also analyzed 25 genes that are involved in epigenetic programming (four DNA methyltransferases, three methylcytosine dioxygenases, a cytidine deaminase, and 17 histone demethylases) and found two DNA methylation-related enzymes (DNMT3A, DNA methyltransferase 3 alpha;TET3, Tet methylcytosine dioxygenase 3) and four histone demethylases (KDM4C, lysine demethylase 4C;KDM4D;KDM4E;KDM6B) to be dysregulated in CHMs. DNMT3A, which was down-regulated, is required for genome-wide de novo DNA methylation and parental imprinting [20].
TET3, which was up-regulated, plays a key role in epigenetic reprogramming of the zygotic paternal DNA [21]. All four histone (lysine) demethylases [22] were up-regulated. In addition, there was an
enrichment of genes impacted by parental imprinting (Supplementary Table S3, Figure2B) among DE genes (OR=2.38,p=1.54×10⁻⁶).
Of note, the DE gene list contained 379 genes involved in immune-related functions (Supplementary Table S4, Figure2C), of which 278 (73%) were overexpressed in CHMs. Genes contributing to this enrichment (OR=1.82,p=7.34×10⁻¹⁸) included those encoding several cytokines, chemokines and their receptors (IL1A, interleukin 1 alpha;IL6,IL7,IL8/CXCL8,IL10,IL15,TGFB1, transforming growth factor beta 1;CXCR2, C-X-C chemokine receptor type 2;CXCR4,IL2RB,IL2RG,IL7R,IL15RA,TGFBR1), integrins (e.g.,ITGA5, integrin subunit alpha 5;ITGAE,ITGAL,ITGAX,ITGB7, integrin subunit beta 7), and galectins (LGALS4,LGALS13,LGALS14).
2.3. Dysregulated Biological Processes and Pathways in CHMs
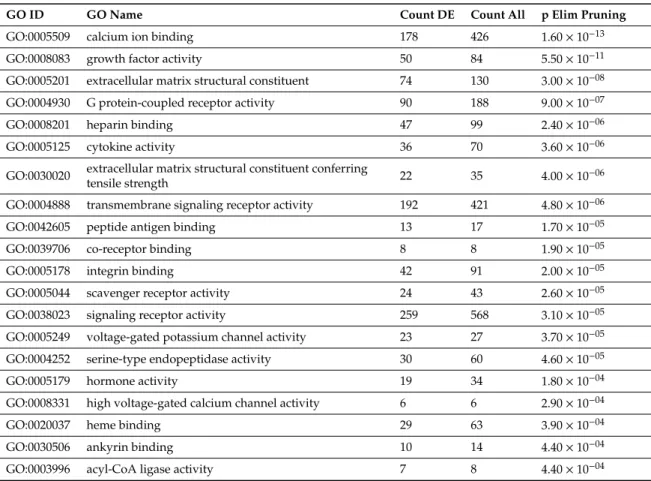
Use of iPathwayGuide to investigate biological processes and pathways dysregulated in CHMs revealed that among 665 gene ontology (GO) biological processes, the most impacted were “cell adhesion”, “biological adhesion”, “multicellular organismal process”, and “signaling” (Supplementary Table S5). Applying Elim pruning that iteratively removes genes mapped to a significant GO term from more general higher level GO terms, identified “calcium ion binding”, “growth factor activity”,
“extracellular matrix structural constituent”, and “G protein-coupled receptor activity” to be the most impacted among 150 dysregulated biological processes (Table4, Supplementary Table S6).
Table 4.Twenty most impacted Gene Ontology biological processes in complete hydatidiform moles.
GO ID GO Name Count DE Count All p Elim Pruning
GO:0005509 calcium ion binding 178 426 1.60×10⁻¹³
GO:0008083 growth factor activity 50 84 5.50×10⁻¹¹
GO:0005201 extracellular matrix structural constituent 74 130 3.00×10−08
GO:0004930 G protein-coupled receptor activity 90 188 9.00×10−07
GO:0008201 heparin binding 47 99 2.40×10−06
GO:0005125 cytokine activity 36 70 3.60×10−06
GO:0030020 extracellular matrix structural constituent conferring
tensile strength 22 35 4.00×10−06
GO:0004888 transmembrane signaling receptor activity 192 421 4.80×10−06
GO:0042605 peptide antigen binding 13 17 1.70×10−05
GO:0039706 co-receptor binding 8 8 1.90×10−05
GO:0005178 integrin binding 42 91 2.00×10−05
GO:0005044 scavenger receptor activity 24 43 2.60×10−05
GO:0038023 signaling receptor activity 259 568 3.10×10−05
GO:0005249 voltage-gated potassium channel activity 23 27 3.70×10−05
GO:0004252 serine-type endopeptidase activity 30 60 4.60×10−05
GO:0005179 hormone activity 19 34 1.80×10−04
GO:0008331 high voltage-gated calcium channel activity 6 6 2.90×10−04
GO:0020037 heme binding 29 63 3.90×10−04
GO:0030506 ankyrin binding 10 14 4.40×10−04
GO:0003996 acyl-CoA ligase activity 7 8 4.40×10−04
Differentially expressed, DE; Gene Ontology, GO.
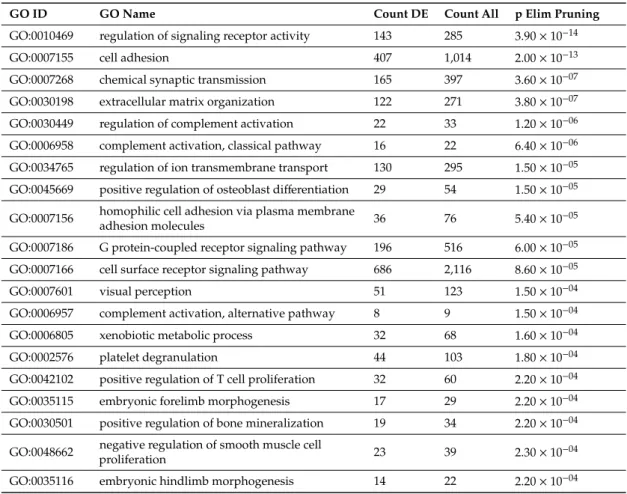
We found the most impacted GO molecular functions to be “signaling receptor activity”, “molecular transducer activity”, and “gated channel activity” among 105 dysregulated molecular functions (Supplementary Table S7). Applying Elim pruning, “regulation of signaling receptor activity”, “cell adhesion”, “chemical synaptic transmission”, and “extracellular matrix organization” were identified as the most impacted among 628 dysregulated molecular functions (Table5, Supplementary Table S8).
Table 5.Twenty most impacted Gene Ontology molecular functions in complete hydatidiform moles.
GO ID GO Name Count DE Count All p Elim Pruning
GO:0010469 regulation of signaling receptor activity 143 285 3.90×10⁻¹⁴
GO:0007155 cell adhesion 407 1,014 2.00×10⁻¹³
GO:0007268 chemical synaptic transmission 165 397 3.60×10−07
GO:0030198 extracellular matrix organization 122 271 3.80×10−07 GO:0030449 regulation of complement activation 22 33 1.20×10−06 GO:0006958 complement activation, classical pathway 16 22 6.40×10−06 GO:0034765 regulation of ion transmembrane transport 130 295 1.50×10−05 GO:0045669 positive regulation of osteoblast differentiation 29 54 1.50×10−05 GO:0007156 homophilic cell adhesion via plasma membrane
adhesion molecules 36 76 5.40×10−05
GO:0007186 G protein-coupled receptor signaling pathway 196 516 6.00×10−05 GO:0007166 cell surface receptor signaling pathway 686 2,116 8.60×10−05
GO:0007601 visual perception 51 123 1.50×10−04
GO:0006957 complement activation, alternative pathway 8 9 1.50×10−04
GO:0006805 xenobiotic metabolic process 32 68 1.60×10−04
GO:0002576 platelet degranulation 44 103 1.80×10−04
GO:0042102 positive regulation of T cell proliferation 32 60 2.20×10−04
GO:0035115 embryonic forelimb morphogenesis 17 29 2.20×10−04
GO:0030501 positive regulation of bone mineralization 19 34 2.20×10−04 GO:0048662 negative regulation of smooth muscle cell
proliferation 23 39 2.30×10−04
GO:0035116 embryonic hindlimb morphogenesis 14 22 2.20×10−04
Differentially expressed, DE; Gene Ontology, GO.
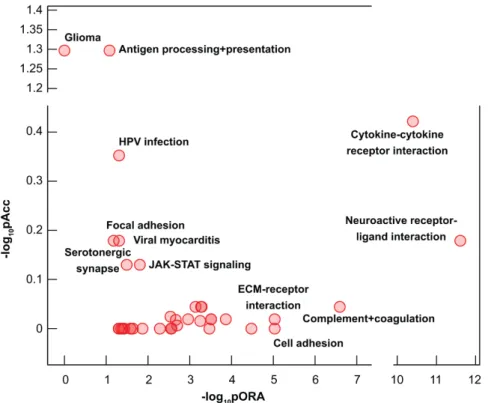
The most impacted Kyoto Encyclopedia of Genes and Genomes (KEGG) pathways included
“cytokine–cytokine receptor interaction”, “cell adhesion molecules”, “protein digestion and absorption”, and “neuroactive ligand–receptor interaction”, all important for placental functions (Table 6, Supplementary Table S9, Figure3). An unanticipated finding was the most extensive dysregulation of
“cytokine–cytokine receptor interaction” pathway (Figure4) and “cell adhesion” pathway, both required for immune cell influx and activation. In addition, representation of 17 immune-related pathways among 38 dysregulated pathways (Table 6, Supplementary Table S9) reflects a strong immune component of molar pathogenesis.
Table 6.Top 20 most impacted pathways in complete hydatidiform moles.
Pathway Name p-value pFDR
Cytokine-cytokine receptor interaction 1.38×10−07 2.31×10−05 Cell adhesion molecules (CAMs) 1.43×10−07 2.31×10−05 Protein digestion and absorption 6.20×10−07 6.68×10−05 Neuroactive ligand-receptor interaction 1.32×10−06 1.07×10−04 Complement and coagulation cascades 6.91×10−06 4.46×10−04 Hypertrophic cardiomyopathy (HCM) 1.05×10−05 4.87×10−04 Extracellular matrix (ECM)-receptor interaction 1.06×10−05 4.87×10−04 Autoimmune thyroid disease 2.91×10−05 1.17×10−03
Allograft rejection 7.36×10−05 2.39×10−03
Graft-versus-host disease 8.01×10−05 2.39×10−03 Antigen processing and presentation 8.15×10−05 2.39×10−03 Intestinal immune network for IgA production 9.94×10−05 2.68×10−03 Staphylococcus aureus infection 1.18×10−04 2.94×10−03 Metabolism of xenobiotics by cytochrome P450 1.64×10−04 3.63×10−03 Hematopoietic cell lineage 1.73×10−04 3.63×10−03
Immune-related pathways are shown in bold blue. False discovery rate, pFDR.
Int. J. Mol. Sci. 2019, 20, x FOR PEER REVIEW 10 of 28
Table 6. Top 20 most impacted pathways in complete hydatidiform moles.
Pathway Name p-value pFDR
Cytokine-cytokine receptor interaction 1.38 × 10-07 2.31 × 10-05 Cell adhesion molecules (CAMs) 1.43 × 10-07 2.31 × 10-05 Protein digestion and absorption 6.20 × 10-07 6.68 × 10-05 Neuroactive ligand-receptor interaction 1.32 × 10-06 1.07 × 10-04 Complement and coagulation cascades 6.91 × 10-06 4.46 × 10-04 Hypertrophic cardiomyopathy (HCM) 1.05 × 10-05 4.87 × 10-04 Extracellular matrix (ECM)-receptor interaction 1.06 × 10-05 4.87 × 10-04 Autoimmune thyroid disease 2.91 × 10-05 1.17 × 10-03 Allograft rejection 7.36 × 10-05 2.39 × 10-03 Graft-versus-host disease 8.01 × 10-05 2.39 × 10-03 Antigen processing and presentation 8.15 × 10-05 2.39 × 10-03 Intestinal immune network for IgA production 9.94 × 10-05 2.68 × 10-03 Staphylococcus aureus infection 1.18 × 10-04 2.94 × 10-03 Metabolism of xenobiotics by cytochrome P450 1.64 × 10-04 3.63 × 10-03 Hematopoietic cell lineage 1.73 × 10-04 3.63 × 10-03 Immune-related pathways are shown in bold blue. False discovery rate, pFDR.
Figure 3. Pathways perturbation vs. over-representation in complete hydatidiform moles. Pathways are plotted according to two types of evidence computed by iPathwayGuide: over-representation on the x-axis (pORA) and the total pathway accumulation on the y-axis (pAcc). For both measures p- values are displayed on the negative log (base 10) scale. Extracellular matrix, ECM; human papilloma virus, HPV; Janus kinase, JAK; signal transducer and activator of transcription, STAT.
Figure 3.Pathways perturbation vs. over-representation in complete hydatidiform moles. Pathways are plotted according to two types of evidence computed by iPathwayGuide: over-representation on the x-axis (pORA) and the total pathway accumulation on the y-axis (pAcc). For both measuresp-values are displayed on the negative log (base 10) scale. Extracellular matrix, ECM; human papilloma virus, HPV; Janus kinase, JAK; signal transducer and activator of transcription, STAT.
Int. J. Mol. Sci. 2019, 20, x FOR PEER REVIEW 11 of 28
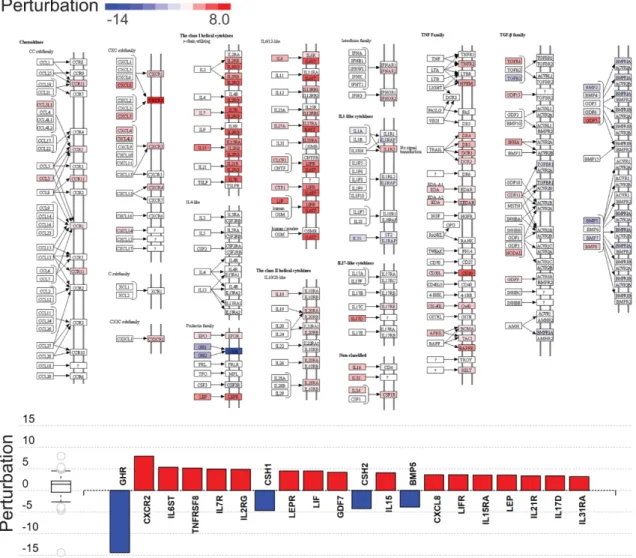
Figure 4. Cytokine–cytokine receptor interaction perturbation in complete hydatidiform moles. Top:
The Kyoto Encyclopedia of Genes and Genomes (KEGG) pathway diagram (KEGG: 04060) is overlaid with the computed perturbation of each gene. Estimates of perturbation account for both for the genes′
measured fold change and for the accumulated perturbation propagated from any upstream genes (accumulation). The highest negative perturbation is shown in dark blue, and the highest positive perturbation in dark red. The legend describes values on the gradient. Bottom: Gene perturbation bar plot. All genes in the cytokine–cytokine receptor interaction pathway (KEGG: 04060) are ranked according to absolute perturbation values, negative values depicted in blue and positive values in red.
The box and whisker plot on the left summarizes the distribution of all gene perturbations in this pathway, the box representing the first quartile, median and third quartile, while circles represent outliers.
2.4. Validation of RNA-Seq Results at the Protein Level
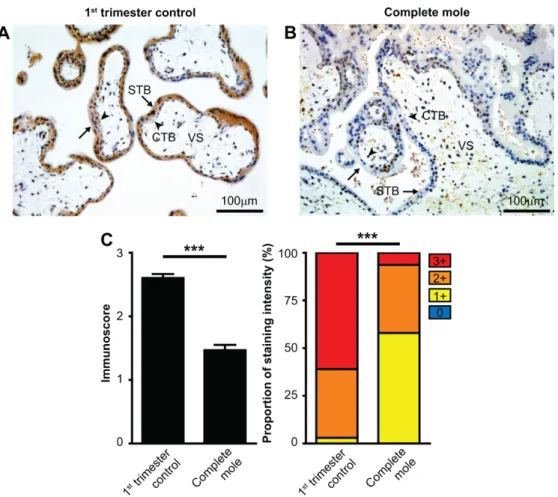
First, we immunostained TMA slides for cyclin-dependent kinase inhibitor p57 (p57) expression to confirm the histopathology diagnosis of CHM at the molecular level. Out of 26 samples with the histopathology diagnosis of CHM, we detected cytotrophoblastic p57 staining in three samples, while 23 (88%) samples were devoid of p57 expression (Supplementary Figure 1), confirming the histopathological diagnosis of CHM in 23 samples. For validation of RNA-level findings, we conducted immunostaining of galectin-14 (gal-14), which is encoded by LGALS14, one of the genes most down-regulated in CHMs according to our RNA-Seq study. Average gal-14 immunoscores were 43% lower in CHMs than in gestational age-matched controls (1.47 ± 0.08 and 2.60 ± 0.06, respectively, p < 0.001). Additionally, the percentage of low-intensity staining (1+) was higher in molar than in control tissues (58% and 3%, respectively), while the percentage of high-intensity staining (3+) was
Figure 4.Cytokine–cytokine receptor interaction perturbation in complete hydatidiform moles.Top:
The Kyoto Encyclopedia of Genes and Genomes (KEGG) pathway diagram (KEGG: 04060) is overlaid with the computed perturbation of each gene. Estimates of perturbation account for both for the genes0 measured fold change and for the accumulated perturbation propagated from any upstream genes (accumulation). The highest negative perturbation is shown in dark blue, and the highest positive perturbation in dark red. The legend describes values on the gradient. Bottom: Gene perturbation bar plot. All genes in the cytokine–cytokine receptor interaction pathway (KEGG: 04060) are ranked according to absolute perturbation values, negative values depicted in blue and positive values in red. The box and whisker plot on the left summarizes the distribution of all gene perturbations in this pathway, the box representing the first quartile, median and third quartile, while circles represent outliers.
2.4. Validation of RNA-Seq Results at the Protein Level
First, we immunostained TMA slides for cyclin-dependent kinase inhibitor p57 (p57) expression to confirm the histopathology diagnosis of CHM at the molecular level. Out of 26 samples with the histopathology diagnosis of CHM, we detected cytotrophoblastic p57 staining in three samples, while 23 (88%) samples were devoid of p57 expression (Supplementary Figure S1), confirming the histopathological diagnosis of CHM in 23 samples. For validation of RNA-level findings, we conducted immunostaining of galectin-14 (gal-14), which is encoded byLGALS14, one of the genes most down-regulated in CHMs according to our RNA-Seq study. Average gal-14 immunoscores were
43% lower in CHMs than in gestational age-matched controls (1.47±0.08 and 2.60±0.06, respectively, p<0.001). Additionally, the percentage of low-intensity staining (1+) was higher in molar than in control tissues (58% and 3%, respectively), while the percentage of high-intensity staining (3+) was lower in molar than in control tissues (6% and 61%, respectively), resulting in a significant difference in the distribution of gal-14 immunoscores (p<0.001), consistent with RNA-Seq results for this locus (Figure5).
Int. J. Mol. Sci. 2019, 20, x FOR PEER REVIEW 12 of 28
lower in molar than in control tissues (6% and 61%, respectively), resulting in a significant difference in the distribution of gal-14 immunoscores (p < 0.001), consistent with RNA-Seq results for this locus (Figure 5).
Figure 5. Differential expression of galectin-14 in syncytiotrophoblast in complete hydatidiform moles and first trimester control placentas. Five-µm-thick first trimester placental sections from normal pregnancy (A) or from CHMs (B) were stained for galectin-14 (gal-14). Chorionic villi exhibited intense syncytiotrophoblast cytoplasmic staining (arrows), while the villus stroma and cytotrophoblasts were negative (arrowheads) in normal placentas, and the syncytiotrophoblast layer had weak staining in CHMs. Representative images, hematoxylin counterstain, 200× magnifications. (C) Gal-14 immunoscores (mean ± SEM) and proportion of staining intensities in control placentas (n = 29) and CHMs (n = 23) are displayed on the left and right graphs, respectively. An unpaired t-test was used to compare mean immunoscores between control and CHM groups. Fisher’s exact test was used to test the difference in frequency of gal-14 immunostaining between the two groups. *** p < 0.001.
Cytotrophoblast, CTB; syncytiotrophoblast, STB; villous stroma, VS.
3. Discussion
3.1. Principal Findings of This Study
High-dimensional transcriptomic analysis identified numerous distinctions between CHM and normal placenta, from which noteworthy patterns can be discerned. 1) the most highly expressed genes in first trimester normal placentas are those previously shown to have placenta-specific or predominantly placental expression; 2) in CHMs, overall gene expression levels are higher, while expression of placenta-specific transcripts are lower than in first trimester normal placentas; 3) the pathogenesis of CHMs involves the dysregulation of 27% of protein-coding genes expressed in both normal placentas and CHMs; 4) most DE genes (72%) in CHMs are up-regulated; 5) placental functions appear to be down-regulated in CHMs, since placenta-specific genes are enriched in DE
Figure 5. Differential expression of galectin-14 in syncytiotrophoblast in complete hydatidiform moles and first trimester control placentas. Five-µm-thick first trimester placental sections from normal pregnancy (A) or from CHMs (B) were stained for galectin-14 (gal-14). Chorionic villi exhibited intense syncytiotrophoblast cytoplasmic staining (arrows), while the villus stroma and cytotrophoblasts were negative (arrowheads) in normal placentas, and the syncytiotrophoblast layer had weak staining in CHMs. Representative images, hematoxylin counterstain, 200×magnifications.
(C) Gal-14 immunoscores (mean±SEM) and proportion of staining intensities in control placentas (n=29) and CHMs (n=23) are displayed on the left and right graphs, respectively. An unpaired t-test was used to compare mean immunoscores between control and CHM groups. Fisher’s exact test was used to test the difference in frequency of gal-14 immunostaining between the two groups. ***p<0.001.
Cytotrophoblast, CTB; syncytiotrophoblast, STB; villous stroma, VS.
3. Discussion
3.1. Principal Findings of This Study
High-dimensional transcriptomic analysis identified numerous distinctions between CHM and normal placenta, from which noteworthy patterns can be discerned. (1) the most highly expressed genes in first trimester normal placentas are those previously shown to have placenta-specific or predominantly placental expression; (2) in CHMs, overall gene expression levels are higher, while