.. ..
.. ..
.. ..
.. ..
Identification of optimal reference genes for transcriptomic analyses in normal and
diseased human heart
Cristina E. Molina
1,2,3, Eric Jacquet
4, Prishila Ponien
4, Christian Mu~ noz-Guijosa
5, Istvan Baczko ´
6, Lars S. Maier
7, Patrick Donzeau-Gouge
8, Dobromir Dobrev
9, Rodolphe Fischmeister
1*, and Anne Garnier
11Inserm, UMR-S 1180, University of Paris-Sud, Universite´ Paris-Saclay, Chaˆtenay-Malabry, France;2Institute of Pharmacology and Toxicology, Heart Research Center Go¨ttingen, University Medical Center, Georg-August University Go¨ttingen, Germany;3German Center for Cardiovascular Research (DZHK), Partner Site Go¨ttingen, Germany;4Institut de Chimie des Substances Naturelles, UPR 2301, CNRS, University of Paris-Sud, Universite´ Paris-Saclay, Gif-sur-Yvette, France;5Cardiac Surgery Department, Hospital de la Santa Creu i Sant Pau, Spain;6Department Pharmacology and Pharmacotherapy, University of Szeged, Hungary;7Department Internal Medicine II, University Heart Center, University Hospital Regensburg, Regensburg, Germany;
8Institut Hospitalier Jacques Cartier, F-91300 Massy, France; and9West German Heart and Vascular Center, Institute of Pharmacology, University Duisburg-Essen, Essen, Germany Received 10 April 2017; revised 6 August 2017; editorial decision 1 September 2017; accepted 20 September 2017; online publish-ahead-of-print 22 September 2017
Time for primary review: 35 days
This manuscript was handled by a Consulting Editor.
Aims Quantitative real-time RT-PCR (RT-qPCR) has become the method of choice for mRNA quantification, but re- quires an accurate normalization based on the use of reference genes showing invariant expression across various pathological conditions. Only few data exist on appropriate reference genes for the human heart. The objective of this study was to determine a set of suitable reference genes in human atrial and ventricular tissues, from right and left cavities in control and in cardiac diseases.
...
Methods and results
We assessed the expression of 16 reference genes (ACTB, B2M, GAPDH, GUSB, HMBS, HPRT1, IPO8, PGK1, POLR2A, PPIA, RPLP0, TBP, TFRC, UBC, YWHAZ, 18S) in tissues from: right and left ventricles from healthy controls and heart failure (HF) patients; right-atrial tissue from patients in sinus rhythm with (SRd) or without (SRnd) atrial dilatation, patients with paroxysmal (pAF) or chronic (cAF) atrial fibrillation or with HF; and left-atrial tissue from patients in SR or cAF. Consensual analysis (by geNorm and Normfinder algorithms, BestKeeper software tool and comparative delta-Ct method) of the variability scores obtained for each reference gene expression shows that the most stably expressed genes are:GAPDH, GUSB,IPO8,POLR2A, andYWHAZ when comparing either right and left ventricle or ventri- cle from healthy controls and HF patients; GAPDH, IPO8, POLR2A, PPIA, andRPLP0when comparing either right and left atrium or right atria from all pathological groups.ACTB, TBP, TFRC, and18Sgenes were identified as the least stable.
...
Conclusions The overall most stable reference genes across different heart cavities and disease conditions wereGAPDH, IPO8, POLR2Aand PPIA.YWHAZ orGUSBcould be added to this set for some specific experiments. This study should provide useful guidelines for reference gene selection in RT-qPCR studies in human heart.
䊏 䊏 䊏 䊏 䊏 䊏 䊏 䊏 䊏 䊏 䊏 䊏 䊏 䊏 䊏 䊏 䊏 䊏 䊏 䊏 䊏 䊏 䊏 䊏 䊏 䊏 䊏 䊏 䊏 䊏 䊏 䊏 䊏 䊏 䊏 䊏 䊏 䊏 䊏 䊏 䊏 䊏 䊏 䊏 䊏 䊏 䊏 䊏 䊏 䊏 䊏 䊏 䊏 䊏 䊏 䊏 䊏 䊏 䊏 䊏 䊏 䊏 䊏 䊏 䊏 䊏 䊏 䊏 䊏 䊏 䊏 䊏 䊏 䊏 䊏 䊏 䊏 䊏 䊏 䊏 䊏 䊏 䊏 䊏 䊏 䊏 䊏 䊏 䊏 䊏 䊏 䊏 䊏 䊏 䊏 䊏 䊏 䊏 䊏 䊏 䊏 䊏 䊏 䊏 䊏 䊏 䊏 䊏 䊏 䊏 䊏 䊏 䊏 䊏 䊏 䊏 䊏 䊏 䊏 䊏 䊏 䊏 䊏 䊏 䊏 䊏 䊏 䊏 䊏 䊏 䊏 䊏 䊏 䊏 䊏 䊏 䊏 䊏 䊏 䊏 䊏 䊏 䊏 䊏 䊏 䊏 䊏 䊏 䊏 䊏 䊏 䊏 䊏 䊏 䊏 䊏 䊏 䊏 䊏 䊏 䊏 䊏 䊏 䊏 䊏 䊏 䊏 䊏 䊏 䊏 䊏 䊏 䊏 䊏 䊏 䊏 䊏 䊏 䊏 䊏 䊏 䊏 䊏 䊏 䊏 䊏 䊏 䊏 䊏 䊏 䊏 䊏 䊏 䊏 䊏 䊏 䊏 䊏 䊏 䊏 䊏 䊏 䊏 䊏 䊏 䊏 䊏 䊏 䊏 䊏 䊏 䊏
Keywords Human heart
•
Heart failure•
Atrial fibrillation•
Quantitative real-time polymerase chain reaction•
Reference genes•
Ventricle•
Atrium1. Introduction
The four chambers of a healthy heart are characterized by specific ge- netic, anatomic, metabolic, physiologic, and electric features. For example, right (RV) and left ventricles (LVs) have different mass, volume, morphol- ogy and pressures.1,2Morphological differences also exist between the
right and left atrium.3Additionally, there are chamber-specific differences in electrophysiological properties4,5including different action potential parameters due to specific expression patterns and function of ion chan- nels.6,7Accordingly, regional heterogeneity between left and right heart chambers also exists for the expression of many genes,6,8–13 microRNAs,14as well as frequently used housekeeping genes.15
* Corresponding author. Tel:þ33 1 46 83 57 71; fax:þ33 1 46 83 54 75, E-mail: rodolphe.fischmeister@inserm.fr
Published on behalf of the European Society of Cardiology. All rights reserved.VCThe Author 2017. For permissions, please email: journals.permissions@oup.com.
.. ..
.. ..
.. ..
.. ..
.. ..
.. ..
.. ..
.. ..
.. ..
.. ..
.. ..
.. ..
.. ..
.. ..
.. ..
.. ..
.. ..
.. ..
.. ..
.. ..
.. ..
.. ..
.. ..
.. ..
.. ..
.. ..
.. ..
.. ..
.. ..
.. ..
.. ..
.. ..
.. ..
.. ..
.. ..
.. ..
.. ..
.. ..
.. ..
.. ..
.. ..
.. ..
.. ..
.. ..
.. .
Atrial fibrillation (AF) and heart failure (HF) are common cardiac dis- orders associated with significant morbidity, mortality, and a growing public health cost.16–18AF- and HF-related remodelling processes are as- sociated with profound genetic, structural and functional alterations19–22 which differ between left and right heart chambers.23–25Although AF is considered to predominantly occur in the left atrium, recent data by Karapinaret al.26showed profound changes in the electrical properties in the right atrium of paroxysmal atrial fibrillation (pAF) patients pointing to specific remodelling in the right atrium of these patients.b-adreno- ceptor (b-AR) blockers are a well-established therapy for HF, but the b-AR response may differ between left and right ventricles.5
Although there is clear evidence that altered gene transcription con- tributes to the pathological cardiac remodelling leading to AF or HF, the precise mechanisms of altered gene transcription are not completely un- derstood. In this context, gene expression profiling of the human heart has become an essential step to study in-depth the molecular regulatory networks that underlie chamber-specific differences between healthy and diseased hearts. Quantitative real-time polymerase chain reaction (RT-qPCR) is the most sensitive and accurate technique to simulta- neously amplify and quantify gene expression by measuring the incre- ment of fluorescence in each PCR cycle. However, PCR readouts need an accurate normalization with internal reference genes whose expres- sion has to be stable27and independent of the experimental groups or remodelling processes. Glyceraldehyde-3-phosphate dehydrogenase (GAPDH), 18S ribosomal RNA (18S),b-actin (ACTB) orb2-microglobulin (B2M) have been used extensively as reference genes in RT-qPCR for heart samples.28–31Yet, a number of studies have demonstrated that the expression of some of these classically used housekeeping genes vary sig- nificantly according to the species, experimental model, disease condi- tion, tissue type, etc.30,32–35In human heart, a recent study used human HF samples to select stable housekeeping genes for normalizing gene ex- pression data between HF left and right ventricles,36but no optimal set of reference genes has been identified so far for normalizing gene ex- pression data across right and left atria or for comparing the different cardiac cavities in healthy and diseased states.
The aim of this study was to assess the expression of 16 classical genes used as housekeeping genes (ACTB,B2M,GAPDH,b-D-glucuronidase (GUSB), hydroxymethylbilane synthase (HMBS), hypoxanthine phos- phoribosyltransferase 1 (HPRT1), importin 8 (IPO8), phosphoglycerate kinase 1 (PGK1), RNA polymerase II subunit A (POLR2A), peptidylprolyl isomerase A (PPIA), ribosomal protein lateral stalk subunit P0 (RPLP0), TATA box binding protein (TBP), transferrin receptor (TFRC), ubiquitin C (UBC), tyrosine 3-monooxygenase/tryptophan 5-monooxygenase ac- tivation protein zeta (YWHAZ) and 18S ribosomal RNA (18S)) and to se- lect a set of reference genes that can be reliably used for normalization of RT-qPCR experiments in atrial and ventricular tissues from left and right cavities of healthy subjects or patients with AF or HF. A combined analysis of the results using GeNorm35and NormFinder37algorithms, the BestKeeper38software tool and the comparative Delta-Ct method39 was performed to strengthen and validate the selection of the top- ranking reference genes in order to propose an optimal set of reference genes across the different heart cavities and cardiac diseases.
2. Methods
2.1 Selection of candidate reference genes
For this study, we used the TaqMan Human Endogenous Control Arrays (Applied Biosystems, Life Technologies, France) which contain
commonly used housekeeping genes that exhibit minimal differential ex- pression across many different tissues:ACTB, B2M, GAPDH, GUSB, HMBS, HPRT1, IPO8, PGK1, POLR2A, PPIA, RPLP0, TBP, TFRC, UBC, YWHAZ, 18S.
Each array includes three replicates per gene and per sample.
2.2 Human tissue samples used for selection of reference genes
A total of 44 human heart tissue samples were collected from a total of 36 patients undergoing cardiac surgery either at the Institut Hospitalier Jacques Cartier, Massy, France, at the Cardiac Surgery Department, Hospital de la Santa Creu i Sant Pau, Universitat Auto`noma de Barcelona, Spain, at the Abt. Kardiologie und Pneumologie, Georg- August-Universitaet Go¨ttingen, Germany, or at the Department of Pharmacology and Pharmacotherapy, University of Szeged, Hungary. 28 specimens of atrial appendages were obtained from 28 patients sub- jected to atrial cannulation for extracorporal circulation. Permission to use atrial tissue samples that would normally be discarded during cardiac surgery was obtained from each patient. Healthy control (CT) and failing (HF) RV and LV tissues were collected respectively from 4 healthy and 4 failing explanted human hearts at the time of the extraction. All samples were immediately frozen in liquid nitrogen and stored at -80C. Details regarding the clinical characteristics of the patients and their treatments are shown inTable1.
The study was conducted in accordance with the Declaration of Helsinki principles, and approved by the Ethical Committees of our insti- tutions. All protocols for obtaining human cardiac tissue were approved by the Ethical Committees and informed consent was obtained before cardiac surgery.
2.3 Human tissue samples used for validation of the preselected reference genes
A selection of the above described human heart samples was used to measure expression of two target genes, protein phosphatase 2 catalytic subunit alpha isoform (PPP2CA) in atrial samples and adenylate cyclase type V (ADCY5)in ventricular samples, and validate the proposed set of reference genes.Table1summarizes the clinical characteristics of the subset of patients used in this study. Thus, a total of 15 atrial samples from patients subjected to atrial cannulation during surgery and 7 ven- tricular samples from explanted human hearts were used for this part of the study.
2.4 RNA isolation and cDNA synthesis
Frozen tissue samples were weighed and placed in pre-cooled tubes containing TRIzol reagent (Invitrogen, Life Technologies, France) and rapidly subjected to automated grinding in a Bertin Precellys 24 (Bertin Technologies, France). Total RNA extraction was carried out using stan- dard procedure according to the manufacturer’s instructions. RNA con- centration and purity were evaluated by optical density (OD) (Biophotometer, Eppendorf, BioServ, France) and the integrity of the RNA samples were analyzed on a Bioanalyzer 2100 with the RNA6000 Nano Labchip Kit (Agilent Technologies, Santa Clara, CA, USA). The RNA integrity number (RIN) was calculated by the instrument software.
First strand cDNA synthesis was performed from 2lg of total RNA with random primers and MultiScribe Reverse Transcriptase according to the provided protocol (Applied Biosystems, Life Technologies, France). To minimize intergroup variations, samples of each experimental group were processed simultaneously.
.. ..
.. ..
.. ..
.. ..
.. ..
.. ..
.. ..
.. ..
2.5 Real-time qPCR and quantification ..
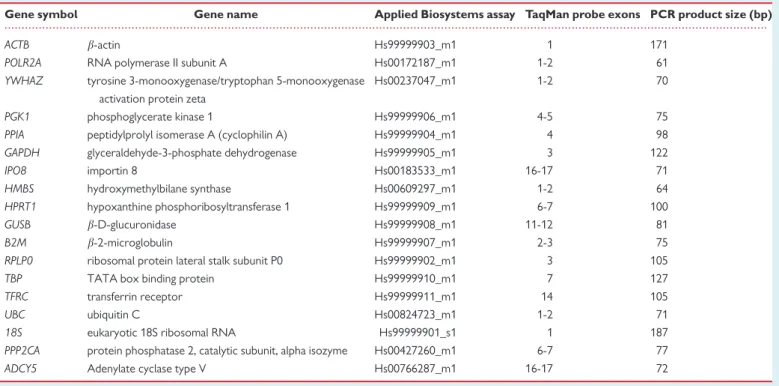
Real-time PCR assays were performed using TaqMan 384-well microflui- dic card technology from Applied Biosystems (TaqMan Array Card or TAC, Life Technologies, France) and the TaqMan Human Endogenous Control Panel. These TAC were designed to study the expression stabil- ity of 16 potential reference genes (Table2). As mentioned earlier, the 16 reference genes were chosen by their common use as endogenous control genes. Each PCR reaction was performed on 4 ng of cDNA in a volume of 1ml. The thermal cycling conditions for PCR amplification on TAC were 10 min at 94.5C, followed by 40 cycles of 30 s at 97C and 1 min at 59.7C, on a ABI-Prism 7900HT Sequence Detection
Instrument (Applied Biosystems, Life Technologies, France). Each TaqMan assay was previously validated by Applied Biosystems and the efficiency of amplification was certified to be superior to 90% by the sup- plier. Experiments were performed in triplicate for each sample.
2.6 Evaluation of candidate reference genes
Reference gene expression variability was evaluated by using a combined analysis of geNorm, Normfinder, BestKeeper and Delta-Ct method. In a real time PCR assay a positive reaction is detected by accumulation of a fluorescent signal. The Ct (cycle threshold) is defined as the number of cycles required for the fluorescent signal to reach a define threshold.
... ... ...
...
Table 1Clinical characteristics of patients Age media
6S.E.M.
Gender (n) Surgery (n) Treatment regimens (n) F M AVS MVS CABG CTr CD b-blockers Calcium
antagonists ACE inhibitors
Diuretics Statins
RA SRnd* 64 ± 5.8 1 3 1 0 4 0 0 2 0 3 0 1
SRd* 69 ± 6.5 3 1 1 1 1 0 0 2 1 3 1 1
pAF* 78 ± 3.6 0 4 2 0 3 0 0 3 0 1 1 1
cAF* 73 ± 3.1 0 4 2 1 2 0 0 2 1 2 3 0
HF 71 ± 5.6 0 4 1 2 2 0 0 2 0 2 2 3
LA SRnd 69 ± 3.8 0 4 2 0 1 0 0 1 1 2 2 1
AFc 69 ± 2 2 2 2 4 1 0 0 3 0 2 3 0
RV* and LV CT* 44 ± 4.6 2 2 0 0 0 0 4 0 0 0 0 0
HF* 59 ± 3.8 2 2 0 0 0 4 0 3 0 4 4 2
AVS, aortic valve surgery; MVS, mitral valve surgery; CABG, coronary artery bypass graft; CTr, cardiac transplantation; CD, cerebral death. Some included patients were submitted to valve surgery and coronary artery bypass graft surgery. RA, right atrium; LA, left atrium; RV, right ventricle; and LV, left ventricle. SRnd, Sinus Rhythm without atrium dilatation;
SRd, Sinus Rhythm with atrium dilatation; pAF, paroxysmal atrial fibrillation; cAF, chronic atrial fibrillation; HF, Heart Failure and CT, Healthy controls. *indicate the samples that were used to measure expression of two target genes.
...
Table 2TaqMan assays used for RT-qPCR amplification
Gene symbol Gene name Applied Biosystems assay TaqMan probe exons PCR product size (bp)
ACTB b-actin Hs99999903_m1 1 171
POLR2A RNA polymerase II subunit A Hs00172187_m1 1-2 61
YWHAZ tyrosine 3-monooxygenase/tryptophan 5-monooxygenase activation protein zeta
Hs00237047_m1 1-2 70
PGK1 phosphoglycerate kinase 1 Hs99999906_m1 4-5 75
PPIA peptidylprolyl isomerase A (cyclophilin A) Hs99999904_m1 4 98
GAPDH glyceraldehyde-3-phosphate dehydrogenase Hs99999905_m1 3 122
IPO8 importin 8 Hs00183533_m1 16-17 71
HMBS hydroxymethylbilane synthase Hs00609297_m1 1-2 64
HPRT1 hypoxanthine phosphoribosyltransferase 1 Hs99999909_m1 6-7 100
GUSB b-D-glucuronidase Hs99999908_m1 11-12 81
B2M b-2-microglobulin Hs99999907_m1 2-3 75
RPLP0 ribosomal protein lateral stalk subunit P0 Hs99999902_m1 3 105
TBP TATA box binding protein Hs99999910_m1 7 127
TFRC transferrin receptor Hs99999911_m1 14 105
UBC ubiquitin C Hs00824723_m1 1-2 71
18S eukaryotic 18S ribosomal RNA Hs99999901_s1 1 187
PPP2CA protein phosphatase 2, catalytic subunit, alpha isozyme Hs00427260_m1 6-7 77
ADCY5 Adenylate cyclase type V Hs00766287_m1 16-17 72
.. ..
.. ..
.. ..
.. ..
.. ..
.. ..
.. ..
.. ..
.. ..
.. ..
.. ..
.. ..
.. ..
.. ..
.. ..
.. ..
.. ..
.. ..
.. ..
.. ..
.. ..
.. ..
.. ..
.. ..
.. ..
.. ..
.. ..
.. ..
.. ..
.. ..
.. ..
.. ..
.. ..
.. ..
.. ..
.. ..
.. ..
.. ..
.. ..
.. ..
.. ..
.. ..
.. ..
.. ..
.. .
Ct levels are inversely proportional to the amount of target nucleic acid in the sample. Ct is specific to the expression of one gene whereas Delta Ct shows the difference of expression between two genes. ThisDCt ap- proach can be used to study the stability of candidate housekeeping genes by comparing the relative expression of ‘pairs of genes’ within each sample.39GeNorm algorithm ranks the candidate reference genes by an expression stability measurement called M-value which is the aver- age pairwise variation of a particular gene with all the other reference genes.35The most stable genes are the ones with the lowest M-value.
NormFinder algorithm also ranks the set of candidate normalization genes according to their expression stability and it can also take informa- tion of samples grouping to define intra- and inter-group variations for each candidate reference gene. The result is an optimum rank of refer- ence genes.37BestKeeper determines the most stably expressed genes based on the coefficient of correlation to the BestKeeper Index, which is the geometric mean of the candidate reference gene Ct values.
BestKeeper also calculates the standard deviation (SD) so that the best reference genes are those with the lowest SD and coefficient of variation (CV) based on the Ct values of all candidate reference genes.38 Following these four analyses, each candidate reference gene obtained a specific ranking value. A consensual analysis was finally performed by the calculation of the geometric mean of the four ranking values for each gene leading to a consensus variability score for each reference gene.40
PPP2CAandADCY5were selected to confirm the appropriate refer- ence genes pool by measuring their relative expression levels. TaqMan Array Cards were also used to perform real-time PCR experiments un- der the same experimental conditions and with the subset of samples in- dicated inTable1. For each group, an average Ct was calculated. The average Ct of the control groups, Sinus Rhythm without atrium dilatation (SRnd) and CT, was used as calibrator for the atria and ventricles, re- spectively. The determination of the relative gene expression ratio was achieved using theDDCt method, i.e. it is calculated by referring to the calibrator and normalized by a housekeeping gene or the geometric mean of a set of stable housekeeping genes.
2.7 Statistical analysis
Results are expressed as mean ± SEM. For statistical evaluation of two sets of data Mann-Whitney test was used. Kruskal-Wallis test was used for multiple comparisons to evaluate the significance between groups. A difference was considered statistically significant whenP< 0.05.
3. Results
3.1 Total RNA sample concentration and quality
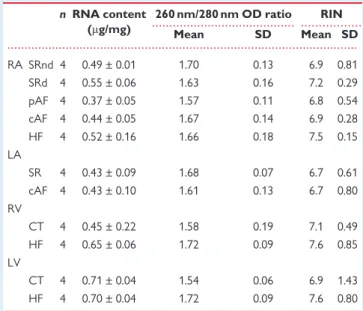
Total RNA content, 260/280 nm OD ratio and RIN obtained in the four human cardiac cavities under normal or pathological conditions are sum- marized inTable3. There were no differences in RNA content between the groups neither in the atria nor in the ventricles, or between atria and ventricles. The quality control parameters for human total RNA samples were similar regardless of human heart tissue sample collection, with no difference between the groups. The 260/280 nm OD ratios appeared relatively low (range of 1.5–1.7), but the RIN values were consistent and comparable within different heart cavities and cardiac diseases, with an overall average of 7.1.
3.2 Selection of candidate reference genes
Using RT-qPCR, we evaluated simultaneously the expression of 16 refer- ence gene candidates on the 44 human heart tissue samples (Table1).
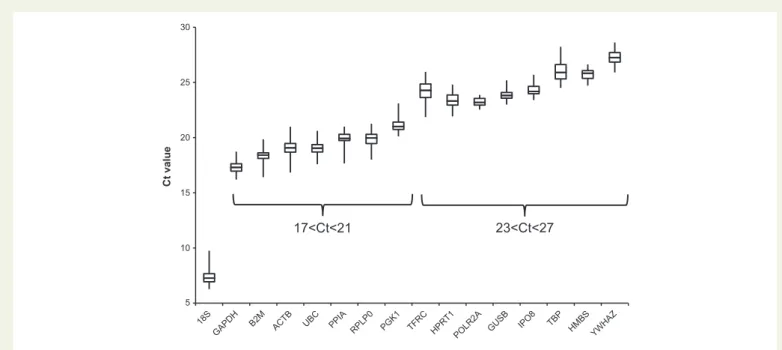
Figure1illustrates the variation in candidate reference gene abundance across all samples. For sake of clarity, the reference genes are ordered by their respective abundance. This first analysis showed as expected the dominance of18SrRNA transcripts compared with the other reference genes. The other reference genes were separated into two groups ac- cording to their abundance: (i)ACTB, B2M, GAPDH, PGK1, PPIA, RPLP0, andUBC, with a median Ct value from 17 to 21; (ii)GUSB, HMBS, HPRT1, IPO8, POLR2A, TBP, TFRC, andYWHAZwith a median Ct value from 23 to 27. We found that some genes had a high variability in expression, e.g.
18S, ACTB, B2M, TBP, andTFRC, whereas others were more stable, e.g.
HMBSandPOLR2A. So, based on their relative abundance and steady ex- pression across all the samples, a pre-selection of candidate reference genes could be considered.
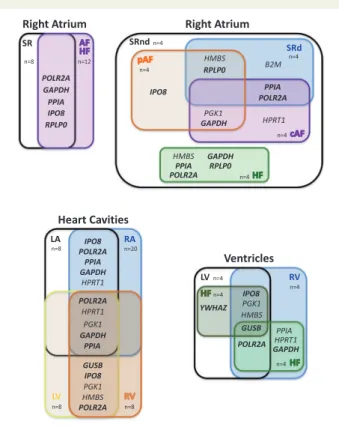
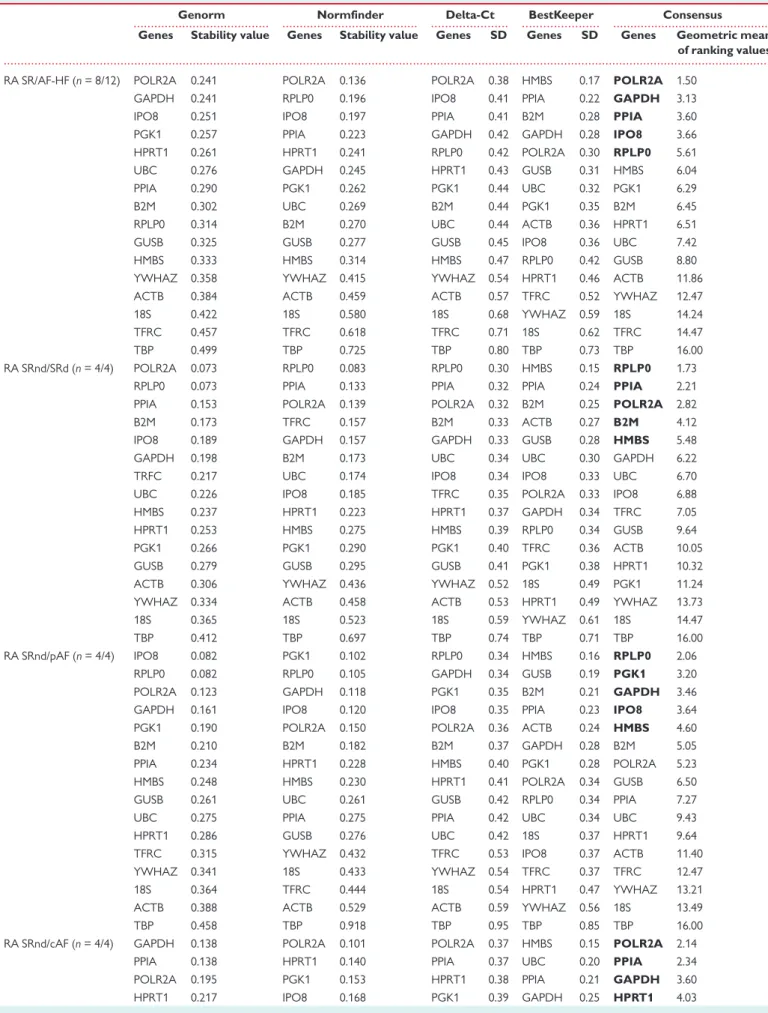
We then performed a combined statistical analysis of the candidate ref- erence gene variability by taking into account the results from the geNorm and NormFinder algorithms, the comparative Delta-Ct method and the BestKeeper software tool. The overall rank order of the most sta- ble reference genes is shown inTable4for different comparisons across heart cavities and disease conditions. We summarized these results using a gene oblong chart to illustrate more easily the set of five reference genes that is the most suitable for normalizing gene expression data according to the considered heart cavity and cardiac disease (Figure2).
Concerning the right atrium, a first analysis including 20 patients in SR or AF and HF brought out the following set of five reference genes:
POLR2A, GAPDH, PPIA, IPO8, RPLP0. This set of reference genes varied ac- cording to the progression from SR [SRnd or sinus rhythm with atrium (SRd)] to pAF and chronic atrial fibrillation (cAF), respectively, or de- pending on the type of cardiac pathology (AF vs. HF). The optimal set of reference genes for comparison of RA-SRnd vs. SRd appeared to be RPLP0, PPIA, POLR2A, B2M, and HMBS. RPLP0, together with PGK1, GAPDH, IPO8, andHMBSappear to represent a good choice as reference genes when comparing SRnd with pAF samples. In contrast, when the comparison includes cAF samples,RPLP0is no more a reliable option; so, the best selection of reference genes includesPOLR2A, PPIA,GAPDH, ... ...
...
Table 3Quality control of RNA samples n RNA content
(mg/mg)
260 nm/280 nm OD ratio RIN
Mean SD Mean SD
RA SRnd 4 0.49 ± 0.01 1.70 0.13 6.9 0.81 SRd 4 0.55 ± 0.06 1.63 0.16 7.2 0.29 pAF 4 0.37 ± 0.05 1.57 0.11 6.8 0.54 cAF 4 0.44 ± 0.05 1.67 0.14 6.9 0.28
HF 4 0.52 ± 0.16 1.66 0.18 7.5 0.15
LA
SR 4 0.43 ± 0.09 1.68 0.07 6.7 0.61
cAF 4 0.43 ± 0.10 1.61 0.13 6.7 0.80 RV
CT 4 0.45 ± 0.22 1.58 0.19 7.1 0.49
HF 4 0.65 ± 0.06 1.72 0.09 7.6 0.85
LV
CT 4 0.71 ± 0.04 1.54 0.06 6.9 1.43
HF 4 0.70 ± 0.04 1.72 0.09 7.6 0.80
RA, right atrium; LA, left atrium; RV, right ventricle; and LV, left ventricle. SRnd, sinus rhythm without atrium dilatation; SRd, sinus rhythm with atrium dilatation;
pAF, paroxysmal atrial fibrillation; cAF, chronic atrial fibrillation; HF, heart failure;
and CT, Healthy controls.
.. ..
.. ..
.. ..
.. ..
.. ..
.. ..
.. ..
.. ..
.. ..
.. ..
.. ..
.. ..
.. ..
.. ..
.. ..
.. ..
.. ..
.. ..
.. ..
.. ..
.. ..
.. ..
.. ..
.. ..
.. ..
HPRT1, andPGK1. Based on these results, we propose GAPDH, IPO8, POLR2A, PPIA, andRPLP0as an optimal set of reference genes to perform all the comparisons in the right atrium.
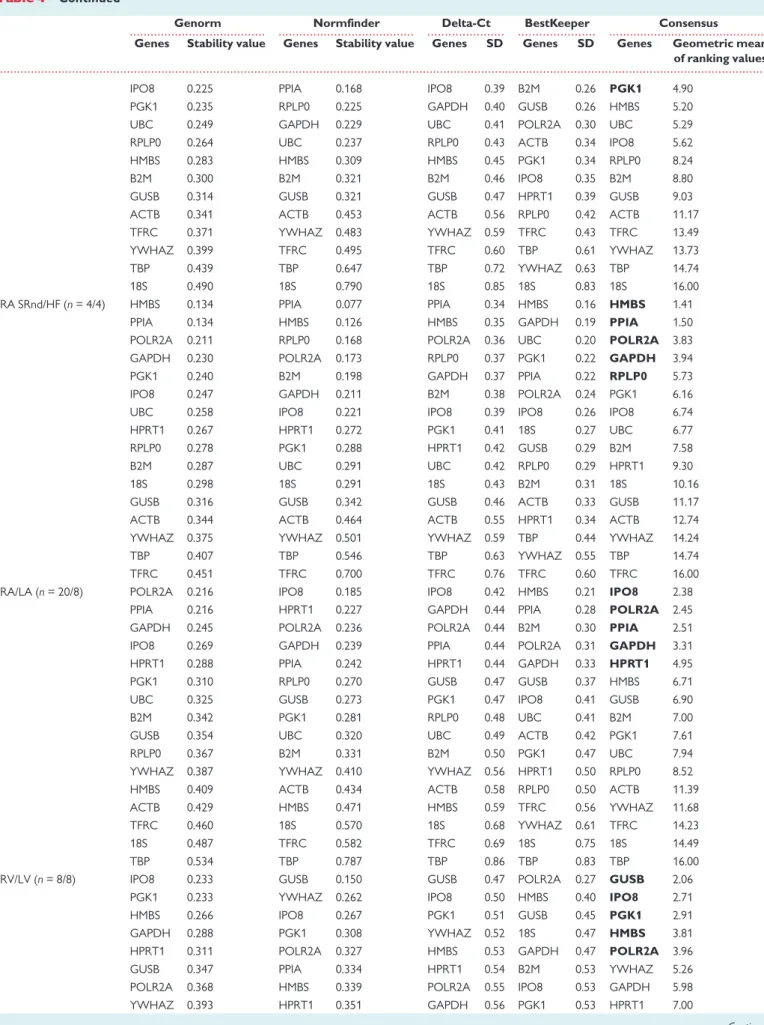
Regarding gene expression studies in all heart cavities, the results point to one common reference gene,POLR2A, among the top five for the RA/LA, RV/LV and A/V comparisons.GAPDH,GUSB,IPO8, andPPIA can be added toPOLR2Awhich should warrant a minimal set of three to four reference genes for normalization of the RT-qPCR data.
GUSBappears as an appropriate reference gene when comparing ven- tricles in normal and pathological states.IPO8,PGK1,HMBS, andPOLR2A can be added toGUSBwhen comparing left and right ventricles. For stud- ies of HF in LV samples, the same genes can be used butYWHAZcould be preferred overPOLR2A. However, to elucidate changes in gene expres- sion related to HF in RV,GAPDH, POLR2A,GUSB,HPRT1, andPPIArepre- sent the best set of reference genes. Altogether, a minimum of three reference genes amongGAPDH,GUSB,IPO8,POLR2AandYWHAZwould provide a useful set to compare normal and failing ventricular cavities.
Among the 16 reference genes studied for their expression stability in healthy and pathological human heart cavities, our data also show that four genes should not be used for normalization:18S,TBP,TFRC, and ACTB. Indeed, in each comparison presented inTable4, the two least sta- ble genes belong to this set.
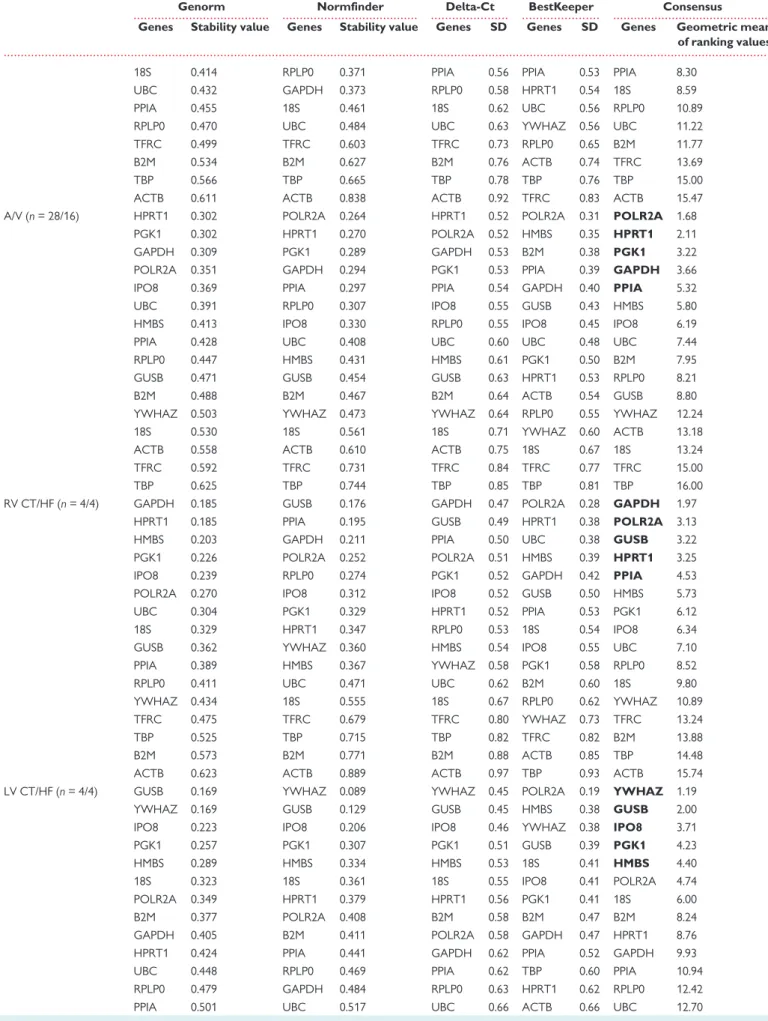
Finally, for a study comparing all cardiac chambers under normal and pathological conditions, a good set of reference genes should be:
GAPDH, IPO8, POLR2A,PPIA, and YWHAZorGUSB. Depending on the groups or conditions compared, this set of reference genes should lead to a minimal set of two to four reference genes to be used for normaliza- tion of RT-qPCR data.
3.3 Validation of the set of reference genes
We then tested our normalization strategy by comparing RT-qPCR data normalized to either18Sor to our final set of reference genes (GAPDH,
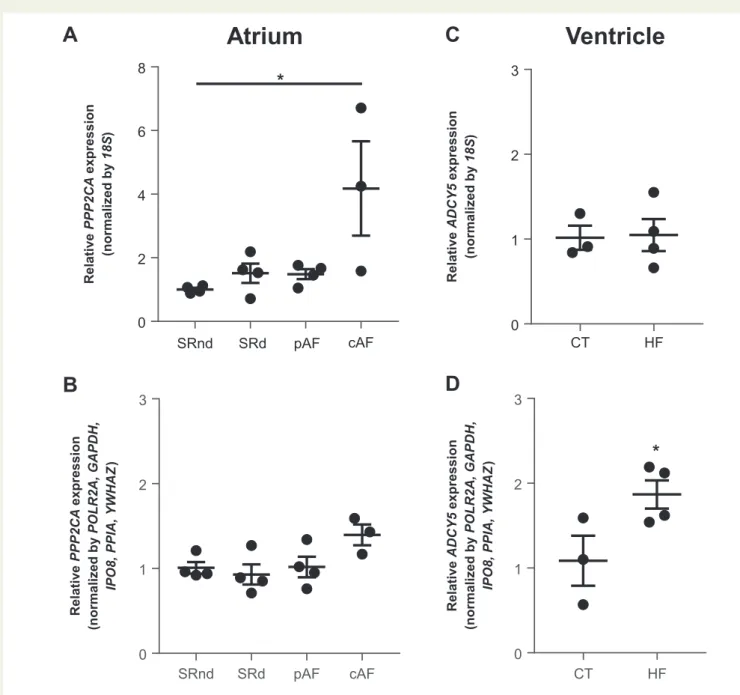
IPO8, POLR2A,PPIA, andYWHAZ) for two genes of interest:PPP2CAin the right atrium from SR (SRnd or SRd), pAF and cAF patients;ADCY5in the right ventricle from CTs and HF patients (Figure3).
A large and statistically significant difference inPPP2CAgene expres- sion was found between cAF and the other groups when using18Sas reference gene for normalization (Figure3A) but not when using the set of reference genes for normalization (Figure3B). Since earlier studies us- inga-actin as reference gene for the RT-qPCR experiments showed no change inPPP2CAgene expression in cAF,41,42this validates the choice of the set of reference genes from our study when comparing human atrial tissues.
Similarly, when comparing HF vs. CT ventricular samples, a significant increase in the expression level ofADCY5was found in HF when normal- ization was made with the selected set of reference genes (Figure3D) but the expression appeared unchanged between CT and HF samples when normalization was based only on18S(Figure3C). A similar absence of variation ofADCY5mRNA between CT and HF was found in a pig model when normalizing to the expression of18S.43In another study in dog heart, a decrease inADCY5expression was observed in HF when nor- malizing to the expression ofACTB,44one of least stable reference gene identified in our study. In contrast, an elevation ofADCY5mRNA levels was found by Northern analysis in human ventricular samples from pa- tients with HF when normalizing with GAPDH,45one of the best stable reference gene selected in this study. This validates the choice of the set of reference genes from our study when comparing human ventricular samples.
4. Discussion
In this study, we provide a detailed analysis of reference genes in cardiac tissues from different regions (right and left atria and ventricles) of the heart of patients with different pathological conditions. We show that
5 10 15 20 25 30
Ct value
17<Ct<21 23<Ct<27
Figure 1Variation in candidate reference gene expression in all tissue heart samples. Box-and-whisker plots showed the Ct values of each reference gene analyzed in a total of 44 heart tissues from 36 patients. Boxes indicated median (Q2) and quartiles first and third (Q1 and Q3) and whiskers corresponded to the minimum and maximum values.
.. ..
.. ..
.. ..
.. ..
.. ..
.. ..
.. ..
.. ..
.. ..
.. ..
.. ..
.. ..
.. ..
.. ..
.. ..
.. ..
.. ..
.. ..
.. ..
.. ..
.. ..
.. ..
.. ..
.. ..
.. ..
.. ..
.. ..
.. ..
.. ..
.. ..
.. ..
.. ..
.. ..
.. ..
.. ..
.. ..
.. ..
.. ..
.. ..
.. ..
.. ..
.. ..
.. ..
.. ..
.. .
there is not one universal gene being appropriate to obtain a correct normalization for all types of human cardiac tissues. Based on a com- bined statistical analysis, we propose a set of most stable reference genes to be used when comparing RT-qPCR data obtained from healthy or dis- eased human cardiac tissues.
A considerable number of studies used18SorACTBgenes as internal controls for RT-qPCR analysis in heart samples. As shown earlier,46we found using three different algorithms (GeNorm, NormFinder, and Delta-Ct) that these genes, along withTBPandTFRC, are the two genes with the least stable expression in all our groups of samples (Table4).
Accordingly, using one of these single commonly used reference genes to compare the level of expression of two genes of interest,PPP2CAand ADCY5, in healthy and diseased cardiac tissues led to misleading results, while on the contrary, using the geometric mean of our set of reference genes for normalization of the RT-qPCR data led to results that were consistent with the literature (Figure3).
The choice of appropriate reference genes is, thus, of crucial impor- tance when comparing RT-qPCR data from mRNA collected from differ- ent human heart samples. Although this issue has been addressed in a number of earlier studies, none of them provided a thorough and sys- tematic analysis as performed here. We analysed 16 reference gene can- didates and compared their level of expression and degree of stability in the four heart chambers and in control and diseased states. We found thatGAPDH,IPO8,POLR2A,PPIA, andYWHAZ or GUSBprovide an opti- mal set of genes to be used to normalize data in human heart tissue
samples.PPIAhas been shown earlier as an appropriate internal control gene in studies with atrial,47right ventricular15,47and LV samples from healthy donors15,48and from HF patients.47,49Martinoet al.47also con- firmed our findings about the use ofHPRT1as a reference gene in human atria and the use ofGAPDHin right ventricle. These results are also in ac- cordance with the study of Svobodova´et al.50performed in pig heart.
Vesenetiet al.51showed thatHMBS,HPRT1andYWHAZare reliable ref- erence genes when working with right or ischemic LV samples.
However, together with Koppelkammet al.,46they identifiedTBPas an appropriate reference gene when studying LV samples, while our data in- dicate that expression of this gene is highly variable (Table4). However, TBPmay be suitable as a reference gene only in combination withHMBS andHPRT1, and only in the remote region of the left ventricle in rats.51 On the other hand, Koppelkammet al.recommended the use ofTBPin combination of at least three other reference genes, includingHMBS, in post mortem cardiac muscle tissue with RIN mean values of 3.9.46Other studies,49,52 predominantly performed in left ventricles, showed that GAPDHis not a good reference gene. Our study shows thatGAPDHex- pression is more stable in right than LV samples, and it can also be used as a reference gene in healthy and diseased atria and for comparison be- tween atrial and ventricular tissues (Figure2, Table4). This is in agree- ment with recent works showing thatGAPDHhas the highest expression stability between the tested genes in both HF and healthy heart samples in right and left ventricle.36,53POLR2Awas ranked top three by the geo- metric consensus method for most atrial and RV studies, whileIPO8and GUSB were the most preserved reference genes in LV samples. This highlights the importance of choosing the most appropriate internal ref- erence gene when studying chamber-specific differences in gene expres- sion. To the best of our knowledge,IPO8orGUSBhave never been used as reference genes in human heart samples.
An important aspect to take into consideration is the quality of the mRNA samples. It was shown earlier that the RIN values are lower and the variation in the RT-qPCR much larger in human than in rodent heart samples,49possibly due to differences in harvesting times or a conse- quence of the type and duration of the diseased condition. Thus, RNA integrity was carefully checked in our samples and the RIN values were consistent and comparable within the different heart cavities and cardiac diseases. Another important aspect is the method of analysis used to evaluate the variability in gene expression. Indeed, we compared the ex- pression variability for the 16 reference gene candidates using four differ- ent methods of analysis (geNorm, Normfinder, BestKeeper and comparative delta-Ct) and found that each method could give a different ranking of the 16 genes (Table4). This shows that using a single method of analysis to evaluate the relative expression of a gene cannot be rec- ommended because this could lead to false-positive or false-negative re- sults. We propose to use at least three methods of analysis and to calculate a geometric mean of the rankings as used here.
In conclusion, when performing RT-qPCR analysis on different samples obtained from different cardiac tissues and/or diseased states, we recommend (i) to use a normalization based on a set of three to five stable reference genes rather than on a single gene, and (ii) to use at least three methods of analysis of gene variability and cal- culate a geometric mean of the rankings to select the most robust set of reference genes. We validated this strategy in human heart using samples obtained from four cardiac chambers and up to five different pathophysiological conditions. Based on our combined results, we recommend the use ofGAPDH,IPO8,POLR2A,PPIA, andYWHAZor GUSBas reference genes for RT-qPCR when performing studies with human heart samples.
Figure 2 Consensual statistical analysis of variation in candidate ref- erence gene expression in different heart cavities and health conditions.
Gene oblong chart illustrating an integrated model of the best gene se- lection in different human heart cavities and diseases. Gene names indi- cated in bold are part of the most appropriate selection of 5 reference genes for all comparisons.
... ... ... ... ...
...
Table 4Analysis of reference gene expression variability
Genorm Normfinder Delta-Ct BestKeeper Consensus
Genes Stability value Genes Stability value Genes SD Genes SD Genes Geometric mean of ranking values
RA SR/AF-HF (n= 8/12) POLR2A 0.241 POLR2A 0.136 POLR2A 0.38 HMBS 0.17 POLR2A 1.50
GAPDH 0.241 RPLP0 0.196 IPO8 0.41 PPIA 0.22 GAPDH 3.13
IPO8 0.251 IPO8 0.197 PPIA 0.41 B2M 0.28 PPIA 3.60
PGK1 0.257 PPIA 0.223 GAPDH 0.42 GAPDH 0.28 IPO8 3.66
HPRT1 0.261 HPRT1 0.241 RPLP0 0.42 POLR2A 0.30 RPLP0 5.61
UBC 0.276 GAPDH 0.245 HPRT1 0.43 GUSB 0.31 HMBS 6.04
PPIA 0.290 PGK1 0.262 PGK1 0.44 UBC 0.32 PGK1 6.29
B2M 0.302 UBC 0.269 B2M 0.44 PGK1 0.35 B2M 6.45
RPLP0 0.314 B2M 0.270 UBC 0.44 ACTB 0.36 HPRT1 6.51
GUSB 0.325 GUSB 0.277 GUSB 0.45 IPO8 0.36 UBC 7.42
HMBS 0.333 HMBS 0.314 HMBS 0.47 RPLP0 0.42 GUSB 8.80
YWHAZ 0.358 YWHAZ 0.415 YWHAZ 0.54 HPRT1 0.46 ACTB 11.86
ACTB 0.384 ACTB 0.459 ACTB 0.57 TFRC 0.52 YWHAZ 12.47
18S 0.422 18S 0.580 18S 0.68 YWHAZ 0.59 18S 14.24
TFRC 0.457 TFRC 0.618 TFRC 0.71 18S 0.62 TFRC 14.47
TBP 0.499 TBP 0.725 TBP 0.80 TBP 0.73 TBP 16.00
RA SRnd/SRd (n= 4/4) POLR2A 0.073 RPLP0 0.083 RPLP0 0.30 HMBS 0.15 RPLP0 1.73
RPLP0 0.073 PPIA 0.133 PPIA 0.32 PPIA 0.24 PPIA 2.21
PPIA 0.153 POLR2A 0.139 POLR2A 0.32 B2M 0.25 POLR2A 2.82
B2M 0.173 TFRC 0.157 B2M 0.33 ACTB 0.27 B2M 4.12
IPO8 0.189 GAPDH 0.157 GAPDH 0.33 GUSB 0.28 HMBS 5.48
GAPDH 0.198 B2M 0.173 UBC 0.34 UBC 0.30 GAPDH 6.22
TRFC 0.217 UBC 0.174 IPO8 0.34 IPO8 0.33 UBC 6.70
UBC 0.226 IPO8 0.185 TFRC 0.35 POLR2A 0.33 IPO8 6.88
HMBS 0.237 HPRT1 0.223 HPRT1 0.37 GAPDH 0.34 TFRC 7.05
HPRT1 0.253 HMBS 0.275 HMBS 0.39 RPLP0 0.34 GUSB 9.64
PGK1 0.266 PGK1 0.290 PGK1 0.40 TFRC 0.36 ACTB 10.05
GUSB 0.279 GUSB 0.295 GUSB 0.41 PGK1 0.38 HPRT1 10.32
ACTB 0.306 YWHAZ 0.436 YWHAZ 0.52 18S 0.49 PGK1 11.24
YWHAZ 0.334 ACTB 0.458 ACTB 0.53 HPRT1 0.49 YWHAZ 13.73
18S 0.365 18S 0.523 18S 0.59 YWHAZ 0.61 18S 14.47
TBP 0.412 TBP 0.697 TBP 0.74 TBP 0.71 TBP 16.00
RA SRnd/pAF (n= 4/4) IPO8 0.082 PGK1 0.102 RPLP0 0.34 HMBS 0.16 RPLP0 2.06
RPLP0 0.082 RPLP0 0.105 GAPDH 0.34 GUSB 0.19 PGK1 3.20
POLR2A 0.123 GAPDH 0.118 PGK1 0.35 B2M 0.21 GAPDH 3.46
GAPDH 0.161 IPO8 0.120 IPO8 0.35 PPIA 0.23 IPO8 3.64
PGK1 0.190 POLR2A 0.150 POLR2A 0.36 ACTB 0.24 HMBS 4.60
B2M 0.210 B2M 0.182 B2M 0.37 GAPDH 0.28 B2M 5.05
PPIA 0.234 HPRT1 0.228 HMBS 0.40 PGK1 0.28 POLR2A 5.23
HMBS 0.248 HMBS 0.230 HPRT1 0.41 POLR2A 0.34 GUSB 6.50
GUSB 0.261 UBC 0.261 GUSB 0.42 RPLP0 0.34 PPIA 7.27
UBC 0.275 PPIA 0.275 PPIA 0.42 UBC 0.34 UBC 9.43
HPRT1 0.286 GUSB 0.276 UBC 0.42 18S 0.37 HPRT1 9.64
TFRC 0.315 YWHAZ 0.432 TFRC 0.53 IPO8 0.37 ACTB 11.40
YWHAZ 0.341 18S 0.433 YWHAZ 0.54 TFRC 0.37 TFRC 12.47
18S 0.364 TFRC 0.444 18S 0.54 HPRT1 0.47 YWHAZ 13.21
ACTB 0.388 ACTB 0.529 ACTB 0.59 YWHAZ 0.56 18S 13.49
TBP 0.458 TBP 0.918 TBP 0.95 TBP 0.85 TBP 16.00
RA SRnd/cAF (n= 4/4) GAPDH 0.138 POLR2A 0.101 POLR2A 0.37 HMBS 0.15 POLR2A 2.14
PPIA 0.138 HPRT1 0.140 PPIA 0.37 UBC 0.20 PPIA 2.34
POLR2A 0.195 PGK1 0.153 HPRT1 0.38 PPIA 0.21 GAPDH 3.60
HPRT1 0.217 IPO8 0.168 PGK1 0.39 GAPDH 0.25 HPRT1 4.03
Continued
... ... ... ... ...
...
Table 4 Continued
Genorm Normfinder Delta-Ct BestKeeper Consensus
Genes Stability value Genes Stability value Genes SD Genes SD Genes Geometric mean of ranking values
IPO8 0.225 PPIA 0.168 IPO8 0.39 B2M 0.26 PGK1 4.90
PGK1 0.235 RPLP0 0.225 GAPDH 0.40 GUSB 0.26 HMBS 5.20
UBC 0.249 GAPDH 0.229 UBC 0.41 POLR2A 0.30 UBC 5.29
RPLP0 0.264 UBC 0.237 RPLP0 0.43 ACTB 0.34 IPO8 5.62
HMBS 0.283 HMBS 0.309 HMBS 0.45 PGK1 0.34 RPLP0 8.24
B2M 0.300 B2M 0.321 B2M 0.46 IPO8 0.35 B2M 8.80
GUSB 0.314 GUSB 0.321 GUSB 0.47 HPRT1 0.39 GUSB 9.03
ACTB 0.341 ACTB 0.453 ACTB 0.56 RPLP0 0.42 ACTB 11.17
TFRC 0.371 YWHAZ 0.483 YWHAZ 0.59 TFRC 0.43 TFRC 13.49
YWHAZ 0.399 TFRC 0.495 TFRC 0.60 TBP 0.61 YWHAZ 13.73
TBP 0.439 TBP 0.647 TBP 0.72 YWHAZ 0.63 TBP 14.74
18S 0.490 18S 0.790 18S 0.85 18S 0.83 18S 16.00
RA SRnd/HF (n= 4/4) HMBS 0.134 PPIA 0.077 PPIA 0.34 HMBS 0.16 HMBS 1.41
PPIA 0.134 HMBS 0.126 HMBS 0.35 GAPDH 0.19 PPIA 1.50
POLR2A 0.211 RPLP0 0.168 POLR2A 0.36 UBC 0.20 POLR2A 3.83
GAPDH 0.230 POLR2A 0.173 RPLP0 0.37 PGK1 0.22 GAPDH 3.94
PGK1 0.240 B2M 0.198 GAPDH 0.37 PPIA 0.22 RPLP0 5.73
IPO8 0.247 GAPDH 0.211 B2M 0.38 POLR2A 0.24 PGK1 6.16
UBC 0.258 IPO8 0.221 IPO8 0.39 IPO8 0.26 IPO8 6.74
HPRT1 0.267 HPRT1 0.272 PGK1 0.41 18S 0.27 UBC 6.77
RPLP0 0.278 PGK1 0.288 HPRT1 0.42 GUSB 0.29 B2M 7.58
B2M 0.287 UBC 0.291 UBC 0.42 RPLP0 0.29 HPRT1 9.30
18S 0.298 18S 0.291 18S 0.43 B2M 0.31 18S 10.16
GUSB 0.316 GUSB 0.342 GUSB 0.46 ACTB 0.33 GUSB 11.17
ACTB 0.344 ACTB 0.464 ACTB 0.55 HPRT1 0.34 ACTB 12.74
YWHAZ 0.375 YWHAZ 0.501 YWHAZ 0.59 TBP 0.44 YWHAZ 14.24
TBP 0.407 TBP 0.546 TBP 0.63 YWHAZ 0.55 TBP 14.74
TFRC 0.451 TFRC 0.700 TFRC 0.76 TFRC 0.60 TFRC 16.00
RA/LA (n= 20/8) POLR2A 0.216 IPO8 0.185 IPO8 0.42 HMBS 0.21 IPO8 2.38
PPIA 0.216 HPRT1 0.227 GAPDH 0.44 PPIA 0.28 POLR2A 2.45
GAPDH 0.245 POLR2A 0.236 POLR2A 0.44 B2M 0.30 PPIA 2.51
IPO8 0.269 GAPDH 0.239 PPIA 0.44 POLR2A 0.31 GAPDH 3.31
HPRT1 0.288 PPIA 0.242 HPRT1 0.44 GAPDH 0.33 HPRT1 4.95
PGK1 0.310 RPLP0 0.270 GUSB 0.47 GUSB 0.37 HMBS 6.71
UBC 0.325 GUSB 0.273 PGK1 0.47 IPO8 0.41 GUSB 6.90
B2M 0.342 PGK1 0.281 RPLP0 0.48 UBC 0.41 B2M 7.00
GUSB 0.354 UBC 0.320 UBC 0.49 ACTB 0.42 PGK1 7.61
RPLP0 0.367 B2M 0.331 B2M 0.50 PGK1 0.47 UBC 7.94
YWHAZ 0.387 YWHAZ 0.410 YWHAZ 0.56 HPRT1 0.50 RPLP0 8.52
HMBS 0.409 ACTB 0.434 ACTB 0.58 RPLP0 0.50 ACTB 11.39
ACTB 0.429 HMBS 0.471 HMBS 0.59 TFRC 0.56 YWHAZ 11.68
TFRC 0.460 18S 0.570 18S 0.68 YWHAZ 0.61 TFRC 14.23
18S 0.487 TFRC 0.582 TFRC 0.69 18S 0.75 18S 14.49
TBP 0.534 TBP 0.787 TBP 0.86 TBP 0.83 TBP 16.00
RV/LV (n= 8/8) IPO8 0.233 GUSB 0.150 GUSB 0.47 POLR2A 0.27 GUSB 2.06
PGK1 0.233 YWHAZ 0.262 IPO8 0.50 HMBS 0.40 IPO8 2.71
HMBS 0.266 IPO8 0.267 PGK1 0.51 GUSB 0.45 PGK1 2.91
GAPDH 0.288 PGK1 0.308 YWHAZ 0.52 18S 0.47 HMBS 3.81
HPRT1 0.311 POLR2A 0.327 HMBS 0.53 GAPDH 0.47 POLR2A 3.96
GUSB 0.347 PPIA 0.334 HPRT1 0.54 B2M 0.53 YWHAZ 5.26
POLR2A 0.368 HMBS 0.339 POLR2A 0.55 IPO8 0.53 GAPDH 5.98
YWHAZ 0.393 HPRT1 0.351 GAPDH 0.56 PGK1 0.53 HPRT1 7.00
Continued