Inflammation, adenoma and cancer:
Objective classification of colon biopsy specimens with gene expression signature
Orsolya Galamb
a,d,1,∗, Bal´azs Gy ¨orffy
b,1, Ferenc Sipos
a, S´andor Spis´ak
a, Anna M´aria N´emeth
a, P´al Miheller
a, Zsolt Tulassay
a,d, Elek Dinya
cand B´ela Moln´ar
a,da
2nd Department of Medicine, Semmelweis University, Budapest, Hungary
b
Joint Research Laboratory of the Hungarian Academy of Sciences and the Semmelweis University for Pediatrics and Nephrology, 1st Department of Paediatrics, Semmelweis University Budapest, Hungary
c
EGIS Pharmaceuticals Ltd. Medical Department, Budapest, Hungary
d
Hungarian Academy of Science, Molecular Medicine Research Unit, Budapest, Hungary
Abstract. Gene expression analysis of colon biopsies using high-density oligonucleotide microarrays can contribute to the un-
derstanding of local pathophysiological alterations and to functional classification of adenoma (15 samples), colorectal carci- nomas (CRC) (15) and inflammatory bowel diseases (IBD) (14). Total RNA was extracted, amplified and biotinylated from frozen colonic biopsies. Genome-wide gene expression profile was evaluated by HGU133plus2 microarrays and verified by RT-PCR. We applied two independent methods for data normalization and used PAM for feature selection. Leave one-out stepwise discriminant analysis was performed. Top validated genes included collagenIV
α1, lipocalin-2, calumenin, aquaporin-8 genes in CRC; CD44, met proto-oncogene, chemokine ligand-12, ADAM-like decysin-1 and ATP-binding casette-A8 genes in adenoma; and lipocalin-2, ubiquitin D and IFITM2 genes in IBD. Best differentiating markers between Ulcerative colitis and Crohn’s disease were cyclin-G2; tripartite motif-containing-31; TNFR shedding aminopeptidase regulator-1 and AMICA. The discriminant analysis was able to classify the samples in overall 96.2% using 7 discriminatory genes (indoleamine-pyrrole-2,3- dioxygenase, ectodermal-neural cortex, TIMP3, fucosyltransferase-8, collectin sub-family member 12, carboxypeptidase D, and transglutaminase-2). Using routine biopsy samples we successfully performed whole genomic microarray analysis to identify discriminative signatures. Our results provide further insight into the pathophysiological background of colonic diseases. The results set up data warehouse which can be mined further.
Keywords: Gene expression signature, whole genomic oligonucleotide microarray, colon cancer, adenoma, inflammatory bowel disease
1. Introduction
Colorectal cancer (CRC) is one of the most frequent death-causing tumorous diseases in Western countries.
CRC frequently follows various high-risk conditions
1These authors contributed equally to this work.
∗Corresponding author: Orsolya Galamb, 2nd Department of Medicine Semmelweis University, 1088 Budapest, Szentkir´alyi str.
46, Hungary. Tel.: +36 1 266 09 26; Fax: +361 266 08 16; E-mail:
orsg1@yahoo.com.
such as adenomatous polyps and inflammatory bowel disease (IBD). The exact diagnosis of IBD types is still often difficult by conventional histology. High-density oligonucleotide microarray analysis gives an opportu- nity for studying the genetic and gene expression back- ground, understanding of local pathophysiological al- terations and for functional classification of diseases.
To date, microarray analyses reported in the litera- ture were performed predominantly from surgically re- moved CRC samples [16], while microarray gene ex- pression profiling of adenomas and IBDs as colorectal
ISSN 0278-0240/08/$17.002008 – IOS Press and the authors. All rights reserved
diseases predisposing to CRC has been studied less.
Besides the publications dealing with the comparison of gene expression profiles (GEP) of CRC and normal colonic mucosa [10,21,29], more and more scientific studies appear to focus on gene expression background of CRC progression and metastases development [1–4, 22,25,26,42,43], characterization of CRC subtypes ac- cording to mRNA expression [3,14,44], the correlation of GEP with clinicopathological parameters [3,5,7,44], and on the generation of mRNA expression based prog- nosis [40]. Microarray-based molecular diagnostics of malignancy in colon adenoma and CRC samples were described using 10 [1], 9 [25,26] and 4 [29] adeno- ma samples compared to adenocarcinoma and normal colonic tissues. Expression microarray analyses of IBD samples were performed in order to determine global GEP of mucosal samples from patients with IBD com- pared to normal controls [23], to identify novel can- didates for ulcerative colitis (UC) and/or Crohn’s dis- ease (CD) genetic susceptibility [24,30], to find marker genes involved in IBD-related carcinogenesis [38], to compare expression of entire chemokine family within IBD and normal patients [31], and to examine changes in GEP in peripheral blood mononuclear cells in IBD patients [27].
mRNA expression array analysis is usually per- formed using high volume surgically removed tissues.
In the gastrointestinal tract, biopsy samples are rou- tinely taken during the endoscopical examination with minimal intervention. The mRNA expression study of these samples could allow further insight into the development of inflammatory, preneoplastic and neo- plastic diseases, and these biopsy specimens could be suitable samples for identifying early diagnostic target molecules. Colonic biopsies were applied previously for expression array analysis only in several cases [15, 23,30,31], because, even today, array technology needs significantly more RNA than can be isolated from tiny biopsy specimens. However, new techniques and com- mercial kits have recently become available for the re- liable mRNA amplification without any effect on the original gene expression pattern [39].
Genome-wide gene expression profiling studies us- ing microarrays have the potential to improve the di- agnosis and treatment of human cancers and other dis- orders. However, recently appeared whole genom- ic oligonucleotide microarrays representing more than 47000 transcripts have not been used in any type of gastrointestinal disorders.
In the present study we aimed to find discriminato- ry genes between the main diagnostic groups and to
develop and test validation assay system and to con- firm the applicability of biopsy samples for microarray analysis-based classification. Another purpose of our work was to search for altered biological pathways for explanation of the pathomechanism of these colonic diseases based on whole genomic mRNA microarray results.
2. Materials and methods
2.1. Patients and samples
After informed consent, biopsy samples were tak- en from the colon during the endoscopical interven- tion before treatment, and stored in RNALater Reagent (Qiagen Inc., US) at − 80
◦C. Total RNA was extracted from biopsies of 15 patients with tubulovillous/villous adenomas, 15 with colorectal adenocarcinoma (all mi- crosatellite negative), 9 with active ulcerative colitis (UC), 5 with active Crohn’s colitis (CD) and of 8 healthy normal controls (Table 1). Detailed patient specification is described in Supplemental Table 1.
2.2. Methods
2.2.1. Microarray analysis
Total RNA was extracted using RNeasy Mini Kit (Qi- agen, US) according to the manufacturer’s instructions.
Quantity and quality of the isolated RNA were tested by measuring of the absorbance and agarose gelelec- trophoresis. Biotinylated cRNA probes were synthe- sized from 5–8 µ g total RNA and fragmented accord- ing to the Affymetrix description using GeneChip cD- NA synthesis reagents and sample cleanup module and Enzo BioArray HighYield RNA Transcript Labeling Kit (https://www.affymetrix.com/support/downloads/
manuals/expression s2 manual.pdf – first version).
10 µ g of each fragmented cRNA sample was hybridized
into HGU133 Plus2.0 array (Affymetrix Inc.) at 45
◦C
for 16 hours. The slides were washed and stained
using Fluidics Station 450 and antibody amplification
staining method according to the manufacturer’s in-
structions. The fluorescent signals were detected by a
GeneChip Scanner 3000.
Table 1
Patient groups investigated in our study
Group n Male/female Age Taqman available
Adenoma without dysplasia 6 3/3 65.2±15.9 6
Adenoma with dysplasia 9 3/6 73.6±11.6 6
Ulcerative colitis 9 3/6 43.8±15.9 7
Crohn’s disease 5 2/3 25.6±7.6 1
CRC Dukes B 7 3/4 65.3±13.6 6
CRC Dukes C-D 8 4/4 67.5±11.8 4
Normal 8 4/4 50.6±5.97 5
2.2.2. Statistical analysis
Pre-processing and quality control
Quality control analyses were performed accord- ing to the suggestions of The Tumor Analysis Best Practices Working Group [37]. Scanned images were inspected for artifacts, percentage of present calls ( > 25%) and control of the RNA degradation were eval- uated. Based on the evaluation criteria all biopsy mea- surements fulfilled the minimal quality requirements.
According to the above recommendations we have ap- plied two different normalization methods: MAS 5.0, and RMA [18]. MAS5.0 applies normalization on an individual chip; it has excellent specificity and good sensitivity. RMA applies cross-project normalization;
it has good specificity and excellent sensitivity [37].
Further data analysis and -interpretation have been car- ried out with both of these pre-processing methods in order to yield the best comparison and normalization properties across all measurements.
Feature selection and cluster analysis
We have arranged the complete dataset consist- ing of 52 expression measurements into classes ac- cording to the histological properties of the samples.
This selection procedure resulted in six new datasets (CRC/adenoma/IBD vs. normal, CRC DukesB vs. CRC DukesC-D, non-dysplastic adenoma vs. dyplastic ade- noma, UC vs. CD), which were treated as autonomous classification problems. In order to obtain charac- teristic signal profiles with high predictive power we have applied the “Prediction Analysis for Microarrays”
(PAM) [35]. PAM uses soft thresholding to produce a shrunken centroid, which allows the selection of genes with high predictive potential. In our experimental set- up the search for a minimum number of genes with maximum predictive accuracy is not promising as we could distinguish two different groups with a very short gene list. Therefore we decided to set the PAM thresh- old lower for the selection of the top genes and to pick the top 100 genes for each condition. Due to the nature of PAM, at lower threshold the resulting gene list will be longer, but all genes significant at a higher threshold
will be included in any selected set. Finally, the overlap of the two lists –based on two different normalizations–
was taken for further analysis. The functional classifi- cation of the most differentially expressed genes were performed according to the analysis of RMA top 100 genes in each main disease groups compared to normal controls.
To visualize the discriminative patterns, hierar- chical clustering was performed using the Gene- sis software [34]. Annotation was performed using the Affymetrix Netaffx analysis centre (http://www.
affymetrix.com/analysis/index.affx). The combined datasets for further analysis are available in the Gene Expression Omnibus databank (http://www.ncbi.nlm.
nih.gov/geo/), series accession number: GSE4183.
Discriminant analysis
Further data analysis was performed in the SAS v.8.2 (SAS Institute Inc. Cary, NC, USA) program package and the discriminant analysis in SPSS v.15.0 program (SPSS Inc., USA). We have performed a stepwise dis- criminant analysis among the groups by forward selec- tion of quantitative variables. The set of variables that make up each class was assumed to be multivariate nor- mal with a common covariance matrix. Finally we used the significant discrimination model (Wilks’ Lambda was significant) and we have fixed the most important discriminatory genes. At the end of the analysis we have made the Leave-one-out classification table.
2.2.3. Taqman RT-PCR
TaqMan real-time PCR was used to measure
the expression of 52 selected genes using an Ap-
plied Biosystems Micro Fluidic Card System in 36
samples, where sufficient RNA could be extracted
(Table 1). The measurements were performed us-
ing an ABI PRISM 7900HT Sequence Detection
System as described in the products User Guide
(http://www.appliedbiosystems.com, CA, USA). For
data analysis the SDS 2.2 software was used. The
extracted delta Ct values (which represent the expres-
sion normalized to the ribosomal 18S expression) were grouped according to the histological groups. Then the Student’s t-test was performed to compare the expres- sion values between groups.
3. Results
3.1. Identification of discriminatory genes among the main diagnostic groups
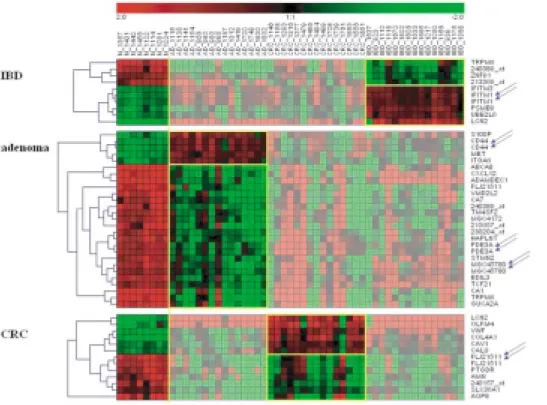
CRC cases are characterized by differentially ex- pressed genes involved in cell proliferation (pleiotro- phin, insulin-like growth factor binding protein 5, REG1A, WNT1 inducible signaling pathway protein 1), adhesion (MCAM, collagens, enactin, laminin gam- ma 1), and transport (such as aquaporin 8, lipocalin 2 and collagen 4 A1). Adenoma cases showed al- tered gene expression data in transport (like AB- CA8, TRPM6), adhesion (such as CXCL12, CD44, ADAM-like decysin 1), metabolism (like carbonic an- hydrase I) and proliferation (such as MET protoonco- gene) functional groups. IBD cases are featured by the gene expression changes of immune regulation (such as IFITM3, IFITM1 and proteasome subunit, be- ta type, 9), cell proliferation (REG1A, tryptophanyl- tRNA synthetase, interferon stimulated gene 20kDa) and metabolism (like chitinase 3-like 1, carbonic an- hydrase I, zinc finger protein 91). The top 100 genes for each condition were picked and the over- laps of the two lists, based on two different normaliza- tions were determined. Discriminatory genes between CRC/adenoma/IBD and normal biopsy samples are list- ed in Table 2, and considered as the disease type spe- cific mRNA expression markergroups. The list of the top 100 genes for each analysis setting including com- plete annotation and the complete microarray dataset are shown as supplementary information in Supplemen- tal Table 2. The average within-PAM cross-validation misclassification error was found to be 7.3%.
To visualize the expression changes, we have clus- tered the selected top genes of all biopsy samples to detect similarities across the sample groups (Fig. 1).
The dendrogram of the 52 colonic cases shows the dis- crimination potential of the selected genes. The tran- scripts representing the same gene are found to fit into the same cluster.
3.2. Discriminant analysis of the array results
We were able to classify the samples using 7 dis- criminatory genes (indoleamine-pyrrole 2,3 dioxyge- nase, ectodermal-neural cortex, TIMP3, fucosyltrans- ferase 8, collectin sub-family member 12, carboxypep- tidase D, and transglutaminase 2 (Fig. 2). 96.2% of original grouped cases and 94.3 % of cross-validated grouped cases were correctly classified (Table 3).
3.3. Discrimination of colonic disease subtypes
The subclassifying genes within the main disease groups were also identified. The metabolic and trans- port processes (representing genes like DnaJ homolog subfamily C member 10, coatomer protein complex subunit beta) mainly differ between CRC subgroups.
In advanced stages of CRC downregulation of apop- tosis (such as TIA1 cytotoxic granule-associated RNA binding protein, forkhead box O3A), and immune re- sponse (like immunoglobulin heavy constant mu, 2’- 5’-oligoadenylate synthetase 2) was observed, while carbohydrate, fatty acid metabolism (like glutamine- fructose-6-phosphate transaminase 1, GDP-mannose 4,6-dehydratase, sterol-C4-methyl oxidase-like, lanos- terol synthase) and energy metabolism related genes (such as ATPase inhibitory factor 1) showed higher mR- NA expression levels in parallel with CRC progression.
In adenoma samples upregulation of proliferation (such
as interferon gamma-inducible protein 16, aminopepti-
dase A, tumor protein D52-like 2) and DNA replication
and transcription regulation (like IGF1, nuclear factor-
like 3, zinc finger protein 452) and downregulation of
immune and defense response (such as immunoglobu-
lin heavy constant mu, T cell receptor gamma variable
9, interferon regulatory factor 4 and tryptase alpha)
were found during the development of dysplastic alter-
ations. CD cases are mainly featured by increased ex-
pression of carbohydrate metabolism genes (like galac-
tosidase alpha, fructose-2,6-biphosphatase 4, maltase-
glucoamylase), while certain cell proliferation (such
as septin 10, platelet derived growth factor D, cyclin
G2), apoptosis (such as BCL10, BIRC4, egl nine ho-
molog 3), immune regulation (like decay accelerating
factor, CD24, CEACAM1), transport (like dual oxidase
2, P450 (cytochrome) oxidoreductase and lipocalin
2), and ubiquitin-dependent protein catabolism (such
as tripartite motif-containing 31, ubiquitin-conjugating
enzyme E2, J1, and Ubiquitin specific protease 53)
genes were found to be overexpressed in UC compared
with CD cases. However, the function of many sub-
Table 2
Genes differentially expressed in CRC/adenoma/IBD compared to normal mucosa (overlap of genes identified using PAM after both RMA and MAS 5.0 normalizations)
Probe Set ID Gene Name Gene Symbol Gene Ontology Biological Process Fold change CRC vs
normal
202112 at von Willebrand factor VWF cell adhesion / platelet activation /re- sponse to wounding
3.61
211980 at collagen, type IV, alpha 1 COL4A1 phosphate transport 5.21
212531 at lipocalin 2 (oncogene 24p3) LCN2 transport 7.97
240157 at — — — −6.30
220724 at hypothetical protein FLJ21511 FLJ21511 — −4.08
220723 s at hypothetical protein FLJ21511 FLJ21511 — −4.07
203065 s at caveolin 1, caveolae protein, 22kDa CAV1 — 2.70
212768 s at olfactomedin 4 OLFM4 — 3.70
223587 s at amnionless homolog (mouse) AMN development −3.91
206784 at aquaporin 8 AQP8 water transport −5.02
215894 at prostaglandin D2 receptor (DP) PTGDR G-protein coupled receptor protein sig- naling pathway
−3.30
214845 s at calumenin CALU — 3.23
213119 at solute carrier family 36 (proton/amino acid symporter), member 1
SLC36A1 amino acid transport −2.27
Adenoma vs normal
204719 at ATP-binding cassette, sub-family A (ABC1), member 8
ABCA8 transport −12.78
230204 at — — — −4.05
203510 at met proto-oncogene (hepatocyte growth factor receptor)
MET cell proliferation/ cell surface recep- tor linked signal transduction / protein amino acid phosphorylation
3.91
240389 at — — — −13.50
1552296 at vitelliform macular dystrophy 2-like 2 VMD2L2 ion transport −11.34 224412 s at transient receptor potential cation chan-
nel, subfamily M, member 6
TRPM6 cation transport / protein amino acid phosphorylation
−11.59 209687 at chemokine (C-X-C motif) ligand 12
(stromal cell-derived factor 1)
CXCL12 G-protein coupled receptor protein sig- naling pathway / calcium ion homeosta- sis /cell adhesion / cell-cell signaling
−6.91
212014 x at CD44 antigen (homing function and In- dian blood group system)
CD44 cell adhesion /cell-cell adhesion / cell- matrix adhesion
3.87 205523 at hyaluronan and proteoglycan link pro-
tein 1
HAPLN1 cell adhesion −5.04
206134 at ADAM-like, decysin 1 ADAMDEC1 integrin-mediated signaling pathway/
negative regulation of cell adhesion / proteolysis and peptidolysis
−6.81
209835 x at CD44 antigen (homing function and In- dian blood group system)
CD44 cell adhesion /cell-cell adhesion /cell- matrix adhesion
3.74
205950 s at carbonic anhydrase I CA1 one-carbon compound metabolism −9.77
228507 at Phosphodiesterase 3A, cGMP-inhibited PDE3A lipid metabolism /signal transduction −4.36 225275 at EGF-like repeats and discoidin I-like do-
mains 3
EDIL3 cell adhesion / development −4.38
203000 at stathmin-like 2 STMN2 intracellular signaling cascade /neuron differentiation
−5.17 236300 at Phosphodiesterase 3A, cGMP-inhibited PDE3A lipid metabolism /signal transduction −3.85
220724 at hypothetical protein FLJ21511 FLJ21511 — −5.26
207504 at carbonic anhydrase VII CA7 one-carbon compound metabolism −8.08
204351 at S100 calcium binding protein P S100P — 4.38
229839 at hypothetical protein MGC45780 MGC45780 phosphate transport −5.04 202242 at transmembrane 4 superfamily member 2 TM4SF2 N-linked glycosylation −3.74
235849 at hypothetical protein MGC45780 MGC45780 phosphate transport −4.59
218756 s at hypothetical protein MGC4172 MGC4172 metabolism −3.65
215657 at — — — −7.77
215177 s at integrin, alpha 6 ITGA6 cell-matrix adhesion / cell-substrate junction assembly /integrin-mediated signaling pathway
2.96
204931 at transcription factor 21 TCF21 mesoderm development /regulation of transcription, DNA-dependent
−3.20
Table 2, continued
Probe Set ID Gene Name Gene Symbol Gene Ontology Biological Process Fold change 207003 at guanylate cyclase activator 2A
(guanylin)
GUCA2A signal transduction −7.55
IBD vs normal
212203 x at interferon induced transmembrane pro- tein 3 (1-8U)
IFITM3 immune response / response to biotic stimulus /
3.41 204279 at proteasome (prosome, macropain) sub-
unit, beta type, 9 (large multifunctional protease 2)
PSMB9 immune response / proteolysis and pep- tidolysis / ubiquitin-dependent protein catabolism
3.77
240389 at — — — −7.81
201601 x at interferon induced transmembrane pro- tein 1 (9–27)
IFITM1 cell surface receptor linked signal trans- duction/immune response /negative reg- ulation of cell proliferation
3.32
214022 s at interferon induced transmembrane pro- tein 1 (9–27)
IFITM1 cell surface receptor linked signal trans- duction /immune response /negative reg- ulation of cell proliferation
2.62
201649 at ubiquitin-conjugating enzyme E2L 6 UBE2L6 ubiquitin cycle 3.31
206059 at zinc finger protein 91 (HPF7, HTF10) ZNF91 carbohydrate metabolism / regulation of transcription, DNA-dependent
−2.22 224412 s at transient receptor potential cation chan-
nel, subfamily M, member 6
TRPM6 cation transport /protein amino acid phosphorylation
−7.06
213369 at — — — −6.27
212531 at lipocalin 2 (oncogene 24p3) LCN2 transport 10.96
type discriminatory genes has not been identified yet.
Best differentiating markers between UC and CD were cyclin-G2, tripartite motif-containing-31, TNFR shed- ding aminopeptidase regulator-1 and AMICA.
The functional classification of most differentially expressed genes was performed according to the anal- ysis of RMA top 100 genes in each disease type sub- groups. The list of the top 100 genes for each analysis setting including complete annotation and the complete microarray dataset are shown as supplementary infor- mation (Supplemental Table 2). Hierarchical cluster diagrams of the subgroups, based on RMA top 100 differentially expressed genes can be seen on Fig. 3.
3.4. Gene ontology of selected features
The representative gene ontology categories are shown to Tables 2 and 3. We have also mapped the se- lected features to chromosomes (Supplemental Fig. 1).
3.5. Taqman validation
Selection criteria for genes were the different expres- sion in microarray analysis and the availability of vali- dated TaqMan probes. Ten “literature” genes were also selected which were described as CRC related genes.
The complete results of the TaqMan measurements are presented on Supplemental Table 3. Forty six of the 52 measured genes correlated with the results obtained using Affymetrix microarrays at a significance of p <
0.05. The expression changes of the selected genes are
summarized in Table 4. The mRNA expression levels of selected discriminatory genes measured by Taqman RT-PCR are presented on Supplemental Fig. 2. Global clustering of all samples using the Taqman validated genes were also performed (Supplemental Fig. 3). Nor- mal and UC cases belong to two distinct clusters, but clusters of CRC and adenoma cases are not clearly sep- arated, demonstrating the expressional heterogeneity of CRC.
4. Discussion
Gene expression profiling of 52 colonic biopsy sam- ples was done by whole genomic HGU133 Plus 2.0 microarrays in order to identify disease specific gene expression markergroups for objective classification.
We aimed to develop diagnostic mRNA expression patterns for indentification of adenoma and different staged CRC and of the minimal list of genes which is suitable for discrimination of different types of IBD.
Examination of adenoma with/without dysplasia, CRC, IBD and normal samples in parallel can help to find condition specific gene expression alteration with a lower risk of unspecificity due to methodical reasons.
Comparative microarray analysis of biopsies from all
of these kinds of colonic diseases has not been report-
ed so far in the scientific literature. Oligonucleotide
whole genomic microarray analyses of biopsy samples
were found to be highly standardized, reproducible and
provided high quality array results regarding the array
Fig. 1. Combined clustering dendrogram of the top dicriminative transcripts for IBD, adenoma and CRC. The disease samples were grouped, normalized and compared to normal controls. Samples, not included in the classification of selected disease are shaded. Repeated transcripts are marked with arrows.
Fig. 2. Discriminant analysis of colonic biopsy specimens. Note the clear separation of the single classification groups based on the discriminatory genes detailed in the results section. Group 1=normal, Group 2=adenoma, Group 3=colorectal cancer, Group 4=inflammatory bowel disease.
Table 3 Classification resultsb,c
Group Predicted Group Membership Total
1 2 3 4
Original Count 1 8 0 0 0 8
2 0 15 0 0 15
3 0 1 14 0 15
4 0 0 1 14 15
% 1 100.0 0 0 0 100.0
2 0 100.0 0 0 100.0
3 0 6.7 93.3 0 100.0
4 0 0 6.7 93.3 100.0
Cross-validateda Count 1 8 0 0 0 8
2 0 15 0 0 15
3 1 1 13 0 15
4 0 0 1 14 15
% 1 100.0 0 0 0 100.0
2 0 100.0 0 0 100.0
3 6.7 6.7 86.7 0 100.0
4 0 0 6.7 93.3 100.0
aCross validation is done only for those cases in the analysis. In cross validation, each case is classified by the functions derived from all cases other than that case.
b96.2% of original grouped cases correctly classified.
c94.3% of cross-validated grouped cases correctly classified.
Fig. 3. Discriminating disease subtypes. Hierarchical clustering of genes associated with disease subtype-differenctiation using the top 100 differentially expressed genes obtained after RMA normalization. A. CRC Dukes B vs. CRC Dukes C-D. B. Adenoma without dysplasia vs adenoma with dysplasia. C. Ulcerative colitis vs Crohn’s disease.
Table 4
Taqman measurement of 52 genes
Taqman ID Gene Gene name Affymetrix ID Sample groups p value ddCt Fold change in
Symbol microarrays
Hs00153304 m1 CD44 CD44 antigen 212014 x at AD vs normal 1.82E-07 1.903.87
Hs00157859 m1 GUCA2A guanylate cyclase activator 2A 207003 at AD vs normal 0.000411 −4.34 −7.55 CRC vs normal 0.00871 −3.17 −2.33 Hs00171022 m1 CXCL12 chemokine (C-X-C motif) ligand 12 209687 at AD vs normal 0.00305 −2.04 −6.91 CRC vs normal 0.00735 −1.95 −2.32
Hs00179845 m1 MET met proto-oncogene 203510 at AD vs normal 1,41E-06 2.17 3.91
Hs00200350 m1 ABCA8 ATP-binding cassette, sub-family A (ABC1), member 8
204719 at AD vs normal 0.000610 −3.35 −12.78 UC vs normal 8.07E-05 −2.70 −2.27 Hs00205545 m1 ADAMDEC1 ADAM-like, decysin 1 206134 at AD vs normal 1.16E-05 −3.69 −6.81 CRC vs normal 9.18E-05 −2.74 −2.26 UC vs normal 0.00439 −1.21 −1.27 Hs00214306 m1 TRPM6 transient receptor potential cation
channel, subfamily M, member 6
224412 s at AD vs normal 5.79E-05 −4.73 −11.59 CRC vs normal 0.00827 −3.09 −2.73 UC vs normal 0.000385 −4.63 −3.48 Hs00153408 m1 MYC v-myc myelocytomatosis viral onco-
gene homolog (avian)
202431 s at AD vs normal 5,99E-06 2.35 2.03 Hs00163869 m1 CA2 carbonic anhydrase II 209301 at AD vs normal 0.000494 −3.75 −3.24 CRC vs normal 0.00193 −3.17 −2.14 Hs00171558 m1 TIMP1 tissue inhibitor of metalloproteinase 1 201666 at AD vs normal 3,90E-07 2.58 1.95 CRC vs normal 0.00153 2.74 3.40 UC vs normal 0.000219 2.36 2.03 Hs00236937 m1 CXCL1 chemokine (C-X-C motif) ligand 1 204470 at AD vs normal 1.66E-05 3.55 5.38 CRC vs normal 0.0114 3.84 13.10 UC vs normal 1.11E-05 4.04 4.78 Hs00236966 m1 CXCL2 chemokine (C-X-C motif) ligand 2 209774 x at AD vs normal 1.24E-05 3.98 5.49 CRC vs normal 0.00204 3.70 9.20 UC vs normal 0.000592 3.68 3.94 Hs00266139 m1 CA1 carbonic anhydrase I 205950 s at AD vs normal 0.000930 −6.13 −9.77 Hs00605175 m1 ADH1B alcohol dehydrogenase IB (class I), be-
ta polypeptide
209613 s at AD vs normal 0.00382 −3.49 −4.27
Hs00154124 m1 AQP8 aquaporin 8 206784 at AD vs normal 0.000378 −6.10 −6.20
CRC vs normal 0.0315 −5.33 −5.02
Hs00194353 m1 LCN2 lipocalin 2 212531 at AD vs normal 2.67E-07 6.13 4.85
CRC vs normal 0.000509 4.83 7.97 UC vs normal 2.15E-06 5.06 3.62
Hs00197437 m1 OLFM4 olfactomedin 4 212768 s at AD vs normal 2.57E-07 7.04 4.28
CRC vs normal 0.000179 6.20 3.70 UC vs normal 4.99E-05 5.68
Hs00154230 m1 CALU calumenin 214845 s at CRC vs normal 0.0145 1.60 3.23
Hs00169795 m1 VWF von Willebrand factor 202112 at CRC vs normal 0.551 3.61
UC vs normal 0.000112 2.44 2.75 Hs00229558 m1 AMN amnionless homolog (mouse) 223587 s at CRC vs normal 0.0499 −2.32 −3.91 Hs00235003 m1 PTGDR prostaglandin D2 receptor 215894 at CRC vs normal 0.997 −3 .30 Hs00266237 m1 COL4A1 collagen, type IV, alpha 1 211980 at CRC vs normal 0.0283 3.38 5.21
Hs00156076 m1 BGN biglycan 213905 x at CRC vs normal 0.120 2.24
Hs00169777 m1 PECAM1 platelet/endothelial cell adhesion molecule
208983 s at CRC vs normal 0.764 1.59
Hs00174103 m1 IL8 interleukin 8 202859 x at CRC vs normal 0.0283 7.21 20.20
UC vs normal 6.80E-06 5.77 4.13
Hs00204187 m1 DUOX2 dual oxidase 2 219727 at AD vs normal 5.77E-06 5.25 6.00
CRC vs normal 0.00363 4.91 9.70 UC vs normal 7.84E-05 6.35 6.43 Hs00160066 m1 PI3 protease inhibitor 3, skin-derived
(SKALP)
203691 at UC vs normal 0.000257 4.26 3.40
Hs00195812 m1 LIPG lipase, endothelial 219181 at UC vs normal 0.000588 1.35 1.82
Hs00197374 m1 UBD ubiquitin D 205890 s at UC vs normal 0.000261 3.20 2.97
Table 4, continued
Taqman ID Gene Gene name Affymetrix ID Sample groups p value ddCt Fold change in
Symbol microarrays
Hs00829485 sH IFITM2 interferon induced transmembrane pro- tein 2 (1-8D)
201315 x at UC vs normal 0.00287 1.66 1.65 Hs00171061 m1 CXCL3 chemokine (C-X-C motif) ligand 3 207850 at UC vs normal 7.48E-05 3.58 3.41 Hs00194145 m1 HMGCS2 3-hydroxy-3-methylglutaryl-
Coenzyme A synthase 2
204607 at UC vs normal 0.0104 −3.15 −2.14 Hs00234579 m1 MMP9 matrix metalloproteinase 9 203936 s at UC vs normal 0.00724 1.85 2.07 Hs00277299 m1 IL1RN interleukin 1 receptor antagonist 212657 s at UC vs normal 1.10E-05 5.30 3.03 Hs00165949 m1 TIMP3 tissue inhibitor of metalloproteinase 3 201150 s at CRC vs normal 0.274 1.50 CRC vs AD 0.000150 1.14 1.49 Hs00234160 m1 SPARC secreted protein, acidic, cysteine-rich
(osteonectin)
200665 s at CRC vs normal 0.617 2.90
CRC vs AD 0.00176 1.36 1.51
Hs00162613 m1 TCF4 transcription factor 4 212386 at CRC vs AD 0.000982 0.86 1.42 Hs00181211 m1 IGFBP3 insulin-like growth factor binding pro-
tein 3
210095 s at CRC vs AD 0.000216 1.56 1.57
Hs00189021 m1 CALD1 caldesmon 1 212077 at CRC vs AD 0.000188 1.24 1.53
Hs00190740 m1 SPARCL1 SPARC-like 1 (mast9, hevin) 200795 at CRC vs AD 0.000165 1.29 1.62 Hs00249930 s1 RBMS1 RNA binding motif, single stranded in-
teracting protein 1
215127 s at CRC vs AD 0.00566 1.52
Hs00255962 m1 TNS tensin 221748 s at CRC vs AD 0.000278 1.15 1.63
Genes from the literature
Hs00153350 m1 BCL2 B-cell CLL/lymphoma 2 203684 s at CRC vs normal 0.33308 Hs00153353 m1 BIRC5 baculoviral IAP repeat-containing 5
(survivin)
202095 s at CRC vs normal 0.02067 1.51 1.36 Hs00170248 m1 THBS2 thrombospondin 2 203083 at CRC vs normal 0.05582
Hs00171257 m1 TGFB1 transforming growth factor, beta 1 203085 s at CRC vs normal 0.47079
Hs00173626 m1 VEGF vascular endothelial growth factor 210513 s at CRC vs normal 0.04743 1.69 1.29 Hs00181385 m1 IGFR1 insulin-like growth factor receptor 1 203627 at CRC vs normal 0.31769
Hs00193306 m1 EGFR epidermal growth factor receptor 1565483 at CRC vs normal 0.53486 Hs00361600 m1 GUCA1B guanylate cyclase activator 1B (retina) 207003 at CRC vs normal 0.73175
Hs00426322 m1 ACHY S-adenosylhomocysteine hydrolase 200903 s at CRC vs normal 0.00581 1.32 1.34 Hs00162669 m1 TERT telomerase reverse transcriptase 207199 at CRC vs normal 0.80232
P value represents the correlation to the microarray data. ddCt represents the expression difference normalized to the ribosomal 18S expression.
The significant differential expression (p <0.05) is marked with bold.
sensitivity, present percentage and GAPDH 3’/5’ ra- tio. This type of analysis results in discriminative sig- natures, and gives an insight into the pathophysiolog- ical background of colonic diseases, and additionally, provides a data warehouse which can be further mined for in-depth pathway analyses. As recently described, joint analysis is more efficient than replication based analysis for two-stage genome-wide association stud- ies [33]. Therefore we used a one-stage genome wide analysis to identify relevant gene expression signatures.
For a classification problem comparable to our study a previous estimation suggested a required sample size of 51 subjects to detect a 2-fold change of expression level at alpha = 0.001 at the 90th percentile [41].
The main disease groups were individually com- pared to healthy controls. CRC samples were unequiv- ocally distinguished according to the expression level of 13 genes. Six of them were validated by Taqman RT-PCR. Among the discriminatory genes lipocalin 2 (LCN2), collagen 4 alpha 1 (COL4A1) and aquaporin
8 (AQP8) were mentioned earlier as CRC-associated genes. LCN2 transport molecule acts as chemotactic agent and also regulates the matrix metalloproteinase-9 activity. AQP8 water channel protein is a marker for non-proliferative colonic epithelial cells, but it is not expressed by adenoma and CRC in protein level. In correlation with the findings of Fischer et al., lower AQP8 mRNA level was found in CRC and adenoma samples in our study also [13].
Adenoma cases were characterized and distin-
guished according to the expression changes of 27 over-
lapping genes. Seven of them (overexpressed CD44
and MET, and underexpressed GUCA2A, CXCL12,
TRPM6, ABCA8, ADAMDEC1) were confirmed by
Taqman RT-PCR. CD44 cell surface glycoprotein anti-
gen is a receptor for hyaluronic acid, which can also
bind osteopontin, EGFR, matrix metalloproteases and
IGFBP3. The expression changes of CD44 can affect
several different cellular pathways including EGFR-
related proliferation and tumorigenesis, tumor tissue
remodeling and immune processes. Hepatocyte growth factor receptor (MET), which was found to be overex- pressed both in colon adenoma and CRC, may play an important role in colorectal tumorigenesis. Similarly to the results of Trovato et al., in our study elevated c-met mRNA level was observed both in adenoma and CRC biopsies, but CRC samples showed lower c-met expression than adenomas. Reduced expression of c- met can be associated to the progression of adenoma into carcinoma [36]. GUCA2A (guanylin) plays role in the regulation of ion transport in the colon. Expres- sion of guanylin is downregulated in human intestinal adenomas, moreover, recent results suggest that loss of guanylin activity leads to or is a result of adenocarci- noma [8]. The chemokine ligand 12 (CXCL12) which was found underexpressed both in different carcinomas earlier [32] and adenoma samples in our study, regu- lates cAMP production and ion transport in intestinal epithelial cells [12]. These data can support that alter- ations in ion transport of the colon are involved in col- orectal carcinogenesis. The exact cellular function and role in adenoma and tumor development of TRPM6, ABCA8 and ADAMDEC1 gene products have not yet been determined.
Several genes were found to show elevated mRNA level according to the adenoma-CRC sequence. TCF4 is a transcriptional factor involved in Wnt-signalling pathway which is altered in over 90% of CRCs. TCF4 participates in transcriptional regulation of genes asso- ciated with colon carcinogenesis including c-myc, cy- clin D1, TCF1, PPAR δ , MMP7 and MDR1. Tensin 1 (TNS1) which was also overexpressed in CRC com- pared to adenoma samples can also induce JNK and p38 activation leading to increased cell survival. RBMS1 is an another gene which was detected as being upregu- lated in CRC compared to adenoma, it is also involved in the malignant transformation process. RBMS1 is a modulator of c-myc, deregulates cell cycle controls and leads cells towards transforming pathways [28].
SPARC (osteonectin) was detected as overexpressed gene in CRC in several microarray-based studies [10, 29,42]. It is thought to play an important role in tissue remodeling, angiogenesis, and tumorigenesis. Contro- versial and conflicting data were published about the expression and function of insulin-like growth factor binding protein 3 and SPARCL1 in different types of cancers including CRC [19,20].
Ten discriminatory transcripts distinguish between
IBD samples and normal tissue. Overexpression of dif- ferent interferon-induced genes is highly represented among the discriminatory genes. Interferon induced transmembrane protein 3 (IFITM3) was strongly ex- pressed in severely inflamed colonic mucosa of UC both in our microarray analysis and other studies [17].
Moreover, IFITM3 showed high mRNA level in spo- radic cancers, and UC-associated cancers, therefore it can be a marker for identification of high cancer-risk group within the UC. PSMB9 and UBE2L6 interferon- induced discriminatory genes are in connection with the enhanced antigen processing and presentation. LCN2 which has been mentioned above as an upregulated CRC-associated gene is also overexpressed in colono- cytes and neutrophils in inflamed lesions of UC. Sim- ilarly to our findings, highly increased LCN2 mRNA levels were measured in UC samples in other microar- ray studies [11,24]. Alteration of epithelial magnesium absorption was also observed in our IBD samples, as the TRPM6 (transient receptor potential cation chan- nel, subfamily member 8) showed lower mRNA lev- el. CD cases are mainly featured by increased expres- sion of carbohydrate metabolism genes, while certain cell proliferation, apoptosis, immune regulation, trans- port, and ubiquitin-dependent protein catabolism genes were found to be overexpressed in UC compared with CD cases. However, the function of many dicrimi- natory genes has not been identified yet. Significant overexpression of cancer-related genes (CEACAM1, -7, CD24, PDGFD) in UC is potentially important, con- sidering reports of increased risk of developing CRC in this disease [6,9].
For validation of the marker properties of a given gene, we should use homogeneous high case-number sample groups for microarray analysis, and further ex- periments, but at least RT-PCR confirmation, are need- ed. We focused on individual markers and independent validation of markers. Ninety-four percent of 52 se- lected genes which were found to be over- or underex- pressed was confirmed by Taqman RT-PCR.
In conclusion, in our study we were able to distin-
guish not just between normal, adenoma, CRC and IBD
samples, but also among the different stages of CRC
using only easily-taken biopsy specimens. With a large
number of samples one can establish principal gene
lists that characterize distinct conditions, and if miniar-
rays will be commercially available, the daily routine
of diagnosis may be quicker and easier.
Supplemental
Supplement Table 1 Patients characteristics
Sample Affy ID Sex Age Localization Histology TNM Grade Dukes Dysplasia Taqman
analysis Adenoma
956* 956 U133 Plus 2.0 .CEL F 84 flexure hepatica adenoma villous severe
983* 983 U133 Plus 2.0 .CEL F 64 rectum adenoma tubulovillous severe Yes (3.)
1115* 1115 U133 Plus 2.0 .CEL F 75 coecum adenoma tubulovillous severe
1141 1141 U133 Plus 2.0 .CEL M 63 rectum adenoma tubulovillous moderate Yes (10.)
1187* 1187 U133 Plus 2.0 .CEL F 80 coecum adenoma tubulovillous moderate Yes (13.)
1312* 1312 U133 Plus 2.0 .CEL M 93 rectum adenoma villous severe Yes (15.)
1700* 1700 U133 Plus 2.0 .CEL F 69 coecum adenoma tubulovillous severe
1748* 1748 U133 Plus 2.0 .CEL F 78 colon desc adenoma villous severe Yes (32.)
1832* 1832 U133 Plus 2.0 .CEL M 56 sigma-colon desc adenoma villous moderate Yes (34.)
980 980 U133 Plus 2.0 .CEL F 83 coecum adenoma tubulovillous no Yes (2.)
995* 995 U133 Plus 2.0 .CEL M 58 coecum, coecum, rectum
adenoma tubulovillous no Yes (4.)
1138* 1138 U133 Plus 2.0 .CEL M 70 rectum adenoma tubulovillous no Yes (9.)
1154* 1154 U133 Plus 2.0 .CEL F 73 coecum adenoma tubulovillous no Yes (11.)
1419* 1419 U133 Plus 2.0 .CEL F 37 rectum adenoma villous no Yes (19.)
1830* 1830 U133 Plus 2.0 .CEL M 70 sigma adenoma tubulovillous no Yes (33.)
CRC
1158* 1158 U133 Plus 2.0 .CEL M 56 rectum adenocarcinoma T3N0M0 G2 B2 Yes (12.)
1293* 1293 U133 Plus 2.0 .CEL F 88 ascendent colon adenocarcinoma T3N0M0 G3 B2 Yes (14.) 1486* 1486 U133 Plus 2.0 .CEL F 51 hepatic flexure adenocarcinoma T2N0M0 G1 B1 Yes (23.)
1708* 1708 U133 Plus 2.0 .CEL F 72 sigma adenocarcinoma T3N0M0 G2 B2 Yes (30.)
1739* 1739 U133 Plus 2.0 .CEL F 76 colon desc adenocarcinoma T4N0M0 G1 B3 Yes (31.)
1761 1761 U133 Plus 2.0 .CEL M 58 rectum adenocarcinoma T2N0M0 G2 B1
1883* 1883 U133 Plus 2.0 .CEL M 56 coecum tumor adenocarcinoma T3N0M0 G2 B2 Yes (35.) 1146* 1146 U133 Plus 2.0 .CEL M 46 descendent colon adenocarcinoma T2N1M0 G2 C1
1316* 1316 U133 Plus 2.0 .CEL M 85 lienic flexure adenocarcinoma T3N1M1 G2 D Yes (16.) 1377* 1377 U133 Plus 2.0 .CEL F 69 sigma adenocarcinoma T4N1M0 G1-2 C3
1479* 1479 U133 Plus 2.0 .CEL F 77 sigma adenocarcinoma T4NOM1 G1 D
1494* 1494 U133 Plus 2.0 .CEL M 73 rectum adenocarcinoma T3N1M1 G1 D Yes (24.)
1499* 1499 U133 Plus 2.0 .CEL M 65 rectum adenocarcinoma T3N0M1 G1 D
1556* 1556 U133 Plus 2.0 .CEL F 66 coecum adenocarcinoma T3N1M1 G2 D Yes (26.)
1651 1651 U133 Plus 2.0 .CEL F 59 rectum adenocarcinoma T2N0M1 G1 D Yes (28.)
IBD
939 939 U133 Plus 2.0 .CEL F 34 sigma,rectum severe active ulcerative colitis
no Yes (1.)
1017 1017 U133 Plus 2.0 .CEL F 39 total colon severe active ulcerative pancolitis
no Yes (5.)
1060 1060 U133 Plus 2.0 .CEL F 73 total colon severe active ulcerative colitis
no Yes (7.)
1156 1156 U133 Plus 2.0 .CEL M 45 sigma,rectum severe active ulcerative colitis
no 1175 1175 U133 Plus 2.0 .CEL M 43 total colon severe active ulcerative
colitis
no 1368 1368 U133 Plus 2.0 .CEL F 24 total colon severe active ulcerative
colitis
mild Yes (18.) 1533 1533 U133 Plus 2.0 .CEL F 35 rectum,sigma severe active ulcerative
colitis
no Yes (25.) 1606 1606 U133 Plus 2.0 .CEL F 35 total colon severe active ulcerative
pancolitis
no Yes (27.) 1665 1665 U133 Plus 2.0 .CEL M 66 total colon, main-
ly sigma,rectum
severe active ulcerative colitis
mild- moderate
Yes (29.)
Supplement Table 1, continued
Sample Affy ID Sex Age Localization Histology TNM Grade Dukes Dysplasia Taqman
analysis 923 923 U133 Plus 2.0 .CEL F 37 sigma,rectum severe active Crohn’s
disease
no 1110 1110 U133 Plus 2.0 .CEL F 16 total colon severe active Crohn’s
disease
mild Yes (8.) 1118 1118 U133 Plus 2.0 .CEL M 26 right side severe active Crohn’s
disease
no 1670 1670 U133 Plus 2.0 .CEL M 23 total colon severe active Crohn’s
disease
no 1802 1802 U133 Plus 2.0 .CEL F 26 total colon severe active Crohn’s
disease
no Normal
1024 1024 U133 Plus 2.0 .CEL F 47 normal Yes (6.)
1081 1081 U133 Plus 2.0 .CEL F 57 normal
1114 1114 U133 Plus 2.0 .CEL F 60 normal
1122 1122 U133 Plus 2.0 .CEL M 45 normal
1357 1357 U133 Plus 2.0 .CEL M 47 normal Yes (17.)
1431 1431 U133 Plus 2.0 .CEL M 50 normal Yes (20.)
1440 1440 U133 Plus 2.0 .CEL F 44 normal Yes (21.)
1456 1456 U133 Plus 2.0 .CEL M 55 normal Yes (22.)
Microsatellite instability analysis was done from samples marked with *.
GEO Accession numbers: “normal: GSM95473 – GSM95480”, “adenoma: GSM95481 – GSM95495”, “CRC: GSM95496 – GSM95510”,
“IBD: GSM95511 – GSM95525”.
Supplement Figure 1. Chromosomal localization of discriminatory genes.
The Supplemental Table 2 and the Supplemental Table 3 are available on the http://3dhistech.com/en/article/
DMA-511 website.
Supplement Figure 2. mRNA expression levels of selected discriminatory genes measured by Taqman RT-PCR. dCt is the expression value normalized to the ribosomal 18S protein.
Supplement Figure 3. Global clustering of all samples measured by Taqman RT-PCR according to the Taqman validated genes. Probably due the heterogeneity of CRC samples they do not cluster together during global clustering using Taqman-generated results.
Acknowledgements
We thank hereby the support of Professor Zolt ´an Szentirmay for the microsatellite instability analysis, of L´aszl´o Nagy MD, PhD and Be ´ata Scholtz PhD for Taqman real-time PCR analysis and of Zolt ´an Sz´all´asi MD, PhD for manuscript review. The study was sup- ported in part by the National Office for Research and Technology, Hungary.
References
[1] D. Agrawal, T. Chen, R. Irby, J. Quackenbush, A.F. Chambers, M. Szabo, A. Cantor, D. Coppola and T.J. Yeatman, Osteo- pontin identified as colon cancer tumor progression marker, C R Biol 326 (2003), 1041–1043.
[2] E. Bandres, V. Catalan, I. Sola , B. Honorato, E. Cubedo, L. Cordeu, E. Andion, A. Escalada, R. Zarate, E. Salgado, N. Zabalegui, F. Garcia, F. Garc´ıa and J. Garcia-Foncillas, Dysregulation of apoptosis is a major mechanism in the lymph node involvement in colorectal carcinoma, J Oncol Rep 12 (2004), 287–292.
[3] F. Bertucci, S. Salas, S. Eysteries, V. Nasser, P. Finetti, C.
Ginestier, E. Charafe-Jauffret, B. Loriod, L. Bachelart, J.
Montfort, G. Victorero, F. Viret, V. Ollendorff, V. Fert, M.
Giovaninni, J.R. Delpero, C. Nguyen, P. Viens, G. Monges, D. Birnbaum and R. Houlgatte, Gene expression profiling of colon cancer by DNA microarrays and correlation with histo- clinical parameters, Oncogene 23 (2004), 1377–1391.
[4] K. Birkenkamp-Demtroder, L.L. Christensen, S.H. Olesen, C.M. Frederiksen, P. Laiho, L.A. Aaltonen, S. Laurberg, F.B.
Sorensen, R. Hagemann and T.F. Orntoft, Gene expression in colorectal cancer, Cancer Res 62 (2002), 4352–4363.
[5] K. Birkenkamp-Demtroder, S.H. Olesen, F.B. Sorensen, S.
Laurberg, P. Laiho, L.A. Aaltonen and T.F. Orntoft, Differen- tial gene expression in colon cancer of the caecum versus the sigmoid and rectosigmoid, Gut 54 (2005), 374–384.
[6] O. Brostrom, R. Lofberg, B. Nordenvall, A. Ost and G. Hellers, The risk of colorectal cancer in ulcerative colitis. An epidemi- ologic study, Scand J Gastroenterol 22 (1987), 1193–1199.
[7] S.T. Chiu, F.J. Hsieh, S.W. Chen, C.L. Chen, H.F. Shu and H. Li, Clinicopathologic correlation of up-regulated genes identified using cDNA microarray and real-time reverse transcription-PCR in human colorectal cancer, Cancer Epi- demiol Biomarkers Prev 14 (2005), 437–443.
[8] M.B. Cohen, J.A. Hawkins and D.P. Witte, Guanylin mRNA expression in human intestine and colorectal adenocarcinoma, Lab Invest 78 (1998), 101–108.
[9] C.M. Costello, N. Mah, R. Hasler, P. Rosenstiel, G.H. Waet- zig, A. Hahn, T. Lu, Y. Gurbuz, S. Nikolaus, M. Albrecht, J. Hampe, R. Lucius, G. Kloppel, H. Eickhoff, H. Lehrach, T. Lengauer and S. Schreiber, Dissection of the inflamma- tory bowel disease transcriptome using genome-wide cDNA microarrays, PLoS Med 2 (2005), e199.
[10] R.S. Croner, T. Foertsch, W.M. Brueckl, K. Guenther, R.
Siebenhaar, C. Stremmel, K.E. Matzel, T. Papadopoulos, T.
Kirchner, J. Behrens, L. Klein-Hitpass, M. Stuerzl, W. Hohen- berger and B. Reingruber, Common denominator genes that distinguish colorectal carcinoma from normal mucosa, Int J Colorectal Dis 20 (2005), 353–362.
[11] T.P. Dooley, E.V. Curto, S.P. Reddy, R.L. Davis, G.W. Lam- bert, T.W. Wilborn and C.O. Elson, Regulation of gene ex- pression in inflammatory bowel disease and correlation with IBD drugs: screening by DNA microarrays, Inflamm Bowel Dis 10 (2004), 1–14.
[12] M.B. Dwinell, H. Ogawa, K.E. Barret and M.F. Kagnoff, SDF- 1/CXCL12 regulates cAMP production and ion transport in in- testinal epithelial cells via CXCR4, Am J Physiol Gastrointest Liver Physiol 286 (2004), G844–G850.
[13] H. Fischer, R. Stenling, C. Rubio and A. Lindblom, Differ- ential expression of aquaporin 8 in human colonic epithelial cells and colorectal tumors, BMC Physiol 1 (2001), 1.
[14] C.M. Frederiksen, S. Knudsen, S. Laurberg and T.F. Orntoft, Classification of Dukes’ B and C colorectal cancers using expression arrays, J Cancer Res Clin Oncol 129 (2003), 263–
271.
[15] O. Galamb, F. Sipos, E. Dinya, S. Spisak, Z. Tulassay and B. Molnar, mRNA expression, functional profiling and mul- tivariate classification of colon biopsy specimen by cDNA overall glass microarray, World J Gastroenterol 12 (2006), 6998–7006.
[16] O. Galamb, F. Sipos, K. Fischer, Z. Tulassay and B. Molnar, The results of the expression array studies correlate and en- hance the known genetic basis of gastric and colorectal cancer, Cytometry B Clin Cytom 68 (2005), 1–17.
[17] T. Hisamatsu, M. Watanabe, H. Ogata, T. Ezaki, S. Hozawa, H.
Ishii, T. Kanai and T. Hibi, Interferon-inducible gene family 1- 8U expression in colitis-associated colon cancer and severely inflamed mucosa in ulcerative colitis, Cancer Res 59 (1999), 5927–5931.
[18] R.A. Irizarry, L. Gautier and L.M. Cope, The Analysis of Gene Expression Data: Methods and Software, Springer Verlag chapter 4, 2003.
[19] S. Kansra, D.Z. Ewton, J. Wang and E. Friedman, IGFBP-3 mediates TGF beta 1 proliferative response in colon cancer cells, Int J Cancer 87 (2000), 373–378.
[20] I. Kirman, N. Poltoratskaia, P. Sylla and R.L. Whelan, Insulin- like growth factor-binding protein 3 inhibits growth of exper- imental colocarcinoma, Surgery 136 (2004), 205–209.
[21] O. Kitahara, Y. Furukawa, T. Tanaka, C. Kihara, K. Ono, R.
Yanagawa, M.E. Nita, T. Takagi, Y. Nakamura and T. Tsuno- da, Alterations of gene expression during colorectal carcino- genesis revealed by cDNA microarrays after laser-capture mi- crodissection of tumor tissues and normal epithelia, Cancer Res 61 (2001), 3544–3549.
[22] H.C. Kwon, S.H. Kim, M.S. Roh, J.S. Kim, H.S. Lee, H.J.
Choi, J.S. Jeong, H.J. Kim and T.H. Hwang, Gene expression profiling in lymph node-positive and lymph node-negative col- orectal cancer, Dis Col Rect 47 (2004), 141–152.
[23] T. Langmann, C. Moehle, R. Mauerer, M. Scharl, G. Liebisch, A. Zahn, W. Stremmel and G. Schmitz, Loss of detoxification in inflammatory bowel disease: dysregulation of pregnane X receptor target genes, Gastroenterology 127 (2004), 26–40.
[24] I.C. Lawrance, C. Fiocchi and S. Chakravarti, Ulcerative col- itis and Crohn’s disease: distinctive gene expression profiles and novel susceptibility candidate genes, Hum Mol Genet 10 (2001), 445–456.
[25] M. Li, Y.M. Lin, S. Hasegawa, T. Shimokawa, K. Murata, M.
Kameyama, O. Ishikawa, T. Katagiri, T. Tsunoda, Y. Nakamu- ra and Y. Furukawa, Genes associated with liver metastasis of colon cancer, identified by genome-wide cDNA microarray, Int J Oncol 24 (2004), 305–312.
[26] Y.M. Lin, Y. Furukawa, T. Tsunoda, C.T. Yue, K.C. Yang and Y. Nakamura, Molecular diagnosis of colorectal tumors
by expression profiles of 50 genes expressed differentially in adenomas and carcinomas, Oncogene 21 (2002), 4120–4128.
[27] E.E. Mannick, J.C. Bonomolo, R. Horswell, J.J. Lentz, M.S.
Serrano, A. Zapata-Velandia, M. Gastanaduy, J.L. Himel, S.L.
Rose, J.N. Udall Jr, C.A. Hornick and Z. Liu, Gene expression in mononuclear cells from patients with inflammatory bowel disease, Clin Immunol 112 (2004), 247–257.
[28] T. Niki, S. Izumi, Y. Sa¨egusa, T. Taira, T. Takai, S.M. Iguchi- Ariga and H. Ariga, MSSP promotes ras/myc cooperative cell transforming activity by binding to c-Myc, Genes Cells 5 (2000), 127–141.
[29] D.A. Notterman, U. Alon, A.J. Sierk and A.J. Levine, Tran- scriptional gene expression profiles of colorectal adenoma, adenocarcinoma, and normal tissue examined by oligonu- cleotide arrays, Cancer Res 61 (2001), 3124–3130.
[30] S. Okahara, Y. Arimura, T. Yabana, K. Kobayashi, A. Gotoh, S. Motoya, A. Imamura, T. Endo and K. Imai, Inflammatory gene signature in ulcerative colitis with cDNA macroarray analysis, Aliment Pharmacol Ther 21 (2005), 1091–1097.
[31] J. Puleston, M. Cooper, S. Murch, K. Bid, S. Makh, P. Ash- wood, A.H. Bingham, H. Green, P. Moss, A. Dhillon, R. Mor- ris, S. Strobel, R. Gelinas, R.E. Pounder and A. Platt, A dis- tinct subset of chemokines dominates the mucosal chemokine response in inflammatory bowel disease, Aliment Pharmacol Ther 21 (2005), 109–120.
[32] K. Shibuta, N.A. Begum, M. Mori, K. Shimoda, T. Akiyoshi and G.F. Barnard, Reduced expression of the CXC chemokine hIRH/SDF-1alpha mRNA in hepatoma and digestive tract can- cer, Int J Cancer 73 (1997), 656–662.
[33] A.D. Skol, L.J. Scott, G.R. Abecasis and M. Boehnke, Joint analysis is more efficient than replication-based analysis for two-stage genome-wide association studies, Nat Genet 38 (2006), 209–213.
[34] A. Sturn, J. Quackenbush and Z. Trajanoski, Genesis: cluster analysis of microarray data, Bioinformatics 18 (2002), 207–
208.
[35] R. Tibshirani, T. Hastie, B. Narasimhan and G. Chu, Diag- nosis of multiple cancer types by shrunken centroids of gene expression, Proc Natl Acad Sci USA 99 (2002), 6567–6572.
[36] M. Trovato, E. Vitarelli, M. Grosso, S. Alesci, S. Benvenga, F.
Trimarchi and G. Barresi, Immunohistochemical expression of HGF, c-MET and transcription factor STAT3 in colorectal tumors, Eur J Histochem 48 (2004), 291–297.
[37] Tumor Analysis Best Practices Working Group, Expression profiling-best practices for data generation and interpretation in clinical trials, Nat Rev Genet 5 (2004), 229–237.
[38] S.M. Uthoff, M.R. Eichenberger, R.K. Lewis, M.P. Fox, C.J.
Hamilton, T.L. McAuliffe, H.L. Grimes and S. Galandiuk, Identification of candidate genes in ulcerative colitis and Crohn’s disease using cDNA array technology, Int J Oncol 19 (2001), 803–810.
[39] R.N. Van Gelder, M.E. von Zastrow, A. Yool, W.C. Dement, J.D. Barchas and J.H. Eberwine, Amplified RNA synthesized from limited quantities of heterogenous cDNA, Proc Natl Acad Sci USA 87 (1990), 1663–1667.
[40] Y. Wang, T. Jatkoe, Y. Zhang, M.G. Mutch, D. Talantov, J.
Jiang, H.L. McLeod and D. Atkins, Gene expression profiles and molecular markers to predict recurrence of Dukes’ B colon cancer, J Clin Oncol 22 (2004), 1564–1571.
[41] C. Wei, J. Li and R.E. Bumgarner, Sample size for detect- ing differentially expressed genes in microarray experiments, BMC Genomics 5 (2004), 87.
[42] N.S. Williams, R.B. Gaynor, S. Scoggin, U. Verma, T.
Gokaslan, C. Simmang, J. Fleming, D. Tavana, E. Frenkel and C. Becerra, Identification and validation of genes involved in the pathogenesis of colorectal cancer using cDNA microarrays and RNA interference, Clin Cancer Res 9 (2003), 931–946.
[43] R. Yanagawa, Y. Furukawa, T. Tsunoda, O. Kitahara, M.
Kameyama, K. Murata, O. Ishikawa and Y. Nakamura, Genome-wide screening of genes showing altered expression in liver metastases of human colorectal cancers by cDNA mi- croarray, Neoplasia 3 (2001), 395–401.
[44] T.T. Zou, F.M. Selaru, Y. Xu, V. Shustova, J. Yin and Y. Mori, Application of cDNA microarrays to generate a molecular taxonomy capable of distinguishing between colon cancer and normal colon, Oncogene 21 (2002), 4855–4862.