FACTORS AFFECTING SYNONYMOUS CODON USAGE OF HOUSEKEEPING GENES
IN DROSOPHILA MELANOGASTER
Yi Wen Lu+ and Tai Sheng Chiu+ *
Department of Life Science, National Taiwan University, No. 1, Sec. 4, Roosevelt Rd., Taipei 10617, Taiwan
(Received: July 17, 2017; accepted: January 9, 2018)
Housekeeping genes (HK genes) are required for cell survival and the maintenance of basic cellular func- tions. The investigation of factors affecting codon usage patterns in HK genes of insects can help in understanding the molecular evolution of insects and aid the development of insect pest management strategies. In this study, we employed bioinformatics approaches to analyze the codon usage bias (CUB) of HK genes in the insect model organism, Drosophila melanogaster. A comparison of CUB between 1107 HK genes and 1084 high tissue specificity genes suggested that HK genes have higher CUB in D. melanogaster. In addition, we found that CUB inversely correlates with the non-synonymous substitu- tion rate of HK genes. Therefore, we attempted to identify the factors that potentially influence the codon usage pattern of HK genes. Our results suggest that mutation pressure and natural selection highly cor- relate with CUB in the HK genes of D. melanogaster and that two topological properties of HK proteins (proportion of protein interacting length and protein connectivity) also correlate with CUB in the HK genes of D. melanogaster. This study provides insight into CUB in the HK genes of D. melanogaster, and the results can support future investigations of potential applications in agricultural and biomedical field.
Keywords: Housekeeping gene – codon usage bias – mutation bias – translational selection – protein topology
INTRODUCTION
In the protein synthesis process, 61 codons code for only 20 amino acids. Multiple codons that code for the same amino acid are called synonymous codons. Synonymous codons are not used at the same frequency in several organisms, existing from prokar- yotes to eukaryotes [11, 17]. This phenomenon is known as codon usage bias (CUB).
CUB varies among different species and among genes in the same genome [35].
Additionally, evidences have been accumulated that some genes with slow-evolving nonsynonymous sites have higher CUB [37]. Many factors have been proposed to be related to CUB, including base compositional mutation bias [21], gene expression level [36], gene length [25], codon-anticodon binding [28], tRNA abundance [10], protein structure [18], and so on. Although the exact mechanisms of CUB remain
* Corresponding author; e-mail address: tschiu@ntu.edu.tw
+The authors contributed equally to this work.
unclear, mutation bias and natural selection are two possible candidates in many spe- cies [32]. The mutation explanation for CUB is that the non-randomness of muta- tional patterns affects the usage frequencies of synonymous codons (e.g., GC-rich organisms use more G- or C-ending codons). According to the natural selection explanation, CUB is caused by selection to increase the efficiency and/or accuracy of translation (such as translation selection, some highly expressed genes have higher CUB than do lowly expressed genes). In some organisms, CUB is shaped by both mutation bias and natural selection [32]. In addition to research on the influences of translational selection and mutation bias on codon usage, research on the role of pro- tein structure in synonymous codon usage has surged in recent years [6]. In yeast proteins, β-sheets are encoded by coding sequences that are enriched in optimal codons [31]. Previous cross-taxon analyses have suggested that protein buried sites and structurally important sites are associated with optimal codons [50]. In addition, early studies reported that the proportion of protein interacting length and protein connectivity both correlate with protein evolution [15, 33]. However, the correlations between these two topological properties and CUB are unclear.
Housekeeping genes (HK genes) are constitutively expressed in various tissues and are involved in the maintenance of cellular functions [4]. The study of synonymous codon usage in HK genes of insects can provide helpful information about the molecu- lar evolutionary mechanisms of insects and facilitate the development of effective control strategies for insect pests to reduce insect-borne diseases and agricultural losses.
In the insect model animal, D. melanogaster, the relationships between CUB and HK genes and the underlying mechanisms remain unclear. The effect of CUB on the evolu- tion of HK genes has not been investigated in detail. In addition, few efforts have been made to explore whether any relationship exists between each of four factors (transla- tional selection, mutation bias and two topological properties of HK proteins) and synonymous codon usage in HK genes of D. melanogaster. The aims of this study are to investigate the synonymous codon usage of HK genes in D. melanogaster and to assess the impact of synonymous codon usage on the evolution of HK genes and evaluate possible factors related to synonymous codon usage in HK genes of D. mela- nogaster. Published gene expression data concerning 13 D. melanogaster tissues were used to calculate tissue specificity and identify 1,107 HK genes and 1,084 high tissue specificity genes (HTS genes) for further synonymous codon usage analyses. The results of this study may help shed some light on the possible factors influencing syn- onymous codon usage in the HK genes of D. melanogaster.
MATERIAL AND METHODS Gene expression data
Gene expression data of adult D. melanogaster were acquired from the FlyAtlas database (http://flyatlas.gla.ac.uk/) [34]. A total of 18,880 probe sets covered 13,250 D. melanogaster genes. To prevent errors associated with re-counting, we eliminated
genes that were detected by the same probe or more than one probe set. The Presence/
Absence calls of the gene expression data were calculated according to the Affymetrix Microarray Suite (MAS) version 5.0 algorithm with the default parameters [19].
Genes were listed as “present” if statistically significant expression was detected in at least three of four replicates. Finally, we obtained 11,166 unambiguous genes with expression data. We used the gene expression data of 13 D. melanogaster tissues in this paper (brain, thoracico-abdominal ganglion, salivary gland, crop, midgut, hind- gut, tubule, fat body, ovary, testis, accessory glands, virgin spermatheca, and heart).
To compare the expression intensity of each gene, we calculated the mean expression intensity of each gene across the 13 tissues for analyses.
Tissue specificity
The tissue specificity index τ [44] is defined as
Where “n” is the number of D. melanogaster tissues examined and S(i, max) is the highest expression intensity of gene i across all of the examined tissues. If a gene is equally expressed in all tissues, the index is zero. However, if a gene is expressed in only one or a few tissues, the index is close to one. The genes obtained from the FlyAtlas database were sorted by tissue specificity index, and 10% of genes from each end of the list were considered. The genes with high tissue specificity (top 10%) were defined as HTS genes. Genes that were expressed in every tissue with low tissue specificity (bottom 10%) were defined as HK genes. Based on the above criteria, we obtained 1,107 HK genes and 1,084 HTS genes.
Codon usage bias analysis
Codon bias index (CBI) was also used to measure the usage of optimal codons in this study [1]. If a gene has extreme codon bias, the value of CBI will equal 1. If a gene shows random codon usage, the value of CBI will equal 0.
Effective number of codons (ENC) was used to examine the codon usage bias in this study [42]. The value of ENC lies in the range of 20 to 61. If only one codon is used for each amino acid, the value of ENC is 20. If all synonymous codons are equally used for each amino acid, the value of ENC is 61.
τ =
−
−
∑
= 11
2 1 2
log ( . ) log ( ,max)
S i j S i n
j n
Nucleotide composition
The GC and GC3 contents of the genes were computed via DnaSP v5 [23]. The GC3 content (the frequency of codons ending in G or C excluding Met, Trp and stop codons) is used to measure the extent of base composition bias [49].
Percentage of protein interacting length
The ratio of protein interacting domain length was calculated from following for- mula:
Protein domain data were retrieved from the PFAM database (http://pfam.xfam.org/) [14]. The following cutoff values were used for domain assignment [20]: (1) matched sequence length >80% of domain length; (2) e-value of alignment <1.0×10⁻⁴; (3) domain length >12 amino acids. Protein length data were retrieved from the UniProt database (http://www.uniprot.org/) [2].
Protein–protein interaction data
The protein–protein interaction data of D. melanogaster proteins used in this study were obtained from the IntAct database (http://www.ebi.ac.uk/intact/) [29]. To avoid false positives in the identification of protein interactions, we used two-hybrid exper- iment data of the protein–protein interactions from the IntAct database.
Estimation of nonsynonymous substitution rates
The coding sequences of D. melanogaster HK and HTS genes were obtained from FlyBase [7]. The orthologous gene sequences of D. melanogaster HK and HTS genes in D. yakuba were retrieved from OrthoDB [40]. The split between D. melanogaster and D. yakuba occurred approximately 12.8 MYA (million years ago) [38]. D. mela- nogaster – D. yakuba orthologous gene pairs were used for estimating the rates of nonsynonymous nucleotide substitution [24]. Nonsynonymous substitution rates were estimated based on the nucleotide alignments of each gene by using the maxi- mum likelihood method implemented with the PAML package [45, 46].
Percentage of protein interacting length = sum of interacting domainn length protein length .
Statistical analyses
Pairwise comparisons of variables were performed with the nonparametric Mann–
Whitney U-test. The nonparametric Spearman rank correlation test was used to assess the degree of association between two variables. SPSS software (version 22.0) was used to perform all statistical analyses.
RESULTS AND DISCUSSION
Codon bias differences between HK and HTS genes
We used ENC and CBI to examine the extent of CUB in D. melanogaster HK and HTS genes. Differences in CUB between HK and HTS genes were analyzed using the nonparametric Mann-Whitney U-test. Table 1 presents the means of ENC and CBI for HK and HTS genes. The mean CBI of HK genes was higher than that of HTS genes, and the mean ENC of HK genes was lower than that of HTS genes. The results indi- cated that HK genes had higher CUB than did HTS genes. We also calculated the means of CBI and ENC for 1100 genes from the middle of the tissue specificity index list. The mean CBI and ENC for this middle group were between the CUB index values of HK and HTS genes (Table 1). Why do the evolutionary forces shape the codon usage patterns of HK genes? Carlini and Stephan [5] substituted six and ten optimal codons for Leu with unpreferred codons in the Drosophila Adh gene and observed 19% and 24% decreases in ADH protein production, respectively. Fath et al. [13] investigated the effect of codon optimization on the protein expression levels of 50 genes representing five classes of human proteins (transcription factors, riboso- mal and polymerase subunits, protein kinases, membrane proteins and immunomodu- lators) in Human Embryonic Kidney 293T cells. They observed that 86% of the optimized constructs increased their protein expression levels. These studies revealed that CUB plays an important role in protein biosynthesis. HK genes are expressed in various tissues and play essential roles in the maintenance of cellular functions, whereas HTS genes are expressed only in one or a few tissues. Evolutionary forces might shape the codon usage patterns of HK genes, thereby contributing to the stable and sufficient biosynthesis of HK proteins for the maintenance of basic functionality in most functioning cells. Manipulation of the preferred codons of insect HK genes might affect the expression of insect HK proteins and might be useful for managing insect pest populations.
GC
3content and gene expression level correlate with the CUB of HK genes
HK genes have higher CUB than do HTS genes. Which factors might contribute to the higher CUB in HK genes? We hypothesized that translational selection and muta-
tional bias correlate with CUB in HK genes of D. melanogaster. To test this hypo- thesis, we performed correlation analyses of CUB and these two factors. We first compared these two factors between HK and HTS genes by performing nonparamet- ric Mann–Whitney U-tests. The mean GC content was higher for HK genes than for HTS genes (Table 1). Due to the higher GC content, G- or C-ending codons are expected to predominate in HK genes. We found that the GC3 content of HK genes correlated with the GC content of HK genes (correlation coefficient ρ = 0.774, p value = 2.221×10–195). The mean GC3 content was higher for the HK genes than for the HTS genes (Table 1). When comparing expression level between HK and HTS genes, we found that the mean expression level was higher for the HK genes than for the HTS genes (Table 1).
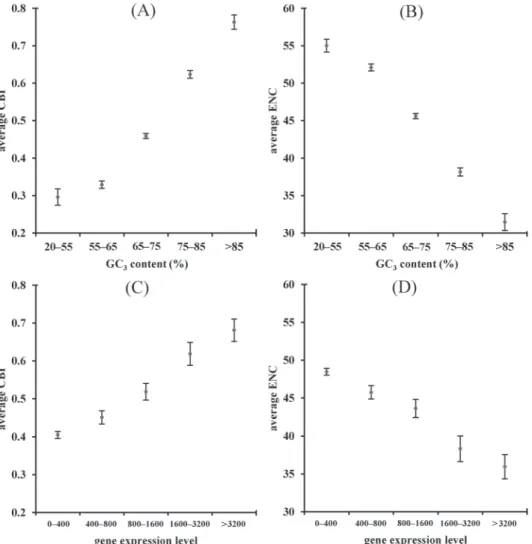
The results indicate that HK genes have higher GC3 content and expression level than do HTS genes. Next, we conducted correlation analyses of CUB and these two factors. Table 2 and Fig. 1A–B show that CBI and ENC strongly correlate with GC3 content, suggesting that mutational bias might play an important role in the CUB of HK genes. The bias for cytosine and guanine at the third position in preferred codons has also been reported previously. Vicario et al. [39] analyzed CUB among 12 species of Drosophila genomes and found that GC3 codons were preferentially used in 11 species (i.e., all except D. willistoni). Previous studies reported that genes with high GC3 (or high GC) content differ from those with low GC3 (or low GC) content at transcription stage. Kudla et al. [22] compared the expressions of genes with different GC3 contents (human HSPA1A GC3 = 92% and HSPA8 GC3 = 46%). Although the coding regions and corresponding protein sequences of these two genes are similar, the high-GC3 gene exhibited an up to 10-fold greater protein level relative to the expression level of the low-GC3 gene. A series of experiments demonstrated that this difference was due to increasing the steady-state mRNA level of high-GC3 gene.
Newman et al. [27] investigated differences in codon bias and GC content in the expression of mammalian Toll-like receptor7 genes (Tlr7). They found that subopti- mal codon bias (low GC content) can limit the transcription of Tlr7 and codon opti-
Table 1
Average values of Effective number of codons (ENC), Codon bias index (CBI), GC content, GC3 con- tent and expression level for HK and HTS genes
CUB index HK HTS p value
CBI 0.457 (0.391) 0.370 2.588×10–45
ENC 46.001 (49.975) 51.670 5.248×10–75
GC content 55% 51.5% 2.622×10–58
GC3 content 68% 59.4% 3.679×10–78
Expression level 804.550 118.183 2.593×10–213
*Values in parentheses are the mean CBI and ENC for middle group of the tissue specificity index list. P values (two tailed nonparametric Mann–Whitney U-test) show significant differences between above properties for HK gene group and HTS gene group.
mization (higher GC content) of Tlr7 increases the rate of transcription. Zamft et al.
[47] reported that RNA polymerases II of S. cerevisiae pause for shorter periods and less frequently on GC-rich templates than they do on AT-rich templates. Mutational pressure due to GC compositional constraints might drive the evolution of synony- mous codon usage in HK genes to maintain stable and efficient transcription.
To explore the relationship between CUB and gene expression level, we performed correlation analyses. As shown in Table 2 and Fig. 1C–D, CBI and ENC significantly correlate with gene expression level, indicating that gene expression level might be an important factor shaping codon usage in HK genes. A correlation between gene expression level and CUB was also observed in a previous Expressed Sequence Tag
Fig. 1. Scatter Diagrams show correlation between (A) CBI and GC3 content (B) ENC and GC3 content (C) CBI and gene expression level (D) ENC and gene expression level in HK genes. The error bar shows
95% confidence interval of the mean
(EST) analysis of 1,550 D. melanogaster genes [12]. Researchers have suggested that highly expressed genes are under translational selection to use the optimal codons [32]. Two hypotheses have been proposed to explain the selective forces shaping codon usage in highly expressed genes [6]. The translational efficiency hypothesis states that preferred codons are under selection in highly expressed genes because of their faster translation rate. A recent study for monitoring translation in real time in mammalian cells showed that the translation rate of codon-optimized mRNAs is faster (4.9 codons per second) than that of non-optimized mRNAs (3.1 codons per second) [43]. A cycloheximide-free ribosome profiling experiment in yeast reported that ribosome dwell times are shorter at preferred codons for abundant tRNAs [41].
Translational selection might affect the codon usage patterns of HK genes, leading to more efficient protein production for cells. The translational accuracy hypothesis states that natural selection biases codon usage to enhance the accuracy of translation.
Drummond and Wilke [9] found that optimal codons in highly expressed genes have lower probabilities of mistranslation than nonoptimal codons in these genes do in numerous taxonomic groups. They proposed a model in which selection against tox- icity from protein misfolding is present. Translation errors can cause nonfunctional or toxic proteins, the aggregation of misfolded proteins, and the energy loss of cells.
Recent experiments have revealed a relationship between codon optimality and pro- tein folding. Buhr et al. [3] investigated in vivo translation of the recombinant bovine eye-lens protein gamma-B crystallin in E. coli and reported that optimized codons improve the stability and solubility of synthesized proteins. Their NMR spectro- scopic data suggested that the translation of optimized codons affects the conforma- tional states of proteins. By performing real-time monitoring in vitro translation sys- tem, they also found that optimized codons influence the cotranslational folding of proteins. HK genes might be particularly sensitive to mistranslation because mis- folded HK proteins result in the loss of functional molecules in the cells of several tissues. Translational selection that affects the codon usage patterns of HK genes might decrease the energy waste of useless mistranslation or the production of toxic mistranslation products and might provide correct protein products for maintaining cell functions.
Table 2
Spearman’s rank correlation analyses between factors and CUB in HK genes of D. melanogaster
Factor CBI ENC
ρ p value ρ p value
GC3 0.777 6.227×10–224 –0.774 5.187×10–221
Expression level 0.534 1.358×10–82 –0.468 3.621×10–61
Percentage of protein
interacting length 0.319 1.281×10⁻²⁷ –0.242 3.201×10⁻¹⁶
Protein connectivity 0.172 9.249×10⁻⁹ –0.193 9.541×10⁻¹¹
Spearman’s rank correlation coefficients (ρ) are shown and p values are considered statistically significant.
Proportion of protein interacting length and protein connectivity correlate with the CUB of HK genes
In addition to investigating the possible factors related to CUB at the genomic level, we further investigated CUB of HK genes in relation to the topological properties of HK proteins (proportion of protein interacting length and protein connectivity). We first compared each of these two factors between HK and HTS proteins. HK proteins had a higher percentage of protein interacting length (52.3%) than did HTS proteins (35.2%, p value = 6.238×10⁻³²). In addition, HK proteins had greater protein con-
Fig. 2. Scatter Diagrams show correlation between (A) CBI and percentage of protein interacting length (B) ENC and percentage of protein interacting length (C) CBI and protein connectivity (D) ENC and
protein connectivity in HK genes. The error bar shows 95% confidence interval of the mean
nectivity (5.905) than did HTS proteins (2.650, p value = 1.439×10–60). To clarify the relationships between CUB and these two factors, we performed correlation analyses. Table 2 and Fig. 2A–B show that CBI and ENC correlated with the per- centage of protein interacting length. What drives the relationship between CUB and percentage of protein interacting length? Zhou et al. [48] reported that in filamentous fungus Neurospora, genome-wide correlations between optimal codons and struc- tured protein domains exist, whereas nonoptimal codons correlate with unstructured protein regions. These correlations were confirmed by in vivo experiments of manip- ulating the codons for the disordered regions of the Neurospora circadian clock protein FREQUENCY (FRQ). Optimization of codons for the disordered regions of FRQ protein resulted in conformational changes in the FRQ protein. Furthermore, Fu et al. [16] found that nonoptimal codons correlate with intrinsically disordered regions of Drosophila circadian clock protein (dPER). The optimization of some codons for dPER resulted in changes of protein conformation, phosphorylation pro- file and stability. Based on previous empirical data and our data, we infer that the percentage of protein interacting length might contribute to synonymous codon usage in HK genes. HK proteins with higher percentages of protein interacting length might be translated by optimal codons that minimize protein misfolding by avoiding mistranslation. Thus, the probability of accurate protein conformation is higher in the case of HK proteins which ensure protein-protein interactions to main- tain cellular functions.
The observed correlations between CUB and protein connectivity are shown in Table 2 and Fig. 2C–D. The results indicate that CBI and ENC correlate with protein connectivity. In a previous study, Najafabadi and Salavati [26] suggested that simi- larity in codon usage is a strong predictor of protein-protein interactions. Dilucca et al. [8] investigated the connection between CUB at the genomic level and topologi- cal characteristics of protein–protein interactions in E. coli. They found that hub proteins (proteins with higher numbers of interaction partners) are characterized by higher codon bias of the corresponding genes. Our findings are consistent with the findings in a prokaryote and provide information on the correlation between protein connectivity and CUB in an animal system. What mechanism might explain the relationship between CUB and protein connectivity? It has been reported that pro- teins with more interaction partners have more constraints on evolutionary rates [15]. The mutation of HK hub proteins might affect protein–protein interaction net- works in cells. The biosynthesis of HK hub proteins might occur via optimal codons that decrease the probability of mistranslation and help to achieve accurate protein conformations for interactions. Mistranslated HK hub proteins may lead to protein misfolding and affect protein–protein interactions. By using preferred codons asso- ciated with abundant tRNAs, the biosynthesis of HK hub proteins may be more efficient. In contrast, the inefficient translation of HK hub proteins might reduce the efficiency of protein–protein interactions. The correlation between CUB and the connectivity of HK proteins might facilitate the maintenance of protein functional and physical interactions.
Rates of nonsynonymous substitution in HK genes are inversely related to CUB
As mentioned above, HK genes have higher CUB than do HTS genes and CUB in HK genes correlate with four factors (GC3 content, gene expression level, proportion of protein interacting length and protein connectivity). In the next set of analyses, we investigated the impact of CUB on the evolution of HK genes. The nonsynonymous substitution rate (dN) in HK and HTS genes was estimated by analyzing D. mela- nogaster – D. yakuba orthologs. The average dN of HK genes (mean dN = 0.021) was lower than that of HTS genes (mean dN = 0.095, p value = 2.780×10–195).
Differences in dN between HK genes and HTS genes might be mediated by some properties of genes that are correlated with the number of nucleotide substitutions.
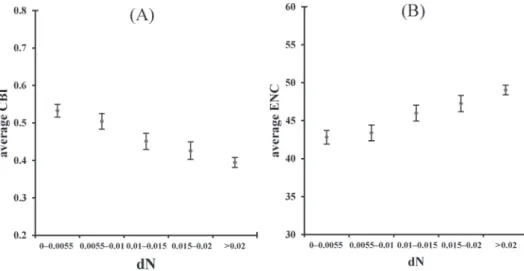
We then analyzed whether dN in HK genes was correlated with CUB. Figure 3A–B show that CBI (Spearman’s ρ = –0.41, p value = 3.973×10–46) and ENC (Spearman’s
Table 3
Spearman’s rank correlation analyses between facorts and nonsynonymous substitution rates (dN) in HK genes of D. melanogaster
Factor ρ p value
GC3 content –0.353 6.460×10⁻³⁴
Expression level –0.317 2.695×10⁻²⁷
Percentage of protein interacting length –0.247 9.261×10⁻³²
Protein connectivity –0.317 2.485×10⁻²⁷
Spearman’s rank correlation coefficients (ρ) are shown and p values are considered statistically significant.
Fig. 3. Scatter Diagrams show correlation between (A) CBI and dN (B) ENC and dN in HK genes. The error bar shows 95% confidence interval of the mean
ρ = 0.385, p value = 2.033×10–40) were correlated with dN in HK genes. The correla- tion between CUB and dN was also investigated in a previous study. Marais et al. [24]
analyzed 630 randomly selected D. melanogaster genes (including both high- and low-CUB genes) and found a negative correlation between dN and the frequency of optimal codons (Fop) in partial genes. A possible explanation for the correlation between CUB and dN is that nucleotide substitutions resulting in nonoptimal codons might decrease fitness. Previous studies reported that constraints among synonymous codons may slow dN in some genes [24, 30]. We found that four factors (GC3 content, gene expression level, proportion of protein interacting length and protein connectiv- ity) that correlate with CUB in HK genes also correlate to dN in HK genes (Table 3).
However, the exact cause of the correlation between CUB and dN in HK genes requires further investigation.
CONCLUSIONS
Based on the results herein, we conclude that differences in CUB exist between the HK genes and HTS genes of D. melanogaster. HK genes have higher CUB than do HTS genes, and CUB correlates with the evolution of HK genes. Mutational bias and natural selection significantly correlate with CUB in the HK genes of D. mela- nogaster. The proportion of protein interacting length and protein connectivity of HK proteins also correlate with the CUB in the HK genes. This study provides insight into CUB in HK genes of D. melanogaster, and a basis of further investigations for related molecular evolution, genetic engineering and practical applications in insect pest management strategies.
ACKNOWLEDGEMENT The authors wish to acknowledge the help of Dr. Chung Yen Lin.
REFERENCES
1. Bennetzen, J. L., Hall, B. D. (1982) Codon selection in yeast. J. Biol. Chem. 257, 3026–3031.
2. Boutet, E., Lieberherr, D., Tognolli, M., Schneider, M., Bansal, P., Bridge, A. J., Poux, S., Bougueleret, L., Xenarios, I. (2016) UniProtKB/Swiss-Prot, the Manually Annotated Section of the UniProt KnowledgeBase: How to Use the Entry View. Methods Mol. Biol. 1374, 23–54.
3. Buhr, F., Jha, S., Thommen, M., Mittelstaet, J., Kutz, F., Schwalbe, H., Rodnina, M. V., Komar, A. A.
(2016) Synonymous codons direct cotranslational folding toward different protein conformations.
Mol. Cell 61, 341–351.
4. Butte, A. J., Dzau, V. J., Glueck, S. B. (2001) Further defining housekeeping, or “maintenance,” genes Focus on “A compendium of gene expression in normal human tissues”. Physiol. Genomics. 7, 95–96.
5. Carlini, D. B., Stephan, W. (2003) In vivo introduction of unpreferred synonymous codons into the Drosophila Adh gene results in reduced levels of ADH protein. Genetics 163, 239–243.
6. Chaney, J. L., Clark, P. L. (2015) Roles for synonymous codon usage in protein biogenesis. Annu. Rev.
Biophys. 44, 143–166.
7. Crosby, M. A., Goodman, J. L., Strelets, V. B., Zhang, P., Gelbart, W. M. (2007) FlyBase: genomes by the dozen. Nucleic Acids Res. 35, D486–491.
8. Dilucca, M., Cimini, G., Semmoloni, A., Deiana, A., Giansanti, A. (2015) Codon bias patterns of E. coli’s interacting proteins. PLoS One 10, 11, e0142127.
9. Drummond, D. A., Wilke, C. O. (2008) Mistranslation-induced protein misfolding as a dominant constraint on coding-sequence evolution. Cell 134, 341–352.
10. Duret, L. (2000) tRNA gene number and codon usage in the C. elegans genome are co-adapted for optimal translation of highly expressed genes. Trends Genet. 16, 287–289.
11. Duret, L. (2002) Evolution of synonymous codon usage in metazoans. Curr. Opin. Genet. Dev. 12, 640–649.
12. Duret, L., Mouchiroud, D. (1999) Expression pattern and, surprisingly, gene length shape codon usage in Caenorhabditis, Drosophila, and Arabidopsis. Proc. Natl Acad. Sci. U S A. 96, 4482–4487.
13. Fath, S., Bauer, A. P., Liss, M., Spriestersbach, A., Maertens, B., Hahn, P., Ludwig, C., Schafer, F., Graf, M., Wagner, R. (2011) Multiparameter RNA and codon optimization: a standardized tool to assess and enhance autologous mammalian gene expression. PLoS One 6, 3 (Mar 03), e17596.
14. Finn, R. D., Coggill, P., Eberhardt, R. Y., Eddy, S. R., Mistry, J., Mitchell, A. L., Potter, S. C., Punta, M., Qureshi, M., Sangrador-Vegas, A., Salazar, G. A., Tate, J., Bateman, A. (2016) The Pfam protein families database: towards a more sustainable future. Nucleic Acids Res. 44, D279–285.
15. Fraser, H. B., Hirsh, A. E., Steinmetz, L. M., Scharfe, C., Feldman, M. W. (2002) Evolutionary rate in the protein interaction network. Science 296, 750–752.
16. Fu, J., Murphy, K. A., Zhou, M., Li, Y. H., Lam, V. H., Tabuloc, C. A., Chiu, J. C., Liu, Y. (2016) Codon usage affects the structure and function of the Drosophila circadian clock protein PERIOD.
Genes Dev. 30, 1761–1775.
17. Grantham, R., Gautier, C., Gouy, M., Mercier, R., Pave, A. (1980) Codon catalog usage and the genome hypothesis. Nucleic Acids Res. 8, r49–r62.
18. Gu, W., Zhou, T., Ma, J., Sun, X., Lu, Z. (2004) The relationship between synonymous codon usage and protein structure in Escherichia coli and Homo sapiens. Biosystems 73, 89–97.
19. Hubbell, E., Liu, W. M., Mei, R. (2002) Robust estimators for expression analysis. Bioinformatics 18, 1585–1592.
20. Kim, P. M., Sboner, A., Xia, Y., Gerstein, M. (2008) The role of disorder in interaction networks:
a structural analysis. Mol. Syst. Biol. 4, 179.
21. Knight, R. D., Freeland, S. J., Landweber, L. F. (2001) A simple model based on mutation and selec- tion explains trends in codon and amino-acid usage and GC composition within and across genomes.
Genome. Biol. 2, Research0010.
22. Kudla, G., Lipinski, L., Caffin, F., Helwak, A., Zylicz, M. (2006) High guanine and cytosine content increases mRNA levels in mammalian cells. PLoS Biol. 4, e180.
23. Librado, P., Rozas, J. (2009) DnaSP v5: a software for comprehensive analysis of DNA polymorphism data. Bioinformatics 25, 1451–1452.
24. Marais, G., Domazet-Loso, T., Tautz, D., Charlesworth, B. (2004) Correlated evolution of synony- mous and nonsynonymous sites in Drosophila. J. Mol. Evol. 59, 771–779.
25. Moriyama, E. N., Powell, J. R. (1998) Gene length and codon usage bias in Drosophila melanogaster, Saccharomyces cerevisiae and Escherichia coli. Nucleic Acids Res. 26, 3188–3193.
26. Najafabadi, H. S., Salavati, R. (2008) Sequence-based prediction of protein-protein interactions by means of codon usage. Genome. Biol. 9, R87.
27. Newman, Z. R., Young, J. M., Ingolia, N. T., Barton, G. M. (2016) Differences in codon bias and GC content contribute to the balanced expression of TLR7 and TLR9. Proc. Natl Acad. Sci. U S A. 113, E1362–1371.
28. Novoa, E. M., Pavon-Eternod, M., Pan, T., Ribas De Pouplana, L. (2012) A role for tRNA modifica- tions in genome structure and codon usage. Cell 149, 202–213.
29. Orchard, S., Ammari, M., Aranda, B., Breuza, L., Briganti, L., Broackes-Carter, F., Campbell, N. H., Chavali, G., Chen, C., Del-Toro, N., Duesbury, M., Dumousseau, M., Galeota, E., Hinz, U., Iannuccelli, M., Jagannathan, S., Jimenez, R., Khadake, J., Lagreid, A., Licata, L., Lovering, R. C.,
Meldal, B., Melidoni, A. N., Milagros, M., Peluso, D., Perfetto, L., Porras, P., Raghunath, A., Ricard- Blum, S., Roechert, B., Stutz, A., Tognolli, M., Van Roey, K., Cesareni, G., Hermjakob, H. (2014) The MIntAct project–IntAct as a common curation platform for 11 molecular interaction databases.
Nucleic Acids Res. 42, D358–363.
30. Pal, C., Papp, B., Hurst, L. D. (2001) Highly expressed genes in yeast evolve slowly. Genetics 158, 927–931.
31. Pechmann, S., Frydman, J. (2013) Evolutionary conservation of codon optimality reveals hidden signatures of cotranslational folding. Nat. Struct. Mol. Biol. 20, 237–243.
32. Plotkin, J. B., Kudla, G. (2011) Synonymous but not the same: the causes and consequences of codon bias. Nat. Rev. Genet. 12, 32–42.
33. Podder, S., Mukhopadhyay, P., Ghosh, T. C. (2009) Multifunctionality dominantly determines the rate of human housekeeping and tissue specific interacting protein evolution. Gene 439, 11–16.
34. Robinson, S. W., Herzyk, P., Dow, J. A., Leader, D. P. (2013) FlyAtlas: database of gene expression in the tissues of Drosophila melanogaster. Nucleic Acids Res. 41, D744–750.
35. Sharp, P. M., Cowe, E., Higgins, D. G., Shields, D. C., Wolfe, K. H., Wright, F. (1988) Codon usage patterns in Escherichia coli, Bacillus subtilis, Saccharomyces cerevisiae, Schizosaccharomyces pombe, Drosophila melanogaster and Homo sapiens; a review of the considerable within-species diversity. Nucleic Acids Res. 16, 8207–8211.
36. Sharp, P. M., Li, W. H. (1986) An evolutionary perspective on synonymous codon usage in unicel- lular organisms. J. Mol. Evol. 24, 28–38.
37. Stoletzki, N., Eyre-Walker, A. (2007) Synonymous codon usage in Escherichia coli: selection for translational accuracy. Mol. Biol. Evol. 24, 374–381.
38. Tamura, K., Subramanian, S., Kumar, S. (2004) Temporal patterns of fruit fly (Drosophila) evolution revealed by mutation clocks. Mol. Biol. Evol. 21, 36–44.
39. Vicario, S., Moriyama, E. N., Powell, J. R. (2007) Codon usage in twelve species of Drosophila. BMC Evol. Biol. 7, 226.
40. Waterhouse, R. M., Tegenfeldt, F., Li, J., Zdobnov, E. M., Kriventseva, E. V. (2013) OrthoDB: a hierarchical catalog of animal, fungal and bacterial orthologs. Nucleic Acids Res. 41, D358–365.
41. Weinberg, D. E., Shah, P., Eichhorn, S. W., Hussmann, J. A., Plotkin, J. B., Bartel, D. P. (2016) Improved ribosome-footprint and mRNA measurements provide insights into dynamics and regula- tion of yeast translation. Cell Rep. 14, 1787–1799.
42. Wright, F. (1990) The ‘effective number of codons’ used in a gene. Gene 87, 23–29.
43. Yan, X., Hoek, T. A., Vale, R. D., Tanenbaum, M. E. (2016) Dynamics of translation of single mRNA molecules in vivo. Cell 165, 4 (May 05), 976–989.
44. Yanai, I., Benjamin, H., Shmoish, M., Chalifa-Caspi, V., Shklar, M., Ophir, R., Bar-Even, A., Horn- Saban, S., Safran, M., Domany, E., Lancet, D., Shmueli, O. (2005) Genome-wide midrange transcrip- tion profiles reveal expression level relationships in human tissue specification. Bioinformatics 21, 650–659.
45. Yang, Z. (1997) PAML: a program package for phylogenetic analysis by maximum likelihood.
Comput. Appl. Biosci. 13, 555–556.
46. Yang, Z., Nielsen, R. (2000) Estimating synonymous and nonsynonymous substitution rates under realistic evolutionary models. Mol. Biol. Evol. 17, 32–43.
47. Zamft, B., Bintu, L., Ishibashi, T., Bustamante, C. (2012) Nascent RNA structure modulates the tran- scriptional dynamics of RNA polymerases. Proc. Natl Acad. Sci. U S A. 109, 8948–8953.
48. Zhou, M., Guo, J., Cha, J., Chae, M., Chen, S., Barral, J. M., Sachs, M. S., Liu, Y. (2013) Non-optimal codon usage affects expression, structure and function of clock protein FRQ. Nature 495, 111–115.
49. Zhou, T., Gu, W., Ma, J., Sun, X., Lu, Z. (2005) Analysis of synonymous codon usage in H5N1 virus and other influenza A viruses. Biosystems 81, 77–86.
50. Zhou, T., Weems, M., Wilke, C. O. (2009) Translationally optimal codons associate with structurally sensitive sites in proteins. Mol. Biol. Evol. 26, 1571–1580.