O R I G I N A L I N V E S T I G A T I O N Open Access
The effect of a preparation of minerals,
vitamins and trace elements on the cardiac gene expression pattern in male diabetic rats
Márta Sárközy1†, GergőSzűcs1†, Márton Pipicz1, Ágnes Zvara2, Katalin Éder3, Veronika Fekete1, Csilla Szűcs4, Judit Bárkányi4, Csaba Csonka1, László G. Puskás2, Csaba Kónya4, Péter Ferdinandy5,6†and Tamás Csont1*†
Abstract
Background:Diabetic patients have an increased risk of developing cardiovascular diseases, which are the leading cause of death in developed countries. Although multivitamin products are widely used as dietary supplements, the effects of these products have not been investigated in the diabetic heart yet. Therefore, here we investigated if a preparation of different minerals, vitamins, and trace elements (MVT) affects the cardiac gene expression pattern in experimental diabetes.
Methods:Two-day old male Wistar rats were injected with streptozotocin (i.p. 100 mg/kg) or citrate buffer to induce diabetes. From weeks 4 to 12, rats were fed with a vehicle or a MVT preparation. Fasting blood glucose measurement and oral glucose tolerance test were performed at week 12, and then total RNA was isolated from the myocardium and assayed by rat oligonucleotide microarray for 41012 oligonucleotides.
Results:Significantly elevated fasting blood glucose concentration and impaired glucose tolerance were markedly improved by MVT-treatment in diabetic rats at week 12. Genes with significantly altered expression due to diabetes include functional clusters related to cardiac hypertrophy (e.g.caspase recruitment domain family, member 9; cytochrome P450, family 26, subfamily B, polypeptide; FXYD domain containing ion transport regulator 3), stress response (e.g.
metallothionein 1a; metallothionein 2a; interleukin-6 receptor; heme oxygenase (decycling) 1; and glutathione S-transferase, theta 3),and hormones associated with insulin resistance (e.g.resistin; FK506 binding protein 5; galanin/GMAP
prepropeptide). Moreover the expression of some other genes with no definite cardiac function was also changed such as e.g.similar to apolipoprotein L2;brain expressed X-linked 1; prostaglandin b2 synthase (brain).MVT-treatment in diabetic rats showed opposite gene expression changes in the cases of 19 genes associated with diabetic cardiomyopathy. In healthy hearts, MVT-treatment resulted in cardiac gene expression changes mostly related to immune response (e.g.complement factor B;complement component 4a; interferon regulatory factor 7; hepcidin).
Conclusions:MVT-treatment improved diagnostic markers of diabetes. This is the first demonstration that MVT- treatment significantly alters cardiac gene expression profile in both control and diabetic rats. Our results and further studies exploring the mechanistic role of individual genes may contribute to the prevention or diagnosis of cardiac complications in diabetes.
Keywords:Diabetes mellitus, Haemoglobin A1c, Insulin resistance, Multivitamin, Heart, DNA microarray, Cardiac hypertrophy, Fibrosis, Oxidative/nitrative stress
* Correspondence:csont.tamas@med.u-szeged.hu
†Equal contributors
1Department of Biochemistry, Faculty of Medicine, University of Szeged, Szeged, Hungary
Full list of author information is available at the end of the article
CARDIO VASCULAR DIABETOLOGY
© 2015 Sárközy et al. This is an Open Access article distributed under the terms of the Creative Commons Attribution License (http://creativecommons.org/licenses/by/4.0), which permits unrestricted use, distribution, and reproduction in any medium, provided the original work is properly credited. The Creative Commons Public Domain Dedication waiver (http://
creativecommons.org/publicdomain/zero/1.0/) applies to the data made available in this article, unless otherwise stated.
Sárközyet al. Cardiovascular Diabetology (2015) 14:85 DOI 10.1186/s12933-015-0248-6
Background
In 2014, the global prevalence of diabetes mellitus (DM) was estimated to be 9 % among adults aged over 18 years [1] reaching epidemic rates in the 21st century [2]. The number of patients diagnosed with DM is continuously increasing due to the increasing prevalence of hyperlip- idaemia, visceral obesity and physical inactivity world- wide [2–4]. The total number of people suffering from DM is projected to rise to 552 million in 2030 [5].
Regular consumption of complex preparations con- taining various vitamins, minerals, and trace elements (MVT) is common in developed countries [6] to main- tain general health. In the USA, for instance, more than half of the adult population use dietary supplements [7, 8], primarily in the form of multivitamins with or without minerals [9, 10]. In 1998 a study reported that in Germany 18 % of men and 25 % of women were regu- lar consumers of multivitamins among 18–79 years old adults [11]. Moreover, MVT preparations appeared on the market as medical food for patients suffering from metabolic diseases including hyperlipidaemia, metabolic syndrome, and DM. However, the literature is limited and controversial on the potential beneficial effects of these complex preparations containing more than 3 components on disease progression [12–16]. We have recently shown that chronic treatment with a MVT prep- aration improved well-established diagnostic markers of DM such as fasting blood glucose, HbA1c, glucose toler- ance, and serum insulin levels in male diabetic rats [14].
It is well known that diabetic patients have an in- creased risk of developing cardiovascular diseases in- cluding diabetic cardiomyopathy [17]. Cardiovascular complications are estimated to be responsible for more than 50 % of deaths among this population [18]. To ex- plain the development of cardiovascular complications, the effect of DM on the cardiac gene expression pattern was investigated in a few studies [19–22]. In addition, we have previously shown that metabolic syndrome, which is a precursor state of type 2 DM, alters cardiac gene expression pattern in male ZDF rats [23]. However, the effect of MVT preparations on the cardiac gene ex- pression pattern either in healthy or in diabetic condi- tion has not yet been investigated.
Therefore, here we aimed at investigating the effects of a MVT preparation containing 26 different minerals, vi- tamins and vitamin-like antioxidants, as well as trace el- ements on the cardiac gene expression pattern in male diabetic rats.
Materials and methods Animals
This investigation conforms to the National Institutes of Health Guide for the Care and Use of Laboratory Ani- mals (NIH Pub. No. 85–23, Revised 1996) and was
approved by the Animal Research Ethics Committee of the University of Szeged.
Two-day old neonatal male Wistar rats were used in this study. Lactating females with their litters were sep- arately housed in individually ventilated cages (Sealsafe IVC system, Italy) and were maintained in a temperature- controlled room using 12:12 h light:dark cycles for 4 weeks. After separation from the mother at week 4, males were fed with standard rat chow (Additional file 1) and housed in pairs under the same circumstances as mentioned above until 12 weeks of age.
The injection of neonatal rats with streptozotocin (STZ) is a well characterized and recognized model of diabetes mellitus [24–27]. This model has been particu- larly characterized in detail in our previous study [14].
STZ is toxic especially to pancreatic β-cells. In contrast to injection of STZ to adult rats in a lower dose (60 mg/kg) that leads to type 1 diabetes with severe hyperglycemia [14, 24–27], administration of STZ to neonatal rats in a higher dose (90–100 mg/kg) leads to acute hyperglycemia within the first few days without resulting in complete loss of insulin production [14, 24–27]. According to lit- erature data, after 5–6 weeks, the surviving rats develop characteristic symptoms of type 2 diabetes mellitus in- cluding dyslipidemia, hyperglycemia, impaired glucose tolerance and insulin resistance due to decreased β-cell mass [14, 24–27]. After 10–12 weeks, cardiovascular complications including hypertension and LV hyper- trophy with decreased cardiac function are present in neonatal STZ-treated rats [28–34]. Therefore, this model is an appropriate choice to perform anti-diabetic drug screening studies.
Experimental protocol
Two days old neonatal male Wistar rats were intraperi- toneally injected with 100 mg/kg of STZ (n= 25) or its vehicle (ice-cold citrate buffer,n= 16) to induce experi- mental DM as described earlier [14].
At week 4, fasting blood glucose (FBG) measurement followed by an oral glucose tolerance test (OGTT) were performed in order to verify the development of im- paired glucose tolerance in DM in surviving animals (data not shown). Mortality rates were 0 % and 36 % in citrate buffer-treated and in the STZ-treated group, re- spectively. Both citrate buffer-treated (n= 16) and STZ- treated rats (n= 16) were then supplemented per os via gavage (1 mL/kg, 1 % methylcellulose suspension) with a MVT preparation (253.3 mg/kg/day, suspended in meth- ylcellulose, n= 8-8) or its vehicle (157 mg/kg/day, sus- pended in methylcellulose, n= 8-8) for 8 weeks as described previously [14]. The MVT preparation admin- istered in the present study is a registered medical food for human use (Diacomplex film-coated tablet, Béres Pharmaceuticals, Budapest, Hungary; for content see
Sárközyet al. Cardiovascular Diabetology (2015) 14:85 Page 2 of 20
Table 1). To conform to the human daily dose of the preparation, the daily rat dose was adjusted according to the ratio of human and rat body surface areas as de- scribed previously [14]. Body weight was monitored every week. FBG, haemoglobin A1c level measurement and OGTT were performed at week 12 to assess the ef- fect of MVT-treatment on DM. Serum insulin measure- ments were performed at week 4, 8 and 12 in order to monitor the insulin secretion of pancreatic beta cells and the effect of MVT-treatment on the severity of pan- creatic beta cell damage due to STZ-treatment. At week 12, the rats were anaesthetized using pentobarbital (Euthasol, i.p. 50 mg/kg; Produlab Pharma b.v., Raams- donksveer, The Netherlands) [35]. Hearts and pancreata were isolated, and then the hearts were perfused accord- ing to Langendorff as described earlier [36, 37]. Coron- ary flow was measured during the ex vivo perfusion protocol [35]. After 10 min perfusion, ventricular tissue was frozen and stored at−80 °C until DNA microarray
investigation and gene expression analysis could be per- formed. Pancreata were removed, trimmed free of adi- pose tissue, then frozen and stored for pancreatic insulin content determination as described previously [23].
FBG measurements and OGTT
Rats were fasted overnight (12 h) prior to blood glucose level measurement and OGTT (week 12) in order to ver- ify the development of DM and to monitor the effect of MVT-treatment on the progression of DM as described previously [14]. Briefly, blood samples were collected from the saphenous vein and blood glucose levels were measured using Accucheck blood glucose monitoring systems (Roche Diagnostics Corporation, USA, Indian- apolis) [14, 23]. After measurement of baseline glucose concentrations, glucose at 1.5 g/kg body weight was ad- ministered via oral gavage and plasma glucose levels were measured 30, 60 and 120 minutes later during OGTT [14, 23].
Table 1Ingredients of the MVT preparation
Active ingredients Amount of ingredient/1 g product Daily dosea
Vitamin A1(Retinol) 329μg/g (109700 IU/g) 83.3μg/kg/day (278 IU/kg/day)
Vitamin B1(Thiamin) 2.30 mg/g 0.58 mg/kg/day
Vitamin B2(Riboflavin) 2.63 mg/g 0.67 mg/kg/day
Vitamin B3(Nicotinamide) 11.8 mg/g 2.99 mg/kg/day
Vitamin B5(Pantothenic acid) 3.95 mg/g 1.00 mg/kg/day
Vitamin B6(Pyridoxine) 3.29 mg/g 0.83 mg/kg/day
Vitamin B12(Cyanocobalamin) 3μg/g 0.76μg/kg/day
Folic acid 197μg/g 49.9μg/kg/day
Biotin 99μg/g 25.1μg/kg/day
Vitamin D3(Cholecalciferol) 3μg/g (120 IU/g) 0.76μg/kg/day (30.4 IU/kg/day)
Vitamin K1(Phyllokinone) 26μg/g 6.59μg/kg/day
Rutoside 3.29 mg/g 0.83 mg/kg/day
Vitamin C 65.8 mg/g 16.7 mg/kg/day
Vitamin E 32.9 mg/g 8.33 mg/kg/day
Lutein 1.97 mg/g 0.50 mg/kg/day
Chrome 39μg/g 9.88μg/kg/day
Zinc 9.87 mg/g 2.50 mg/kg/day
Selenium 26μg/g 6.59μg/kg/day
Iron 2.63 mg/g 0.67 mg/kg/day
Iodine 66μg/g 16.7μg/kg/day
Manganese 0.66 mg/g 0.17 mg/kg/day
Copper 921μg/g 233μg/kg/day
Molybdenum 49μg/g 12.4μg/kg/day
Magnesium 65.8 mg/g 16.7 mg/kg/day
Calcium 132 mg/g 33.4 mg/kg/day
Phosphorus 102 mg/g 25.8 mg/kg/day
aTo conform to the human daily dose of the preparation, rat daily dose was adjusted according to the ratio of human and rat body surface areas
Sárközyet al. Cardiovascular Diabetology (2015) 14:85 Page 3 of 20
Haemoglobin A1c measurement
To monitor the effect of the MVT containing prepar- ation on the severity of DM, haemoglobin A1c was mea- sured from whole venous blood with an in vitro test (Bio-Rad in2it System) according to the instructions of the manufacturer [14]. The test is based on single wave length photometry (440 nm) to detect glycated fraction separated from the non-glycated fraction by boronate af- finity chromatography [14].
Measurement of serum and pancreatic insulin levels To monitor the effect of MVT-treatment on the sever- ity of DM, serum and pancreatic insulin levels were measured by an enzyme immunoassay (Mercodia, Ul- trasensitive Rat Insulin ELISA) in duplicates according to the manufacturer’s instructions as described previ- ously [14, 23].
RNA preparation and DNA microarray analysis
Total RNA was isolated from heart samples with Qiagen miRNeasy Mini Kit according to the manufacturer’s protocol (Qiagen, Hilden, Germany). On-column DNase digestion was carried out with the RNase-Free DNase Set (Qiagen GmbH). RNA concentration was measured by NanoDrop 1000 Spectrophotometer (Thermo Fisher Scientific Inc., Waltham, MA, USA) and RNA integrity was determined by an Agilent 2100 Bioanalyzer System (Agilent Technologies Inc., Santa Clara, CA, USA). Sam- ples with an RNA integrity number (RIN) above 8.0 were used for further analysis. RNA was stored at −80 °C until use.
Total RNA (200 ng) was labelled and amplified using the Low Input Quick Amp Labelling Kit according to the instructions of the manufacturer. Labelled RNA was purified and hybridized to Agilent Whole Rat Genome 4x44K array slides, according to the manufacturer’s protocol. After washing, array scanning and feature ex- traction was performed with default scenario by Agilent DNA Microarray Scanner and Feature Extraction Soft- ware 11.01.
Messenger RNA (mRNA) expression profiling by qRT-PCR In order to validate gene expression changes obtained by DNA microarray, qRT-PCR was performed on a Rotor- Gene 3000 instrument (Corbett Research, Sydney, Australia) with gene-specific primers and SybrGreen protocol to monitor gene expression as described earlier [23]. Briefly, 2 μg of total RNA was reverse transcribed using the High-Capacity cDNA Archive Kit (Applied Biosystems Foster City, CA, USA) according to the man- ufacturer’s instructions in a final volume of 30 μL. After dilution with 30μL of water, 1μL of the diluted reaction mix was used as a template in the qRT-PCR with Fas- tStart SYBR Green Master mix (Roche Applied Science,
Mannheim, Germany) with the following protocol:
10 min at 95 °C followed by 45 cycles of 95 °C for 15 sec, 60 °C for 25 sec and 72 °C for 25 sec. The fluor- escence intensity of SybrGreen dye was detected after each amplification step. Melting temperature analysis was done after each reaction to check the quality of the products. Primers were designed using the online Roche Universal Probe Library Assay Design Center. The qual- ity of the primers was verified by MS analysis provided by Bioneer (Daejeon, Korea). Relative expression ratios were calculated as normalized ratios to rat HPRT and Cyclophyllin genes. A non-template control sample was used for each primer to check primer-dimer formation.
The final relative gene expression ratios were calculated as delta-delta Ct values. Fold change refers to 2-ΔΔCt(in the case of up-regulated genes) and –(1/2-ΔΔCt) (in the case of down-regulated genes).
Statistical analysis
Statistical analysis was performed by using Sigmaplot 12.0 for Windows (Systat Software Inc). All values are presented as mean ± SEM. Two-Way ANOVA was used to determine the effect of DM or MVT on body weight, FBG, glucose levels during OGTT, OGTT AUC, HbA1c, serum and pancreatic insulin concentrations, pancreas weight and coronary flow. After ANOVA, all pairwise multiple comparison procedures with Holm-Šídák post hoctests were used as multiple range tests. P< 0.05 was accepted as a statistically significant difference.
In the microarray experiments, biological and tech- nical replica tests were carried out to gain raw data for statistical analysis. Altogether 9 individual parallel gene activity comparisons were done between two groups.
Both in the microarray and qRT-PCR experiments, a two-sample t-test was used and the p value was deter- mined to find significant gene expression changes in 3 separate comparisons. In the microarray experiments, a corrected p value was determined for each gene to control the false discovery rate using theBenjamini and Hochberg multiple testing correction protocol. Gene expression ra- tios with p value of <0.05 and log2ratio of <−0.85 or log2
ratio of >0.85 (~1.8 fold change) were considered as re- pression or overexpression respectively in gene activity.
Results
Characterization of experimental DM and the effects of MVT-treatment on the progression of DM
The time dependence of development of DM in neonatal STZ-treated rats in both genders has been particularly characterized in detail in our previous study [14]. In the present study, concentrations of several plasma metabo- lites and body weight were measured in order to verify the development of DM in the STZ-treated rats (Fig. 1).
OGTT showed increased glucose levels at every time
Sárközyet al. Cardiovascular Diabetology (2015) 14:85 Page 4 of 20
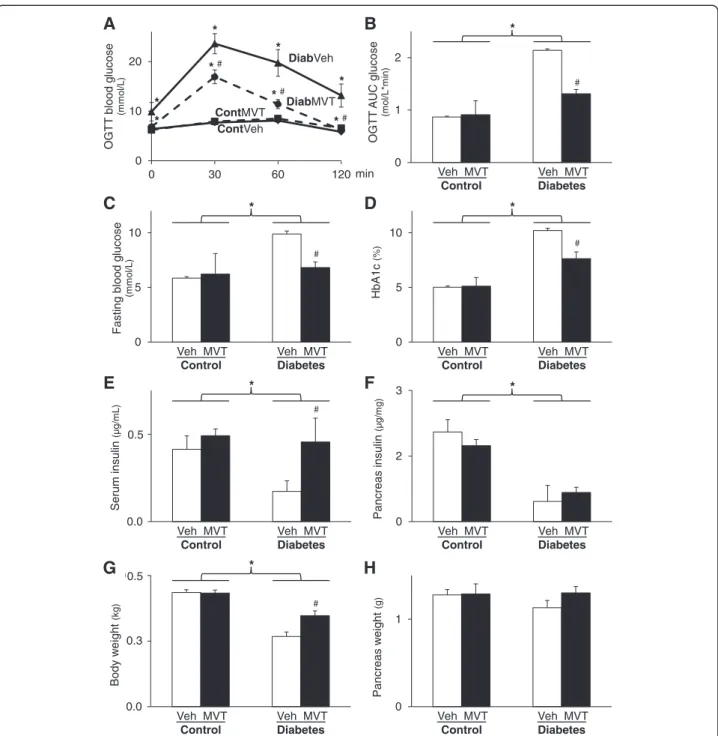
point following oral glucose load accompanied with in- creased area under the curve (AUC) values in STZ- treated groups showing impaired glucose tolerance (Fig. 1a and b). MVT-treatment significantly decreased glucose and OGTT AUC values in the STZ-treated groups, proving an anti-diabetic effect of the MVT prep- aration (Fig. 1a and b). FBG level was significantly higher in STZ-treated groups as compared to the control group
showing the development of DM (Fig. 1c). However, FBG level was significantly decreased by MVT-treatment in the STZ-treated diabetic group (Fig. 1c). HbA1c level was significantly increased in STZ-treated groups as compared to controls (Fig. 1d) demonstrating chronic hyperglycaemia and the development of DM. Interest- ingly, MVT-treatment significantly reduced the HbA1c level in the STZ-treated diabetic group (Fig. 1d). Serum
0 1 2
Control Diabetes OGTT AUC glucose (mol/L*min)
B
Veh MVT Veh MVT
*
#
0 5 10
Control Diabetes Fastingbloodglucose (mmol/L)
C
Veh MVT Veh MVT 0
5 10
Control Diabetes
HbA1c (%)
D
Veh MVT Veh MVT
*
#
*
#
0 2 3
Control Diabetes
Pancreasinsulin(µg/mg)
F
Veh MVT Veh MVT
*
*
A
0 10 20
0 30 60 120
OGTT bloodglucose (mmol/L)
*
*
*
*
*
#
*#
*#
min DiabVeh
DiabMVT ContVeh
ContMVT
0 1
Control Diabetes
Pancreasweight(g)
H
Veh MVT Veh MVT 0.0
0.5
Control Diabetes
Seruminsulin(µg/mL)
E
Veh MVT Veh MVT
#
*
0.5
0.0 0.5
0.0
0.0 0.3 0.5
Control Diabetes
Body weight(kg)
G
Veh MVT Veh MVT
#
* 0.5
0.3
0.0
Fig. 1Characterization of experimental DM and the effects of MVT-treatment on the progression of DM.aBlood glucose levels during oral glucose tolerance test (OGTT) andbits area under the curve (AUC).cLevel of fasting blood glucose anddhaemoglobin A1c.eSerum andfpancreas insulin.gBody andhpancreas weight. Values are expressed as mean ± S.E.M.*p< 0.05 vs. control, #p< 0.05 vs. diabetes vehicle, two-way ANOVA, n = 8 in each group. Cont = Control, Diab = Diabetes, Veh = Vehicle, MVT = preparation of minerals, vitamins, and trace elements
Sárközyet al. Cardiovascular Diabetology (2015) 14:85 Page 5 of 20
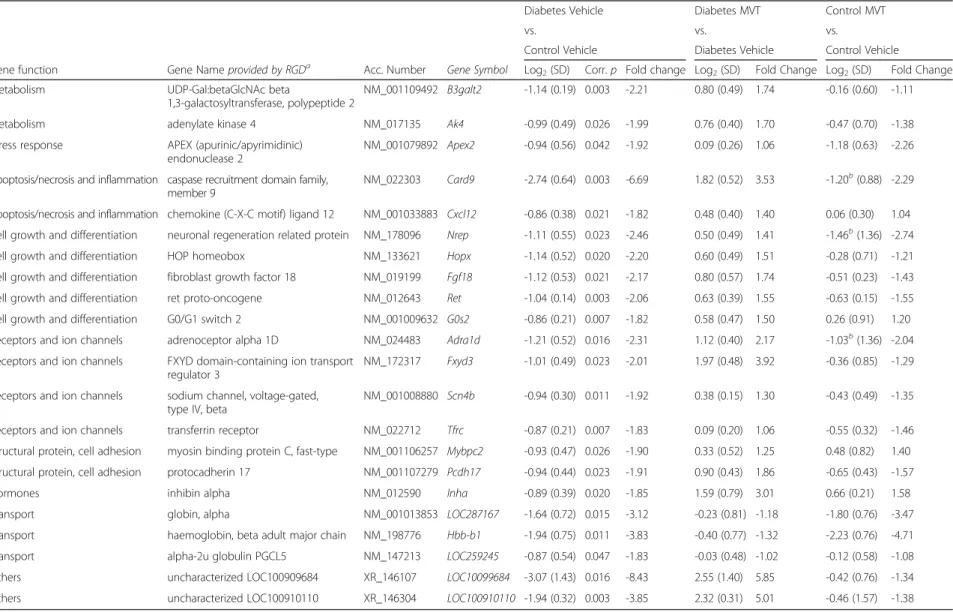
Table 2Genes significantly down-regulated in diabetes vehicle-treated vs. control vehicle-treated group on DNA microarray
Diabetes Vehicle Diabetes MVT Control MVT
vs. vs. vs.
Control Vehicle Diabetes Vehicle Control Vehicle
Gene function Gene Nameprovided by RGDa Acc. Number Gene Symbol Log2(SD) Corr.p Fold change Log2(SD) Fold Change Log2(SD) Fold Change
Metabolism UDP-Gal:betaGlcNAc beta
1,3-galactosyltransferase, polypeptide 2
NM_001109492 B3galt2 -1.14 (0.19) 0.003 -2.21 0.80 (0.49) 1.74 -0.16 (0.60) -1.11
Metabolism adenylate kinase 4 NM_017135 Ak4 -0.99 (0.49) 0.026 -1.99 0.76 (0.40) 1.70 -0.47 (0.70) -1.38
Stress response APEX (apurinic/apyrimidinic) endonuclease 2
NM_001079892 Apex2 -0.94 (0.56) 0.042 -1.92 0.09 (0.26) 1.06 -1.18 (0.63) -2.26
Apoptosis/necrosis and inflammation caspase recruitment domain family, member 9
NM_022303 Card9 -2.74 (0.64) 0.003 -6.69 1.82 (0.52) 3.53 -1.20b(0.88) -2.29
Apoptosis/necrosis and inflammation chemokine (C-X-C motif) ligand 12 NM_001033883 Cxcl12 -0.86 (0.38) 0.021 -1.82 0.48 (0.40) 1.40 0.06 (0.30) 1.04 Cell growth and differentiation neuronal regeneration related protein NM_178096 Nrep -1.11 (0.55) 0.023 -2.46 0.50 (0.49) 1.41 -1.46b(1.36) -2.74
Cell growth and differentiation HOP homeobox NM_133621 Hopx -1.14 (0.52) 0.020 -2.20 0.60 (0.49) 1.51 -0.28 (0.71) -1.21
Cell growth and differentiation fibroblast growth factor 18 NM_019199 Fgf18 -1.12 (0.53) 0.021 -2.17 0.80 (0.57) 1.74 -0.51 (0.23) -1.43 Cell growth and differentiation ret proto-oncogene NM_012643 Ret -1.04 (0.14) 0.003 -2.06 0.63 (0.39) 1.55 -0.63 (0.15) -1.55 Cell growth and differentiation G0/G1 switch 2 NM_001009632 G0s2 -0.86 (0.21) 0.007 -1.82 0.58 (0.47) 1.50 0.26 (0.91) 1.20 Receptors and ion channels adrenoceptor alpha 1D NM_024483 Adra1d -1.21 (0.52) 0.016 -2.31 1.12 (0.40) 2.17 -1.03b(1.36) -2.04 Receptors and ion channels FXYD domain-containing ion transport
regulator 3
NM_172317 Fxyd3 -1.01 (0.49) 0.023 -2.01 1.97 (0.48) 3.92 -0.36 (0.85) -1.29
Receptors and ion channels sodium channel, voltage-gated, type IV, beta
NM_001008880 Scn4b -0.94 (0.30) 0.011 -1.92 0.38 (0.15) 1.30 -0.43 (0.49) -1.35
Receptors and ion channels transferrin receptor NM_022712 Tfrc -0.87 (0.21) 0.007 -1.83 0.09 (0.20) 1.06 -0.55 (0.32) -1.46 Structural protein, cell adhesion myosin binding protein C, fast-type NM_001106257 Mybpc2 -0.93 (0.47) 0.026 -1.90 0.33 (0.52) 1.25 0.48 (0.82) 1.40 Structural protein, cell adhesion protocadherin 17 NM_001107279 Pcdh17 -0.94 (0.44) 0.023 -1.91 0.90 (0.43) 1.86 -0.65 (0.43) -1.57
Hormones inhibin alpha NM_012590 Inha -0.89 (0.39) 0.020 -1.85 1.59 (0.79) 3.01 0.66 (0.21) 1.58
Transport globin, alpha NM_001013853 LOC287167 -1.64 (0.72) 0.015 -3.12 -0.23 (0.81) -1.18 -1.80 (0.76) -3.47
Transport haemoglobin, beta adult major chain NM_198776 Hbb-b1 -1.94 (0.75) 0.011 -3.83 -0.40 (0.77) -1.32 -2.23 (0.76) -4.71
Transport alpha-2u globulin PGCL5 NM_147213 LOC259245 -0.87 (0.54) 0.047 -1.83 -0.03 (0.48) -1.02 -0.12 (0.58) -1.08
Others uncharacterized LOC100909684 XR_146107 LOC10099684 -3.07 (1.43) 0.016 -8.43 2.55 (1.40) 5.85 -0.42 (0.76) -1.34
Others uncharacterized LOC100910110 XR_146304 LOC100910110 -1.94 (0.32) 0.003 -3.85 2.32 (0.31) 5.01 -0.46 (1.57) -1.38
Values show gene expression. Log2ratio reaching at least ±0.85 andp< 0.05 were considered as significant alterations
aRGD: rat genome database
bnon significant change (p> 0.05)
Sárközyetal.CardiovascularDiabetology (2015) 14:85 Page6of20
insulin levels were significantly decreased in the STZ- injected vehicle-treated group as compared to control vehicle-treated group both at week 4 (0.05 ± 0.01 vs.
0.16 ± 0.02 μg/mL) and 8 (0.08 ± 0.02 vs. 0.17 ± 0.02μg/
mL) proving deteriorated pancreatic beta cell function in DM. MVT-treatment had no significant effect on serum insulin levels at weeks 4 and 8 in diabetic (0.06 ± 0.01 and 0.12 ± 0.03μg/mL, respectively) and control animals (0.12 ± 0.02 and 0.25 ± 0.03 μg/mL) when compared to appropriate vehicle-treated controls. At week 12, serum and pancreatic insulin concentration were significantly decreased in STZ-treated diabetic animals, proving pan- creatic β-cell damage (Fig. 1e and f ). MVT-treatment showed a significant increase in serum insulin concen- trations in STZ-treated animals (Fig. 1e). However, MVT-treatment failed to significantly improve pancre- atic insulin content in STZ-treated diabetic animals (Fig. 1f ). In addition, body weight gain of STZ-treated rats was significantly lower as compared to control rats. However, weight gain was significantly improved by the MVT-treatment in the STZ-treated group (Fig. 1g). Neither DM nor MVT-treatment had a sig- nificant effect on pancreas weight (Fig. 1h). Coronary flow was significantly lower in the diabetic vehicle- treated group as compared to the control vehicle- treated group (16.4 ± 2.04 vs. 19.25 ± 0.48 mL/min) showing impaired cardiac function in diabetic hearts.
However, MVT-treatment failed to improve coronary flow in the diabetic group (17.0 ± 0.52 mL/min) and had no significant effect in the control group either (19.29 ± 0.94 mL/min).
Global cardiac gene expression changes
To determine genes in 1) diabetic vehicle-treated, 2) dia- betic MVT-treated, 3) control vehicle-treated and 4) con- trol MVT-treated groups, total RNA isolation and then DNA microarray analysis were performed from the hearts of all groups. Among the 41012 rat oligonucleotides sur- veyed, 16752 oligonucleotides in diabetic vehicle-treated group, 17531 oligonucleotides in diabetic MVT-treated group, 17447 oligonucleotides in control vehicle- treated group and 17184 oligonucleotides in control MVT-treated group showed expression.
Identification of genes associated with DM
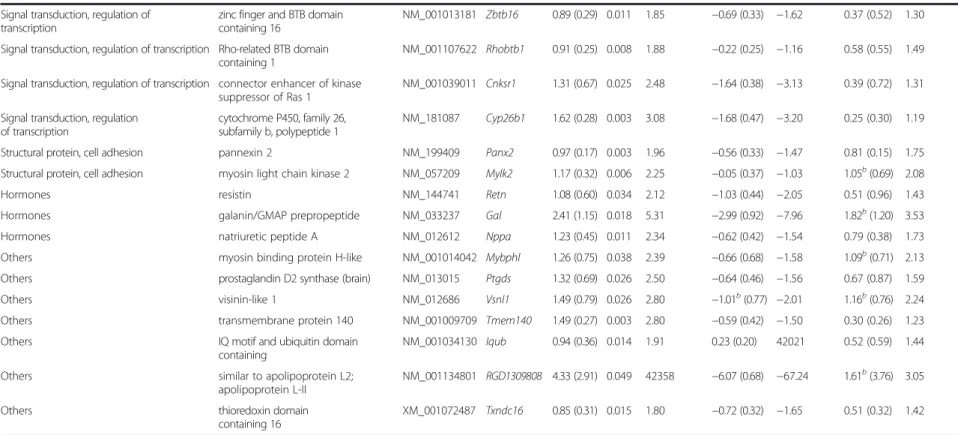
To determine genes associated with DM and diabetic cardiomyopathy, cardiac gene expression induced in the diabetic vehicle-treated group was compared with the control vehicle-treated group (Tables 2 and 3). In dia- betic vehicle-treated hearts, 37 genes showed significant up-regulation and 22 genes showed significant down- regulation (Tables 2 and 3).
Identification of genes associated with MVT-treatment in DM
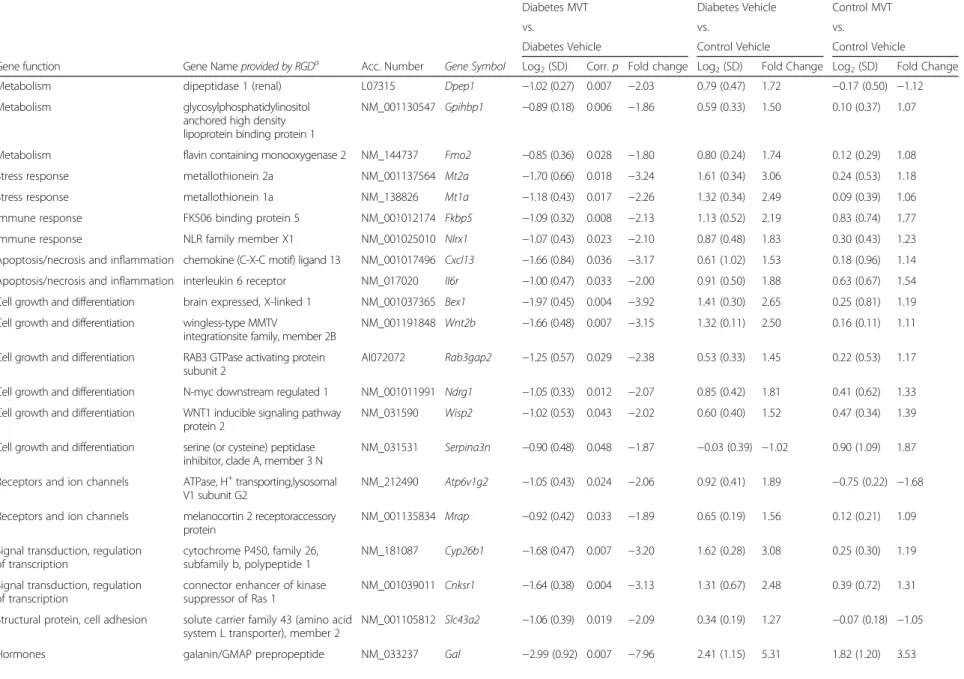
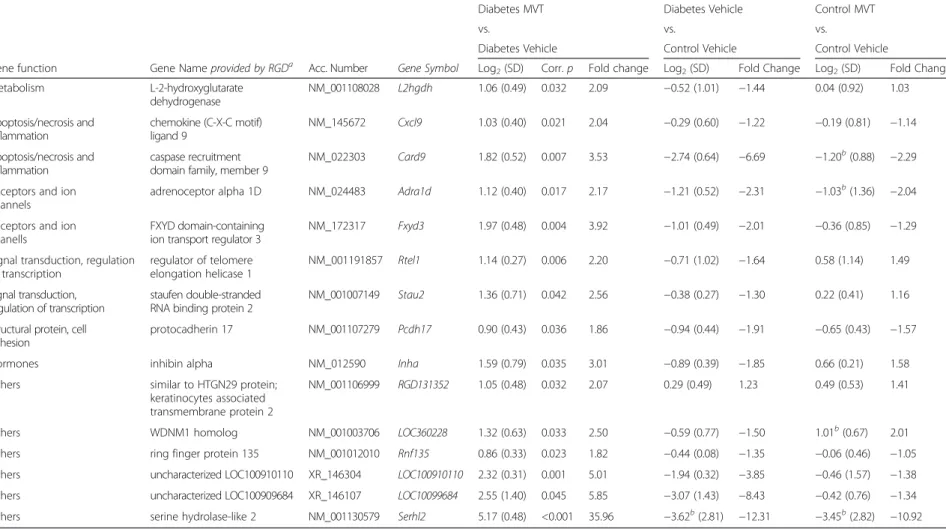
To determine genes associated with the effects of MVT- treatment in diabetic hearts, cardiac gene expression in- duced in the diabetic MVT-treated group was compared with the diabetic vehicle-treated group (Tables 4 and 5).
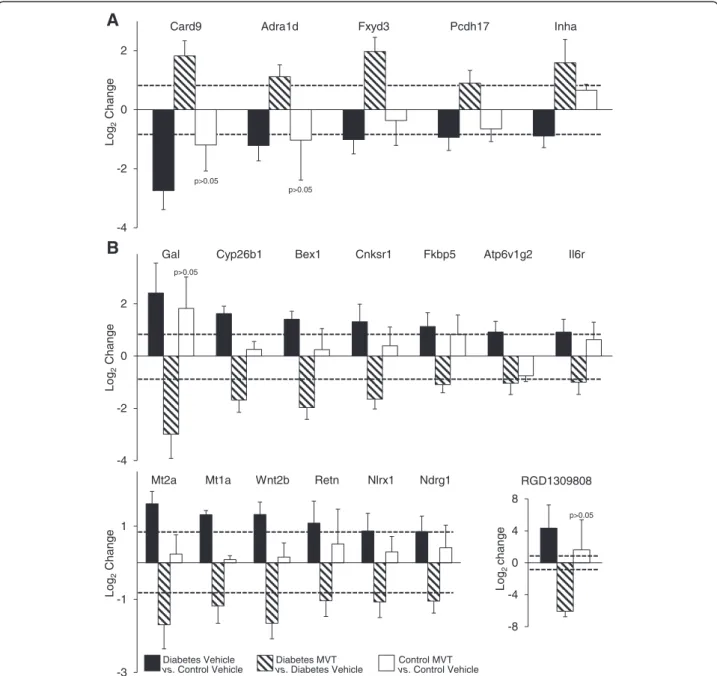
In diabetic MVT-treated hearts, 15 genes showed signifi- cant up-regulation and 29 genes showed significant down-regulation, compared to diabetic vehicle-treated controls (Tables 4 and 5). In the diabetic MVT-treated group, an additional 23 genes were found, which expres- sion pattern was significantly influenced only by the MVT-treatment. These 23 genes did not show signifi- cant gene expression change in the diabetic vehicle- treated group as compared to the control vehicle-treated group (Tables 2 and 5). To assess potential beneficial ef- fects of MVT-treatment, we analysed opposite gene ex- pression changes in the diabetic MVT-treated group as compared to the diabetic vehicle-treated group. Among the oppositely altered genes in the diabetic MVT-treated group, 5 genes showed significant up-regulation and 14 genes showed significant down-regulation, respectively (Fig. 2). These 19 genes may be associated with potential cardioprotective effects of MVT-treatment in DM.
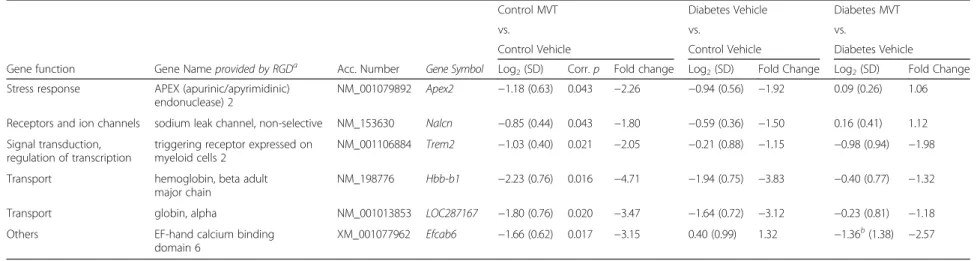
Identification of genes associated with MVT-treatment in healthy condition
To determine genes associated with the effects of MVT- treatment in healthy control hearts, cardiac gene expres- sion induced in the control MVT-treated group was compared with the control vehicle-treated group (Tables 6 and 7). In control MVT-treated hearts, 18 genes showed significant up-regulation and 6 genes showed significant down-regulation (Tables 6 and 7). Out of these signifi- cantly altered 24 genes, 18 genes were not significantly al- tered in diabetic MVT-treated rats. These 18 genes may be associated with potential beneficial effects of MVT- treatment in healthy or diseased conditions.
Validation of microarray data by qRT-PCR
To confirm the microarray data we measured the ex- pression of selected 5 genes by qRT-PCR in 2 different setups: 1) diabetes vehicle-treatment vs. control vehicle- treatment groups and 2) diabetes MVT-treatment vs.
diabetes vehicle-treatment groups (Tables 8 and 9). In both setups, the expression changes of 4 genes were confirmed by qRT-PCR and showed reliability of the microarray data.
Discussion
In the present study we have confirmed that chronic treatment with a MVT preparation attenuated the pro- gression of DM by improving diagnostic markers of DM including glucose tolerance, FBG, HbA1c, and serum
Sárközyet al. Cardiovascular Diabetology (2015) 14:85 Page 7 of 20
Table 3Genes significantly up-regulated in diabetes vehicle-treated vs. control vehicle-treated group on DNA microarray
Diabetes Vehicle Diabetes MVT Control MVT
vs. vs. vs.
Control Vehicle Diabetes Vehicle Control Vehicle
Gene function Gene Nameprovided by RGDa Acc. Number Gene Symbol Log2(SD) Corr.p Fold change Log2(SD) Fold Change Log2(SD) Fold Change
Metabolism UDP-N-acetyl-alpha-D-galactosamine:
polypeptide
N-acetylgalactosaminyltransferase 15
XM_003752864 Galnt15 0.85 (0.53) 0.047 1.81 −0.58 (0.40) −1.49 0.32 (0.55) 1.25
Metabolism microtubule associated
monooxygenase, calponin and LIM domain containing 1
NM_001106397 Mical1 0.89 (0.23) 0.007 1.86 −0.21 (0.19) −1.16 0.52 (0.23) 1.43
Metabolism proline dehydrogenase
(oxidase) 1
NM_001135778 Prodh 0.95 (0.48) 0.026 1.93 −0.27 (0.63) −1.21 0.93 (0.50) 1.91
Metabolism 4-hydroxyphenylpyruvate dioxygenase NM_017233 Hpd 1.07 (0.38) 0.011 2.09 −0.06 (0.34) −1.04 1.00 (0.48) 2.01
Stress response glutathione S-transferase, theta 3 NM_001137643 Gstt3 0.88 (0.52) 0.042 1.84 −0.13 (0.38) −1.09 0.61 (0.80) 1.52
Stress response heme oxygenase (decycling) 1 NM_012580 Hmox1 1.08 (0.47) 0.017 2.12 −0.62 (0.49) −1.54 0.52 (0.25) 1.43
Stress response metallothionein 1a NM_138826 Mt1a 1.32 (0.34) 0.005 2.49 −1.18 (0.43) −2.26 0.09 (0.39) 1.06
Stress response metallothionein 2a NM_001137564 Mt2a 1.61 (0.34) 0.003 3.06 −1.70 (0.66) −3.24 0.24 (0.53) 1.18
Immune response NLR family member X1 NM_001025010 Nlrx1 0.87 (0.48) 0.036 1.83 −1.07 (0.43) −2.10 0.30 (0.43) 1.23
Immune response FK506 binding protein 5 NM_001012174 Fkbp5 1.13 (0.52) 0.020 2.19 −1.09 (0.32) −2.13 0.83 (0.74) 1.77
Immune response influenza virus NS1A binding protein NM_001047085 Ivns1abp 1.27 (0.40) 0.008 2.41 −0.65 (0.35) −1.57 0.68 (0.79) 1.60 Apoptosis/necrosis and inflammation interleukin 6 receptor NM_017020 Il6r 0.91 (0.50) 0.034 1.88 −1.00 (0.47) −2.00 0.63 (0.67) 1.54 Cell growth and differentiation H19, imprinted maternally
expressed transcript
NR_027324 H19 0.92 (0.49) 0.032 1.89 −0.53 (0.47) −1.44 1.16 (0.44) 2.24
Cell growth and differentiation secreted frizzled-related protein 2 NM_001100700 Sfrp2 1.22 (0.73) 0.039 2.34 −0.62 (0.77) −1.54 0.87b(0.73) 1.83 Cell growth and differentiation wingless-type MMTV integration
site family, member 2B
NM_001191848 Wnt2b 1.32 (0.11) 0.003 2.50 −1.66 (0.48) −3.15 0.16 (0.11) 1.11
Cell growth and differentiation brain expressed, X-linked 1 NM_001037365 Bex1 1.41 (0.30) 0.003 2.65 −1.97 (0.45) −3.92 0.25 (0.81) 1.19 Cell growth and differentiation N-myc downstream regulated 1 NM_001011991 Ndrg1 0.85 (0.42) 0.027 1.81 −1.05 (0.33) −2.07 0.41 (0.62) 1.33 Receptors and ion channels solute carrier family 26 (anion
exchanger), member 3
NM_053755 Slc26a3 0.88 (0.34) 0.015 1.84 −0.03 (0.23) −1.02 0.01 (0.32) 1.01
Receptors and ion channels ATPase, H+transporting, lysosomal V1 subunit G2
NM_212490 Atp6v1g2 0.92 (0.41) 0.020 1.89 −1.05 (0.43) −2.06 −0.75 (0.22) −1.68
Receptors and ion channels ATP-binding cassette, subfamily A (ABC1), member 1
NM_178095 Abca1 1.01 (0.35) 0.011 2.01 −0.22 (0.39) −1.17 0.54 (0.40) 1.45
Receptors and ion channels sarcolipin NM_001013247 Sln 1.07 (0.61) 0.036 2.10 −0.23 (0.42) −1.17 1.09 (0.61) 2.13
Sárközyetal.CardiovascularDiabetology (2015) 14:85 Page8of20
Table 3Genes significantly up-regulated in diabetes vehicle-treated vs. control vehicle-treated group on DNA microarray(Continued) Signal transduction, regulation of
transcription
zinc finger and BTB domain containing 16
NM_001013181 Zbtb16 0.89 (0.29) 0.011 1.85 −0.69 (0.33) −1.62 0.37 (0.52) 1.30
Signal transduction, regulation of transcription Rho-related BTB domain containing 1
NM_001107622 Rhobtb1 0.91 (0.25) 0.008 1.88 −0.22 (0.25) −1.16 0.58 (0.55) 1.49
Signal transduction, regulation of transcription connector enhancer of kinase suppressor of Ras 1
NM_001039011 Cnksr1 1.31 (0.67) 0.025 2.48 −1.64 (0.38) −3.13 0.39 (0.72) 1.31
Signal transduction, regulation of transcription
cytochrome P450, family 26, subfamily b, polypeptide 1
NM_181087 Cyp26b1 1.62 (0.28) 0.003 3.08 −1.68 (0.47) −3.20 0.25 (0.30) 1.19
Structural protein, cell adhesion pannexin 2 NM_199409 Panx2 0.97 (0.17) 0.003 1.96 −0.56 (0.33) −1.47 0.81 (0.15) 1.75
Structural protein, cell adhesion myosin light chain kinase 2 NM_057209 Mylk2 1.17 (0.32) 0.006 2.25 −0.05 (0.37) −1.03 1.05b(0.69) 2.08
Hormones resistin NM_144741 Retn 1.08 (0.60) 0.034 2.12 −1.03 (0.44) −2.05 0.51 (0.96) 1.43
Hormones galanin/GMAP prepropeptide NM_033237 Gal 2.41 (1.15) 0.018 5.31 −2.99 (0.92) −7.96 1.82b(1.20) 3.53
Hormones natriuretic peptide A NM_012612 Nppa 1.23 (0.45) 0.011 2.34 −0.62 (0.42) −1.54 0.79 (0.38) 1.73
Others myosin binding protein H-like NM_001014042 Mybphl 1.26 (0.75) 0.038 2.39 −0.66 (0.68) −1.58 1.09b(0.71) 2.13
Others prostaglandin D2 synthase (brain) NM_013015 Ptgds 1.32 (0.69) 0.026 2.50 −0.64 (0.46) −1.56 0.67 (0.87) 1.59
Others visinin-like 1 NM_012686 Vsnl1 1.49 (0.79) 0.026 2.80 −1.01b(0.77) −2.01 1.16b(0.76) 2.24
Others transmembrane protein 140 NM_001009709 Tmem140 1.49 (0.27) 0.003 2.80 −0.59 (0.42) −1.50 0.30 (0.26) 1.23
Others IQ motif and ubiquitin domain
containing
NM_001034130 Iqub 0.94 (0.36) 0.014 1.91 0.23 (0.20) 42021 0.52 (0.59) 1.44
Others similar to apolipoprotein L2;
apolipoprotein L-II
NM_001134801 RGD1309808 4.33 (2.91) 0.049 42358 −6.07 (0.68) −67.24 1.61b(3.76) 3.05
Others thioredoxin domain
containing 16
XM_001072487 Txndc16 0.85 (0.31) 0.015 1.80 −0.72 (0.32) −1.65 0.51 (0.32) 1.42
Values show gene expression. Log2ratio reaching at least ±0.85 andp< 0.05 were considered as significant alterations
aRGD: rat genome database
bnon significant change (p> 0.05)
Sárközyetal.CardiovascularDiabetology (2015) 14:85 Page9of20
Table 4Genes significantly down-regulated in diabetes MVT-treated vs. diabetes vehicle-treated group on DNA microarray
Diabetes MVT Diabetes Vehicle Control MVT
vs. vs. vs.
Diabetes Vehicle Control Vehicle Control Vehicle
Gene function Gene Nameprovided by RGDa Acc. Number Gene Symbol Log2(SD) Corr.p Fold change Log2(SD) Fold Change Log2(SD) Fold Change
Metabolism dipeptidase 1 (renal) L07315 Dpep1 −1.02 (0.27) 0.007 −2.03 0.79 (0.47) 1.72 −0.17 (0.50) −1.12
Metabolism glycosylphosphatidylinositol
anchored high density lipoprotein binding protein 1
NM_001130547 Gpihbp1 −0.89 (0.18) 0.006 −1.86 0.59 (0.33) 1.50 0.10 (0.37) 1.07
Metabolism flavin containing monooxygenase 2 NM_144737 Fmo2 −0.85 (0.36) 0.028 −1.80 0.80 (0.24) 1.74 0.12 (0.29) 1.08
Stress response metallothionein 2a NM_001137564 Mt2a −1.70 (0.66) 0.018 −3.24 1.61 (0.34) 3.06 0.24 (0.53) 1.18
Stress response metallothionein 1a NM_138826 Mt1a −1.18 (0.43) 0.017 −2.26 1.32 (0.34) 2.49 0.09 (0.39) 1.06
Immune response FK506 binding protein 5 NM_001012174 Fkbp5 −1.09 (0.32) 0.008 −2.13 1.13 (0.52) 2.19 0.83 (0.74) 1.77
Immune response NLR family member X1 NM_001025010 Nlrx1 −1.07 (0.43) 0.023 −2.10 0.87 (0.48) 1.83 0.30 (0.43) 1.23
Apoptosis/necrosis and inflammation chemokine (C-X-C motif) ligand 13 NM_001017496 Cxcl13 −1.66 (0.84) 0.036 −3.17 0.61 (1.02) 1.53 0.18 (0.96) 1.14 Apoptosis/necrosis and inflammation interleukin 6 receptor NM_017020 Il6r −1.00 (0.47) 0.033 −2.00 0.91 (0.50) 1.88 0.63 (0.67) 1.54 Cell growth and differentiation brain expressed, X-linked 1 NM_001037365 Bex1 −1.97 (0.45) 0.004 −3.92 1.41 (0.30) 2.65 0.25 (0.81) 1.19 Cell growth and differentiation wingless-type MMTV
integrationsite family, member 2B
NM_001191848 Wnt2b −1.66 (0.48) 0.007 −3.15 1.32 (0.11) 2.50 0.16 (0.11) 1.11
Cell growth and differentiation RAB3 GTPase activating protein subunit 2
AI072072 Rab3gap2 −1.25 (0.57) 0.029 −2.38 0.53 (0.33) 1.45 0.22 (0.53) 1.17
Cell growth and differentiation N-myc downstream regulated 1 NM_001011991 Ndrg1 −1.05 (0.33) 0.012 −2.07 0.85 (0.42) 1.81 0.41 (0.62) 1.33 Cell growth and differentiation WNT1 inducible signaling pathway
protein 2
NM_031590 Wisp2 −1.02 (0.53) 0.043 −2.02 0.60 (0.40) 1.52 0.47 (0.34) 1.39
Cell growth and differentiation serine (or cysteine) peptidase inhibitor, clade A, member 3 N
NM_031531 Serpina3n −0.90 (0.48) 0.048 −1.87 −0.03 (0.39) −1.02 0.90 (1.09) 1.87
Receptors and ion channels ATPase, H+transporting,lysosomal V1 subunit G2
NM_212490 Atp6v1g2 −1.05 (0.43) 0.024 −2.06 0.92 (0.41) 1.89 −0.75 (0.22) −1.68
Receptors and ion channels melanocortin 2 receptoraccessory protein
NM_001135834 Mrap −0.92 (0.42) 0.033 −1.89 0.65 (0.19) 1.56 0.12 (0.21) 1.09
Signal transduction, regulation of transcription
cytochrome P450, family 26, subfamily b, polypeptide 1
NM_181087 Cyp26b1 −1.68 (0.47) 0.007 −3.20 1.62 (0.28) 3.08 0.25 (0.30) 1.19
Signal transduction, regulation of transcription
connector enhancer of kinase suppressor of Ras 1
NM_001039011 Cnksr1 −1.64 (0.38) 0.004 −3.13 1.31 (0.67) 2.48 0.39 (0.72) 1.31
Structural protein, cell adhesion solute carrier family 43 (amino acid system L transporter), member 2
NM_001105812 Slc43a2 −1.06 (0.39) 0.019 −2.09 0.34 (0.19) 1.27 −0.07 (0.18) −1.05
Hormones galanin/GMAP prepropeptide NM_033237 Gal −2.99 (0.92) 0.007 −7.96 2.41 (1.15) 5.31 1.82 (1.20) 3.53
Sárközyetal.CardiovascularDiabetology (2015) 14:85 Page10of20
Table 4Genes significantly down-regulated in diabetes MVT-treated vs. diabetes vehicle-treated group on DNA microarray(Continued)
Hormones resistin NM_144741 Retn −1.03 (0.44) 0.025 −2.05 1.08 (0.60) 2.12 0.51 (0.96) 1.43
Others similar to apolipoprotein L2;
apolipoprotein L-II
NM_001134801 RGD1309808 −6.07 (0.68) <0.001 −67.24 4.33 (2.91) 20.12 1.61 (3.76) 3.05
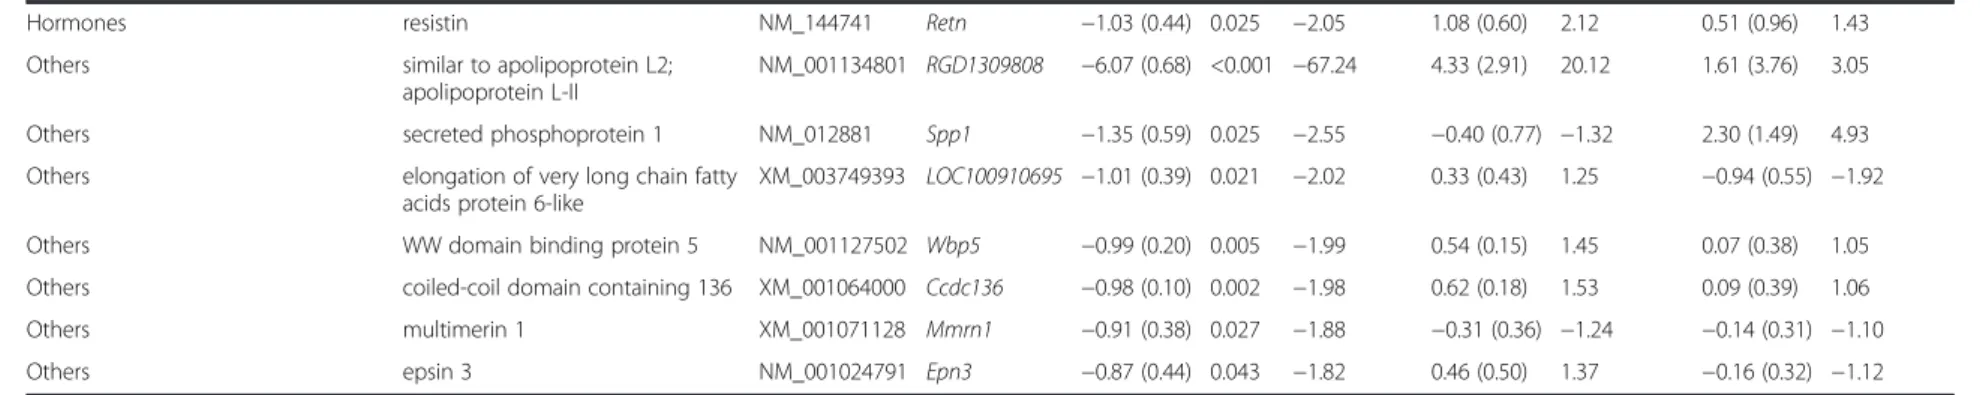
Others secreted phosphoprotein 1 NM_012881 Spp1 −1.35 (0.59) 0.025 −2.55 −0.40 (0.77) −1.32 2.30 (1.49) 4.93
Others elongation of very long chain fatty
acids protein 6-like
XM_003749393 LOC100910695 −1.01 (0.39) 0.021 −2.02 0.33 (0.43) 1.25 −0.94 (0.55) −1.92
Others WW domain binding protein 5 NM_001127502 Wbp5 −0.99 (0.20) 0.005 −1.99 0.54 (0.15) 1.45 0.07 (0.38) 1.05
Others coiled-coil domain containing 136 XM_001064000 Ccdc136 −0.98 (0.10) 0.002 −1.98 0.62 (0.18) 1.53 0.09 (0.39) 1.06
Others multimerin 1 XM_001071128 Mmrn1 −0.91 (0.38) 0.027 −1.88 −0.31 (0.36) −1.24 −0.14 (0.31) −1.10
Others epsin 3 NM_001024791 Epn3 −0.87 (0.44) 0.043 −1.82 0.46 (0.50) 1.37 −0.16 (0.32) −1.12
Values show gene expression. Log2ratio reaching at least ±0.85 andp< 0.05 were considered as significant alterations
aRGD: rat genome database
bnon significant change (p> 0.05)
Sárközyetal.CardiovascularDiabetology (2015) 14:85 Page11of20
Table 5Genes significantly up-regulated in diabetes MVT-treated vs. diabetes vehicle-treated group on DNA microarray
Diabetes MVT Diabetes Vehicle Control MVT
vs. vs. vs.
Diabetes Vehicle Control Vehicle Control Vehicle
Gene function Gene Nameprovided by RGDa Acc. Number Gene Symbol Log2(SD) Corr.p Fold change Log2(SD) Fold Change Log2(SD) Fold Change
Metabolism L-2-hydroxyglutarate
dehydrogenase
NM_001108028 L2hgdh 1.06 (0.49) 0.032 2.09 −0.52 (1.01) −1.44 0.04 (0.92) 1.03
Apoptosis/necrosis and inflammation
chemokine (C-X-C motif) ligand 9
NM_145672 Cxcl9 1.03 (0.40) 0.021 2.04 −0.29 (0.60) −1.22 −0.19 (0.81) −1.14
Apoptosis/necrosis and inflammation
caspase recruitment domain family, member 9
NM_022303 Card9 1.82 (0.52) 0.007 3.53 −2.74 (0.64) −6.69 −1.20b(0.88) −2.29
Receptors and ion channels
adrenoceptor alpha 1D NM_024483 Adra1d 1.12 (0.40) 0.017 2.17 −1.21 (0.52) −2.31 −1.03b(1.36) −2.04
Receptors and ion chanells
FXYD domain-containing ion transport regulator 3
NM_172317 Fxyd3 1.97 (0.48) 0.004 3.92 −1.01 (0.49) −2.01 −0.36 (0.85) −1.29
Signal transduction, regulation of transcription
regulator of telomere elongation helicase 1
NM_001191857 Rtel1 1.14 (0.27) 0.006 2.20 −0.71 (1.02) −1.64 0.58 (1.14) 1.49
Signal transduction, regulation of transcription
staufen double-stranded RNA binding protein 2
NM_001007149 Stau2 1.36 (0.71) 0.042 2.56 −0.38 (0.27) −1.30 0.22 (0.41) 1.16
Structural protein, cell adhesion
protocadherin 17 NM_001107279 Pcdh17 0.90 (0.43) 0.036 1.86 −0.94 (0.44) −1.91 −0.65 (0.43) −1.57
Hormones inhibin alpha NM_012590 Inha 1.59 (0.79) 0.035 3.01 −0.89 (0.39) −1.85 0.66 (0.21) 1.58
Others similar to HTGN29 protein;
keratinocytes associated transmembrane protein 2
NM_001106999 RGD131352 1.05 (0.48) 0.032 2.07 0.29 (0.49) 1.23 0.49 (0.53) 1.41
Others WDNM1 homolog NM_001003706 LOC360228 1.32 (0.63) 0.033 2.50 −0.59 (0.77) −1.50 1.01b(0.67) 2.01
Others ring finger protein 135 NM_001012010 Rnf135 0.86 (0.33) 0.023 1.82 −0.44 (0.08) −1.35 −0.06 (0.46) −1.05
Others uncharacterized LOC100910110 XR_146304 LOC100910110 2.32 (0.31) 0.001 5.01 −1.94 (0.32) −3.85 −0.46 (1.57) −1.38
Others uncharacterized LOC100909684 XR_146107 LOC10099684 2.55 (1.40) 0.045 5.85 −3.07 (1.43) −8.43 −0.42 (0.76) −1.34
Others serine hydrolase-like 2 NM_001130579 Serhl2 5.17 (0.48) <0.001 35.96 −3.62b(2.81) −12.31 −3.45b(2.82) −10.92 Values show gene expression. Log2ratio reaching at least ±0.85 andp< 0.05 were considered as significant alterations
aRGD: rat genome database
bnon significant change (p> 0.05)
Sárközyetal.CardiovascularDiabetology (2015) 14:85 Page12of20
![Table 1). To conform to the human daily dose of the preparation, the daily rat dose was adjusted according to the ratio of human and rat body surface areas as de-scribed previously [14]](https://thumb-eu.123doks.com/thumbv2/9dokorg/1382366.114092/3.892.87.812.516.1086/table-conform-preparation-adjusted-according-surface-scribed-previously.webp)