Cell Free DNA of Tumor Origin Induces a
‘ Metastatic ’ Expression Profile in HT-29 Cancer Cell Line
István Fűri2*, Alexandra Kalmár1, Barnabás Wichmann2, Sándor Spisák2, Andrea Schöller1, Barbara Barták1, Zsolt Tulassay2, Béla Molnár2
12ndDept. of Internal Medicine, Semmelweis University, Budapest, Hungary,2Hungarian Academy of Sciences, Molecular Medicine Research Unit, Budapest, Hungary
*furiistvan88@gmail.com
Abstract
Background
Epithelial cells in malignant conditions release DNA into the extracellular compartment. Cell free DNA of tumor origin may act as a ligand of DNA sensing mechanisms and mediate changes in epithelial-stromal interactions.
Aims
To evaluate and compare the potential autocrine and paracrine regulatory effect of normal and malignant epithelial cell-related DNA on TLR9 and STING mediated pathways in HT-29 human colorectal adenocarcinoma cells and normal fibroblasts.
Materials and Methods
DNA isolated from normal and tumorous colonic epithelia of fresh frozen surgically removed tissue samples was used for 24 and 6 hour treatment of HT-29 colon carcinoma and HDF-α fibroblast cells. Whole genome mRNA expression analysis and qRT-PCR was performed for the elements/members of TLR9 signaling pathway. Immunocytochemistry was per- formed for epithelial markers (i.e. CK20 and E-cadherin), DNA methyltransferase 3a (DNMT3a) and NFκB (for treated HDFαcells).
Results
Administration of tumor derived DNA on HT29 cells resulted in significant (p<0.05) mRNA level alteration in 118 genes (logFc1, p0.05), including overexpression of metallothio- nein genes (i.e.MT1H,MT1X,MT1P2,MT2A), metastasis-associated genes (i.e.
TACSTD2,MACC1,MALAT1), tumor biomarker (CEACAM5), metabolic genes (i.e.
INSIG1,LIPG), messenger molecule genes (i.e.DAPP,CREB3L2).Increasedprotein levels of CK20, E-cadherin, and DNMT3a was observed after tumor DNA treatment in HT-29 cells. Healthy DNA treatment affected mRNA expression of 613 genes (logFc1, p0.05), a11111
OPEN ACCESS
Citation:Fűri I, Kalmár A, Wichmann B, Spisák S, Schöller A, Barták B, et al. (2015) Cell Free DNA of Tumor Origin Induces a‘Metastatic’Expression Profile in HT-29 Cancer Cell Line. PLoS ONE 10(7):
e0131699. doi:10.1371/journal.pone.0131699
Editor:Javier S Castresana, University of Navarra, SPAIN
Received:April 8, 2015 Accepted:June 5, 2015 Published:July 2, 2015
Copyright:© 2015 Fűri et al. This is an open access article distributed under the terms of theCreative Commons Attribution License, which permits unrestricted use, distribution, and reproduction in any medium, provided the original author and source are credited.
Data Availability Statement:All relevant data are available via the Gene Expression Omnibus (GEO) under accession number GSE67557.
Funding:This study was funded by the Research and Technology Innovation Fund, Hungary, KMR_12- 1-2012-0216 to BM and Hungarian Scientific Research Fund (OTKA-K111743 grant) to ZT. The funders had no role in study design, data collection and analysis, decision to publish, or preparation of the manuscript.
Competing Interests:The authors have declared
IRAK2,NFκB,IL8,IL-1β), STING pathway (ADAR, IRF7, CXCL10, CASP1) and theFGF2 gene.
Conclusions
DNA from tumorous colon epithelium, but not from the normal epithelial cells acts as a pro- metastatic factor to HT-29 cells through the overexpression of pro-metastatic genes through TLR9/MYD88 independent pathway. In contrast, DNA derived from healthy colonic epithe- lium induced TLR9 and STING signaling pathway in normal fibroblasts.
Introduction
Altered epithelial-stromal interactions are fundamental in cancer formation. Among the well- known regulatory ligands (e.g. growth factors, cytokines, chemokines, sex hormones) tumor tissue-derived DNA is also involved in this communication via cellular receptors sensing DNA [1] According to several studies [2–4] the DNA fragments of tumor origin (i.e. 21 to 500 bases short sequences of human origin) play a role in the formation of a tumor supportive microen- vironment (i.e. promote tumor invasion and evasion of immune surveillance) [5–8] The cell free DNA originates from necrotic/apoptotic tumor cells, and can be actively released by living cells to the intercellular compartment [9–12]. This tumor tissue originated DNA is detectable in the plasma and serum and could serve a useful biomarker for cancer detection [11]. It con- tains a number of cancer specific entities, including oncogenes, tumor suppressor genes, aber- rant microsatellites, aberrant DNA methylation genes, and rearranged chromosomal DNA [12]. Recent studies confirmed the uptake and the retention of oncogenes stimulating cell pro- liferation in non-malignant cells after integration (oncometastasis) into the recipients cell´s genome [13].
To the extent they are understood, the DNA sensing mechanisms in the target cells com- prise two primary adaptor pathways, i.e. toll-like receptor (TLR9) and the stimulator of inter- feron genes (STING) pathways.[14] Cytoplasmic TLR9 recognizes endogenous ligands, such as danger-associated molecular patterns (DAMPs) like unmethylated DNA sequences [7,8,15]
The total amount of unmethylated DNA increases in parallel with global DNA hypomethyla- tion in tumor tissue compared to the normal tissue [16]. The increased expression of TLR9 was detected in several tumor types.[1,17–20] Increased TLR9 expression in carcinoma cells was associated with higher metastatic potential, while higher TLR9 expression by fibroblast-like cells was associated with a low probability of metastasis [21]
The STING signaling pathway is an adaptor for DNA via binding of cyclic dinucleotides generated by the enzyme cyclic GMP-AMP (cGAMP) synthase (cGAS).[22–24]
Strong synergism has been observed among cooperating STING and TLR9 signaling. These two signaling pathways are differentially regulated by crucial adaptor molecules (IRF3/7, STING, and MyD88) [25]. Furthermore Deng et al. (2014) and Woo et al. (2014) provided evi- dence suggesting dendritic cells detect DNA from tumor cells via the STING-mediated, cyto- solic DNA sensing pathway. [22,26,27]
Based on our previous results, HT-29 human colon adenocarcinoma cells reflected altered DNA methylation level (via elevated DNMT3a methyltranferase activity) and CK20 epithelial marker expression after re—administration of self DNA.[28] In the present study we analyzed the autocrine and paracrine effects of DNA from tumor and healthy tissue on HT-29 cancer cells and fibroblasts by whole genomic mRNA expression analysis, and qRT PCR for validation
of genes from TLR9 pathway. Furthermore immunocytochemical analysis was performed for selected differentiation markers, cell- adhesion molecules, and methyltransferases, for verifica- tion at the protein level following treatment with DNA from healthy and tumor tissues.
Materials and Methods
HT-29 cell culture
HT-29 human colon adenocarcinoma cells were purchased from LGC STANDARDS (cat. No.
ATCC HTB-38) and cultured in a specific pathogen-free cell culture laboratory at 37°C in 5%
CO2. HT-29 cells were maintained in McCoy's 5a Medium Modified (Cat No. M8403-500 mL Sigma-Aldrich, St Louis, USA) supplemented with 10% (vol/vol) fetal bovine serum (FBS; Stan- dard Quality; PAA Laboratories GmbH, Pasching, Austria), 160μg/ml gentamycin (Sandoz, Sandoz GmbH, Austria), and 125μg/ml amphotericin B (Sigma-Aldrich, St Louis, USA).
HDF
αcell culture
HDFαcells were purchased from Life technologies (cat. No. C0135C) and cultured in a specific pathogen-free cell culture laboratory at 37°C in 5% CO2. HDFαcells were maintained in Medium 106 (Life Technologies Corporation, Carlsbad, USA) supplemented with LSGS (Life Technologies Corporation, Carlsbad, USA) and amphotericin B (Sigma). 160μg/ml gentamy- cin (Sandoz, Sandoz GmbH, Austria).
DNA isolation
Genomic DNA was isolated from macroscopically normal areas near colorectal cancers (CRC) and from the tumorous tissue areas of surgically removed macrodissected fresh frozen CRC samples (stage II, moderately differentiated tumors from sigmoid colon and rectum (25–50 mg tissue) by High Pure PCR template preparation kit (Roche GmbH, Germany). These CRC patients were all confirmed by definitive histological diagnosis and received no preoperative chemotherapy or radiotherapy. The isolated, protein-free DNA was treated with 20μl RNase A/T1 Mix at 37°C for 1 hour (Thermo Scientific, Germany). The concentration of isolated and purified DNA was determined by Nanodrop-1000 spectrophotometer (Thermo Scientific, Germany).
Ethics statement
The study was conducted according to the declaration of Helsinki and approved by Semmel- weis University Ethics Committee and the governmental Regional and Institutional Committee of Science and Research Ethics (TUKEB), Nr: 23970-2/2011). Written informed consent was obtained from all patients included in the study.
DNA treatment of HT-29 and HDFα cells
HT-29 and HDFαcells were seeded (at a density of 0.5x10⁶and 0.1x10⁶)into 6 well Corning CellBIND cell culture multiwell plates in RPMI 1640 supplemented with gentamycin, ampho- tericin B and FBS. When monolayers reached 80–90% of confluency, 15μg of normal or tumor DNA (dissolved in 200μl sterile phosphate buffered saline (PBS) were added to the wells. The negative control comprised appropriate volumes of PBS. Cells were incubated at 37°C in a 5%
Isolation of total RNA for Affymetrix HGU133 Plus 2.0 microarray and qRT-PCR gene expression analyses
After 24 hours, cells were washed two times in 5 ml sterile PBS. After the second wash, cells were resuspended in 5 ml PBS. 2.5 ml of cell suspension was used for total RNA isolation. Total RNA from the isolated HT-29 cells was extracted with the RNeasy Mini kit (Qiagen, USA) according to the instructions of the manufacturer. The isolated RNA was stored at -80°C.
mRNA expression microarray analysis
The quantity and quality of the isolated RNA were tested by measuring absorbance and by cap- illary gelelectrophoresis using the 2100 Bioanalyzer and RNA 6000 Pico Kit (Agilent Inc, Santa Clara, US). Biotinylated cRNA probes were synthesized from 4.82±0.60μg total RNA and frag- mented using the One-Cycle Target Labeling and Control Kit according to the Affymetrix description. Tenμg of each fragmented cRNA sample were hybridized into HGU133 Plus2.0 array (Affymetrix) at 45°C for 16 hours. Microarrays were washed and stained using Fluidics Station 450 (Affymetrix) and an antibody amplification staining method according to the man- ufacturer's instructions. The fluorescent signals were detected by a GeneChip Scanner 3000 (Affymetrix).
Statistical evaluation of mRNA expression profiles
Pre-processing and quality control analyses were performed according to the suggestions of The Tumour Analysis Best Practices Working Group (Tumor Analysis Best Practices Working Group, 2004). Scanned images were inspected for artifacts; the percentage of present calls (>25%) and degree of RNA degradation were evaluated. On the basis of evaluation criteria, all measurements fulfilled the minimal quality requirements. In the case of HT29 and HDFαcell experiments, the similarity of the 2–2 biological replicates was stated using the Euclidean dis- tance method. Affymetrix expression arrays were pre-processed by gcRMA with quantile nor- malization and median polish summarization.
Further analyses to identify differentially expressed features was performed with signifi- cance analysis of microarrays (SAM). The nearest shrunken centroid method (prediction anal- ysis of microarrays = PAM) was applied for sample classification from gene expression data.
Prediction analysis of microarrays uses soft thresholding to produce a shrunken centroid, which allows the selection of characteristic genes with high predictive potential (Tibshirani et al, 2002). Pre-processing, data mining and statistical steps were performed using Bioconduc- tor libraries in the R-environment. Annotation and functional classification of discriminatory genes were performed using the Affymetrix NetAffx system.
Reverse transcription and quantitative real time polymerase chain reaction
After quantitative (Nanodrop) and qualitative analysis (BioAnalyzer RNA 6000 Pico Kit chip kit RNA program; RIN>8 in all cases), reverse transcription was performed by using 1μg of total RNA (High Capacity cDNA Reverse Transcription Kit, Applied Biosystems, USA).
Quantitative real-time (qRT) PCR was performed using Probes Master and SYBR green (Roche GmbH, Germany). Gene expression levels for each individual sample were normalized to GAPDH expression. Mean relative gene expression was determined and differences were calculated using the 2-ΔC(t) method. Oligonucleotide primers of TLR 9 (MYD88-dependent) signaling pathway are listed inTable 1.
Cell viability assays
0.1x10⁶HT-29 cells were seeded at a density of 0.1x10⁶into Corning CellBIND cell culture multiwell plates in RPMI 1640, supplemented with gentamycin and FCS. After 24 hours, the medium was changed; and, 15μg of tumor and normal DNA [dissolved in 200μl sterile phos- phate buffered saline (PBS)] was added to the wells. The negative control is comprised of an appropriate volume of PBS. Cells were incubated at 37°C in a 5% CO2 atmosphere and 95%
humidity for 72h.
After 72 hour treatment, the cells were harvested, washed twice in 0.5 ml sterile PBS, re-sus- pended in 1.0 ml of ice cold 70% ethanol and stored at -20°C. Measurement was performed in triplicates for each treatment group.
Samples were centrifuged for 3 min at 1300 rpm. Then, the cells were re-suspended in 300μ1 of extraction buffer; and, 3μl of RNAse (RNase A/T1 Mix, Thermo Fisher Scientific Baltics UAB, Vilnius, Lithuania) was added. After 15 min incubation at room temperature, 3μl of propidium jodide (Sigma-Aldrich, St. Louis, USA; Cat. No. 81845) was added. The FACS measurement was performed on BD FACScalibur (New Jersey, USA).
Trypan blue exclusion tests were performed to assess the cell viability following exposure to tumor and normal cell free DNA. The HT-29 cell´s viability was then quantified by counting the number of living and dead cells using a hemocytometer at the time point 72h post tumor and normal DNA administration.
Table 1. List of the oligonucleotide primers of TLR9 (MYD88-dependent) signaling pathway.
Gene Symbol Gene title Sequence of selected primers
hTLR9_F human toll-like receptor 9 (fwd) CCTCCTGCTCAAGCTACACC
hTLR9_R human toll-like receptor 9 (reverse) CTTGTCCTTTTCTGCCCTTG
hMYD88_aF human MYD88 (forward) GAAGAAAGAGTTCCCCAGCA
hMYD88_aR human MYD88 (reverse) GTGCAGGGGTTGGTGTAGTC
hMYD88_bF human MYD88 (forward) CTCCTCCACATCCTCCCTTC
hMYD88_bR human MYD88 (reverse) CGCACGTTCAAGAACAGAGA
hIRAK2_F human interleukin associated kinase (forward) CTTGGAGTGGGCTTTCTGAG
hIRAK2_R human interleukin associated kinase (reverse) AGGCTGGAATTGTCAACGTC
hIRAK4_F human interleukin associated kinase(forward) GCTGCCTCAATGTTGGACTAA
hIRAK4_R human interleukin associated kinase(reverse) TTCCATCCTTCTTGAGGATCA
hTRAF6_F human tumor necrosis factor receptor associated factor 6 (forward) CTTTGGCAAATGTCATCTGTG hTRAF6_R human tumor necrosis factor receptor associated factor 6 (reverse) CTGAATGTGCATGGAATTGG
hNFκB1_F human nuclear factorκB (forward) TATGTGGGACCAGCAAAGGT
hNFκB1_R human nuclear factorκB (reverse) GCAGATCCCATCCTCACAGT
hIL8_F human interleukin 8 (forward) GTGCAGTTTTGCCAAGGAGT
hIL8_R human interleukin 8 (reverse) AAATTTGGGGTGGAAAGGTT
hIL1B_F human interleukin 1β(forward) GCATCCAGCTACGAATCTCC
hIL1B_R human interleukin 1β(reverse) GCATCTTCCTCAGCTTGTCC
hDNMT1_F human DNA methyltransferase 1 (forward) AGGCAGTTCAACACCCTCAT
hDNMT1_R human DNA methyltransferase 1 (reverse) TGACGGTTGTGCTGAAGAAG
hTNFa_F human tumor necrosis factorα(forward) CCTGTGAGGAGGACGAACAT
hTNFa_R human tumor necrosis factorα(reverse) GGTTGAGGGTGTCTGAAGGA
doi:10.1371/journal.pone.0131699.t001
Immunocytochemical analysis
From the HT-29 cell suspension 2.5 ml was used for immunocytochemical (ICC) analyses.
HT-29 cells were cyto-centrifuged onto a coverslip and fixed in methanol at -20°C for 10 min, and then incubated in TBS containing 1% bovine serum albumin, 10% normal goat serum, 0.3 M glycine and 0.1% Tween 20, for 1h to permeabilize the cells and block non-specific protein- protein interactions.
2x10⁵HDFαfibroblasts were seeded to a Lab-Tek 8-well chamber slides in 500μl media (Thermo Scientific, Rochester, NY) and cultured until 80–90% confluence. After DNA treat- ment the cells were fixed in ice cold methanol at -20°C for 10 min, and then incubated in PBS containing 1% bovine serum albumin, /10% normal goat serum, /0.3 M glycine and in 0.1%
Tween 20, TBS-Tween for 1h to permeabilize the cells and block non-specific protein—protein interactions.
For immunostaining, cells were treated with mouse anti-human monoclonal anti-TLR9 IgG (1:300; ab85860, Abcam, Cambridge, MA, USA), and anti-DNMT3a IgG (1:300; ab13888, Abcam, Cambridge, MA, USA) at 4°C overnight, using HeLa cells as a positive control; anti- cytokeratin 20 (1:200, clone: PCK-26, Dako, Glostrup, Denmark), E-cadherin (1:2, clone:
ECH6, Histopathology Ltd, Pecs, Hungary) using human colonic mucosa as a positive control;
and rabbit anti-NFκB IgG (1:100, GTX102090, Genetex, San Antonio, Texas, USA) using HepG2 cells as a positive control.
Sections were incubated for 30 min with peroxidase-labeled polymer-horseradish peroxi- dase (HRP) conjugated to goat anti-mouse/rabbit immunoglobulins (Envision + System- HRP-DAB; Dako, Glostrup, Denmark). Staining was completed by incubation with
3,30diaminobenzidine chromogen solution (chromogen solution is part of Envision kit). The sections were counterstained with hematoxylin.
ICC evaluation
Slides were digitalized using a high resolution Panoramic Scan instrument (3DHistech Ltd., Hungary) and analyzed with the Panoramic Viewer Histoquant Module software (3DHistech Ltd., Hungary). 1000 cells/slide were evaluated. In the case of E-cadherin, CK20, cytoplasmic immunoreactions were scored as negative (-), weak (+), moderate (++) and strong (+++).
NFκB, DNMT3a nuclear/cytoplasmic expressions were scored as negative (-), weak (+), mod- erate (++) and strong (+++) immunoreactions. The density of negative (-), weak (+), moderate (++) and strong positive (+++) pixels in immunoreactive cells was evaluated.
Results
Effect of normal and malignant epithelial DNA to HT-29 cells
First, we treated the HT-29 cells with DNA isolated from normal or tumor tissue. Both treat- ments induced mRNA overexpression of metallothionein genes (i.e. MT1H, MT1G, MT1X, MT1P2 and MT2A) (metallothionein 1H, -1G, -1X, -1P2, -2A) (Fig 1A and 1B). Tumor tissue derived DNA treatment resulted in significant overexpression of n = 118 genes (at the mRNA level). Among these genes, we observed metastasis associated genes e.g., tumor biomarker CEACAM5 (carcinoembryonic antigen-related cell adhesion molecule 5), metabolic genes e.g.
INSIG1 (insulin induced gene 1) LIPG (endothelial lipase) and messenger molecule genes DAPP1(dual adaptor of phosphotyrosine and 3-phosphoinositides), CREB3L2 (cAMP respon- sive element binding protein 3-like 2) (Table 2)
A complete list of regulated genes is available at (http://www.ncbi.nlm.nih.gov/geo) with accession number GSE67557.
Analysis of 12 elements of TLR9 pathway in HT-29 cells by qRT
—PCR
In HT-29 cells either tumor and healthy colon tissue derived DNA significantly affected the expression of IL-1βgene related to PBS treated controls. The overexpression of this gene was higher after tumor tissue derived DNA treatment (log Fc 2.33; p0.05), than in samples treated with normal DNA (log Fc 1.59; p0.05) related to untreated controls (Fig 2A and 2B).Cell viability assays
The results of trypan blue exclusion test reflected that tumor cell free DNA treatment signifi- cantly increased living cell number in the relation to control group (av. 54.22±3.03 vs. 42.00
±3.78; p0.05). We also detected significantly decreased number of living cells in normal DNA treated group related to control group (av. 28.67±3.08 vs. 42.00±3.78; p0.05); (Fig 3A and 3B).
The PI cell cycle analysis showed significantly higher living cell population (G1+S+G2+M phase) in tumor DNA treated group vs. control group (av. 39.11±0.57 vs. 32.00±2.50; p0.05).
Fig 1. Heat map representing RNA expression changes in control HT-29 cells and HT-29 cells treated with DNA isolated from healthy(A) and tumorous(B) colonic epithelium.
doi:10.1371/journal.pone.0131699.g001
Table 2. Significant gene expression changes after tumor tissue-originated DNA treatment in HT-29 cells.
Role in tumorigenesis Gene symbols References
metastasis associated genes MACC1, MALAT1, TACSTD2 [31],[32],[29]
tumor biomarker CEACAM5 [30]
metabolic genes INSIG1, LIPG [31,32]
messenger molecule genes DAPP, CREB3L2 [33]
Normal DNA treatment did not affected the cell cycle of counted cells, but we observed a lower cell count in normal DNA treated samples (Fig 3C).
Effect of normal and malignant epithelial DNA on fibroblast cells
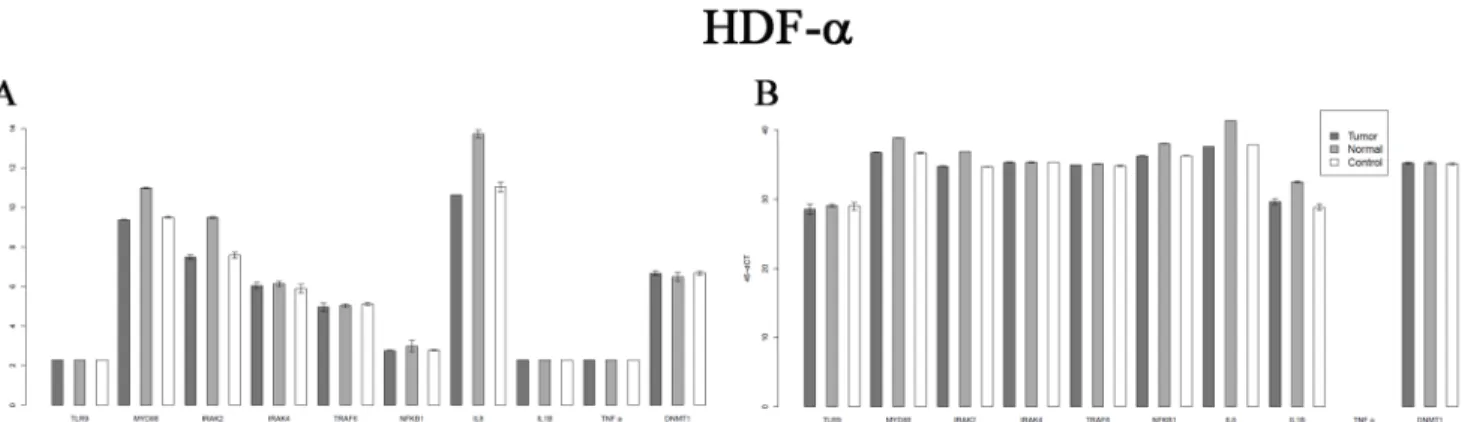
Treatment of HDFαfibroblasts with normal DNA resulted in overexpression of many genes in the TLR9 MYD88 pathway, cytokines, chemokines, growth factors, apoptosis related genes, and prostaglandins. In total, DNA from normal colon tissue resulted in a significant expression change for n = 613 genes (Fig 4A). In contrast, treatment with tumor tissue-derived DNA affected the expression of only n = 12 genes (Fig 4B).
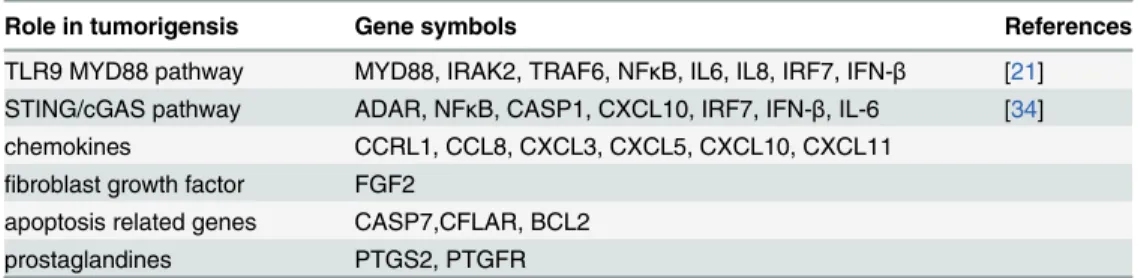
Important gene expression changes induced by healthy tissue originated DNA treatment in HDFαcells are summarized inTable 3. The cell free DNA induced the upregulation of chemo- kine ligands as chemotactic factors, prostaglandins and receptors for prostaglandines in addi- tion to the DNA sensing pathways.
Following tumor DNA treatment of HDFαfibroblasts, we observed no overexpression of the elements of TLR9 pathway, chemokines, growth factors, apoptosis related genes, prosta- glandines and receptors for prostaglandines.
A complete list of regulated genes is available at (http://www.ncbi.nlm.nih.gov/geo) with accession number GSE67557.
Fig 2. Expression changes of TLR9 MYD88 dependent pathway genes on Affymetrix U 133 2.0 microarray in control, normal and tumorous DNA treated samples(A) Figure and q RT-PCR analysis of TLR9 MYD88 dependent pathway of HT-29 cells(B).
doi:10.1371/journal.pone.0131699.g002
Fig 3. Number of living(A) and dead(B) HT-29 cells determined by Trypan blue exclusion test; PI cell-cycle analysis of HT-29 colon cancer cells(C).
doi:10.1371/journal.pone.0131699.g003
Analysis of 12 elements of TLR9 pathway in fibroblasts by qRT-PCR
Five genes of canonical TLR9 pathway (IRAK2, MYD88, NFKB, IL-8, IL-1β) showed signifi- cant overexpression after the treatment with normal tissue derived cell free DNA related to control cells. Tumor tissue derived DNA treatment did not affected the genes of TLR9 MYD88 pathway. (Log Fc1; p0.05); (Fig 5A and 5B).ICC analysis of epithelial differentiation, adhesion and methylation markers
Here we selected three epithelial markers i.e. CK20. E-cadherin, DNMT3a based on our previ- ous results. [28] PBS treated HT-29 cells showed weak membrane CK20 (Fig 6A), E-cadherin (Fig 6D) and weak/moderate cytoplasmic DNMT3a (Fig 6G) protein expression. Tumor DNA treatment induced increase in expression of CK20 strong positive (+++) pixels, (Fig 6C) E- cadherin weak (+) and moderate (++) positive pixels (Fig 6F) and DNMT3a weak (+) positive
Fig 4. Heat map representing RNA expression changes in control HDFαcells and HDF-αcells treated with DNA isolated from healthy (A) and tumorous (B) colonic epithelium.
doi:10.1371/journal.pone.0131699.g004
Table 3. Significant gene expression changes after normal colon tissue-originated DNA treatment in HDFαfibroblasts.
Role in tumorigensis Gene symbols References
TLR9 MYD88 pathway MYD88, IRAK2, TRAF6, NFκB, IL6, IL8, IRF7, IFN-β [21]
STING/cGAS pathway ADAR, NFκB, CASP1, CXCL10, IRF7, IFN-β, IL-6 [34]
chemokines CCRL1, CCL8, CXCL3, CXCL5, CXCL10, CXCL11
fibroblast growth factor FGF2
apoptosis related genes CASP7,CFLAR, BCL2
prostaglandines PTGS2, PTGFR
Fig 5. Expression changes of TLR9 MYD88 dependent pathway genes on Affymetrix U 133 2.0 microarray in control, normal and tumorous DNA treated samples(A) and q RT-PCR analysis of TLR9 MYD88 dependent pathway on HDF alpha cells(B).
doi:10.1371/journal.pone.0131699.g005
Fig 6. CK20 expression in HT-29 colon cancer cells after the treatment by sterile PBS(A), by DNA from normal colon epithelium (B), by DNA from tumorous colon epithelium (C) E-cadherin expression after the treatment by sterile PBS(D), by DNA from normal colon epithelium(E), by DNA from tumorous colon epithelium(F) DNMT3a expression after the treatment by sterile PBS(G), by DNA from normal colon epithelium(h), by DNA from tumorous colon epithelium(I).
doi:10.1371/journal.pone.0131699.g006
pixels (Fig 6I). (p0.05). Tumor DNA promoted CK20 and E-cadherin expression in the non- differentiated, HT—29 colon adenocarcinoma cells both on mRNA and protein level (Table 4, Fig 6C and 6F) (p0.05). DNMT3a protein overexpression correlated with the previous results [28].
ICC analysis of transcription factors and methylation markers in fibroblasts
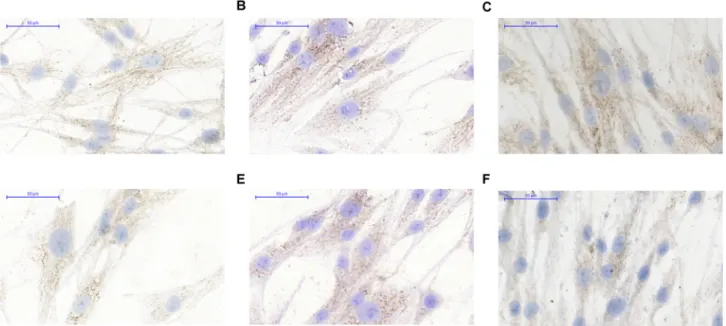
The NF-κB (p65 subunit) reflected weak cytoplasmic / nucleolic expression in PBS treated con- trol fibroblasts (Fig 7D). By the effect of normal tissue DNA (Fig 7E), but not tumor tissue orig- inated DNA, (Fig 7F) the fibroblasts reflected increase in expression of NFκB weak positive pixels (+).
The cytoplasmic DNMT3a expression was on a weak (+), moderate (++) level in normal fibroblasts (Fig 7A). The ratio of weak (+) positive pixels was slightly increased after normal and tumor DNA treatment (Fig 7B and 7C).
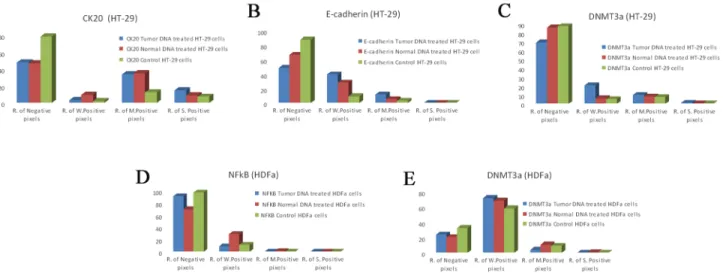
Our immunocytochemical results on HT-29 cells and HDFαfibroblasts are summarized in theFig 8A, 8B, 8C, 8D and 8E.
Table 4. Table representing RNA expression change of CDH1 and KRT 20 after normal and tumor tissue derived DNA treatment.
Probe Set ID Gene Symbol
t-test (Control vs Normal DNA treatment)
t-test (Control vs Tumor DNA treatment)
Log FC (Normal DNA treatment vs Control)
Log FC (Tumor DNA treatment vs Control)
201131_s_at CDH1 0,030924 0,004002 0,25845 0,735174
213953_at KRT20 0,057182 0,007309 0,177712 0,741828
doi:10.1371/journal.pone.0131699.t004
Fig 7. DNMT3a expression in HDF alpha fibroblasts after the treatment by sterile PBS(A), by DNA from normal colon epithelium(B), by DNA from tumorous colon epithelium(C), NFκB expression after the treatment by sterile PBS(D), by DNA from normal colon epithelium(E), by DNA from tumorous colon epithelium(F).
Discussion
The main aim of our work was to examine changes in gene expression following administration of cell free DNA isolated from healthy and tumorous colonic tissue on HT-29 epithelial cells and fibroblasts. We are not aware of any studies that have examined expression changes in the two different cell types cooperating during tumorigenesis or the effect of cell free DNA from different origins. According to recent published studies, bacterial DNA activates DNA sensing receptors, possibly due to the frequency of unmethylated CpG sequences in bacterial genome, which is 20 fold higher than in vertebrates’genome.[35] From further studies it was clear that DNA from pathogenic bacteria upregulate TLR9 expression [15], In the present study we have examined the gene expression changes induced by DNA of tumor origin in cancer cells, by whole genome array. This approach is similar to that reported by Lee et. al. (2014) who demon- strated the uptake, incorporation and effect of this tumor tissue originated DNA on cell prolif- eration.[13]
Our gene expression results are confirmed align with observations in recent publications that demonstrated that intact tumor DNA binds as a ligand to TLR9 but does not result in downstream activation of TLR9 pathway [36]. In our study, our whole genome array results provided evidence that tumorous DNA acts as a pro-metastatic factor independently from the TLR9 and STING pathways by inducing overexpression of metastasis-associated genes (MACC1, MALAT1,TACSTD2), the tumor marker (CEA), metabolic genes (INSIG1, LIPG) and messenger molecule genes (DAPP, CREB3L2). MACC1 is an important pro-metastatic factor that showed significant overexpression following treatment with tumor DNA. This gene is closely associated with the alterations of expressions of cell cycle- and invasion-related pro- teins.[37] Our results reflecting overexpression of other important pro—metastatic genes (MACC1, MALAT1, TACSTD2) are confirmed by previous data reflecting the major role of these genes in metastasis and their association with poor prognosis in various human epithelial cancers.[29,37,38]
Tumor tissue derived DNA treatment affected INSIG 1 and LIPG expression. These two key elements of endothelial lipid metabolism are also known to be associated with cancer progres- sion. [31,32]Increased LIPG expression was reported as a possible urinary cancer biomarker.
Fig 8. ICC evaluation of CK20(A), E-cadherin(B) and DNMT3a(C) on HT-29 colon cancer cells and NFκB(D) and DNMT3a(E) in HDF alpha fibroblasts.
doi:10.1371/journal.pone.0131699.g008
[32] Studies described increased expression of secondary messenger molecules (DAPP, CREB3L2) in colon cancer with the growth and invasion of colon cancer cells via PI3K/AKT pathway activation.[33]
We observed that treatment with tumor DNA also results in overexpression of cytokeratin 20, and E-cadherin which was validated both at the RNA (Table 4) and the protein level (Fig 6C and 6F). E-cadherin as a very important factor regulating cell—cell interaction also showed higher expression in HT-29 cells treated with tumor DNA. E-cadherin overexpression leads to the suppression ofβ-catenin-Tcf/Lef-dependent transcription and likely inhibits cell apoptosis. [39]
DNA methylation changes mediated by DNMT3a are characteristic of colon cancers. Re- expression of factors targeting DNMT3a expression significantly decreased tumor growth.
DNMT3a overexpression after treatment with tumor DNA infers a potential connection between the methylation status of tumor tissue derived DNA and the mechanism of action of tumor tissue derived DNA sequences acting through DNA sensing receptors. Former studies highlight a crucial role of this enzyme in colorectal cancer formation.[40]
Colon cancer tissue is not isolated, but with its cellular milieu through chemokines, cyto- kines, growth and apoptosis signals is communicating with other tissues. Studies have exam- ined the role of the normal and cancer associated fibroblasts (CAFs) in colorectal cancer and showed that CAFs co-cultured with epithelial cells increases the tumor growth [41], but they do not determine the role of normal fibroblasts separately in tumorigenesis. Our aim was to determine the reaction of normal fibroblasts around the epithelial crypts to the released DNA and to screen the pathways included in that process.
In normal fibroblast treatment with DNA from normal tissue caused activation of the TLR9 canonic pathway, as qRT-PCR revealed overexpression of many genes involved in TLR9 MYD88 dependent pathway (MYD88, IRAK2, NFκB, IL-8, IL-1β).
From whole genome microarray analysis results we can conclude that healthy DNA in fibro- blast is not only recognized by TLR9 MYD 88 dependent pathway, but we found that the ele- ments of STING-dependent cytosolic pathway also showed significant overexpression, which initiates IFN production. Using the KEGG pathway map (http://www.genome.jp/kegg-bin/
show_pathway?hsa04623+340061) 4 genes (ADAR, IRF7, CXCL10, CASP1) from the STING pathway showed significant overexpression after the treatment with healthy DNA in HDF-α fibroblasts. This activated cGAS/STING-dependent DNA sensing pathway induced overex- pression of interferon regulatory factors IRF1, IRF2, IRF7, IRF9. and induced increased expres- sion of interferon receptor genes (IFNAR2, IFNGR2). (log FC1, p0.05) The overexpression of CASP1 and NLRC 5 suggest NLRC5-dependent activation of the inflammasome. Davis et.
al. published that NLRC5 cooperates with NLRP3and RNA interference-mediated knockdown of NLRC5 nearly eliminated caspase 1 activity. [42]
NFκB as a transcription regulatory factor showed significant overexpression in the fibro- blasts treated by normal DNA. (Fig 7E) It shows that cell free DNA induced NFκB transloca- tion regulating the release of pro-inflammatory cytokines and growth factors.
Whole genome microarray analysis showed a strikingly different number of genes regulat- ing healthy and tumor tissue derived DNA administration (613 and 12 genes, respectively).
While healthy DNA activated DNA sensing systems and upregulated many genes for cyto- kines, chemokines, growth factors, apoptosis related genes, prostaglandins, tumor DNA affected only few genes, that do not involve in this regulating processes. We think that normal fibroblasts do not react to tumor DNA and a long-term cancer-fibroblast interaction could ini- tiate a transformation of normal fibroblasts to carcinoma-associated fibroblasts supporting
“metastatic”phenotype.
Our study points the possible metastasis promoting effect of the tumor originated DNA via TLR9 independent pathway due to the overexpression of metastasis associated genes, meta- bolic genes and signaling pathways driving promoting cancer cell invasion. Differences in the physical properties of DNA isolated from tumor versus normal tissue suggests different mecha- nism of action in non-malignant and cancer cells through the activation of different pathways.
Recently published works highlight that during the oncogenic transformation, in addition to changes in methylation status, other structural changes are observed, including changes in the expression of oncogenes and tumor suppressor genes, aberrant microsatellites, and rearranged chromosomal DNA incorporation to host cells genome.[13] Based on the tumor promoting effect the cf—DNA it´s degradation could be a possible therapeutical target achieved by DNAse treatment.[5]
Acknowledgments
We thank Gabriella Kónya (Cell Analysis Laboratory, 2nd Department of Medicine, Semmel- weis University, Budapest, Hungary) for preparing immunostainings and Renáta Kis (3DHis- tech Ltd) for performing slide digitalization. We would like to thank Marica Csorba and Noémi Nagy (1st Department of Pathology and Experimental Cancer Research, Semmelweis University, Budapest, Hungary) for their technical assistance in cell culture experiments. We thank Theo deVos, Ph. D. and. Nha NH Le, MD for language revision. This study was sup- ported by Research and Technology Innovation Fund, Hungary, KMR_12-1-2012-0216 to BM and Hungarian Scientific Research Fund (OTKA-K111743 grant) to ZT.
Author Contributions
Conceived and designed the experiments: IF BM SS ZT. Performed the experiments: IF SS AK BB AS. Analyzed the data: IF BW. Contributed reagents/materials/analysis tools: BM ZT.
Wrote the paper: IF BM. Preparing immunostainings: GK. Slide digitalization: RK. Assistance in cell culture experiments: MC.
References
1. Vaisanen MR, Vaisanen T, Jukkola-Vuorinen A, Vuopala KS, Desmond R, Selander KS, et al. Expres- sion of toll-like receptor-9 is increased in poorly differentiated prostate tumors. The Prostate. 2010;
70(8):817–24. doi:10.1002/pros.21115PMID:20054821.
2. Aggarwal SK, Wagner RW, McAllister PK, Rosenberg B. Cell-surface-associated nucleic acid in tumori- genic cells made visible with platinum-pyrimidine complexes by electron microscopy. Proceedings of the National Academy of Sciences of the United States of America. 1975; 72(3):928–32. PMID:48252;
PubMed Central PMCID: PMC432435.
3. Juckett DA, Rosenberg B. Actions of cis-diamminedichloroplatinum on cell surface nucleic acids in can- cer cells as determined by cell electrophoresis techniques. Cancer research. 1982; 42(9):3565–73.
PMID:6286110.
4. Russell JL, Golub ES. Leukemia in AKR mice: a defined suppressor cell population expressing mem- brane-associated DNA. Proceedings of the National Academy of Sciences of the United States of America. 1978; 75(12):6211–4. PMID:366615; PubMed Central PMCID: PMC393149.
5. Wen F, Shen A, Choi A, Gerner EW, Shi J. Extracellular DNA in pancreatic cancer promotes cell inva- sion and metastasis. Cancer research. 2013; 73(14):4256–66. doi:10.1158/0008-5472.CAN-12-3287 PMID:23722544; PubMed Central PMCID: PMC3777608.
6. Barrat FJ, Meeker T, Gregorio J, Chan JH, Uematsu S, Akira S, et al. Nucleic acids of mammalian origin can act as endogenous ligands for Toll-like receptors and may promote systemic lupus erythematosus.
The Journal of experimental medicine. 2005; 202(8):1131–9. doi:10.1084/jem.20050914PMID:
16230478; PubMed Central PMCID: PMC2213213.
7. Furi I, Sipos F, Germann TM, Kalmar A, Tulassay Z, Molnar B, et al. Epithelial toll-like receptor 9 signal- ing in colorectal inflammation and cancer: clinico-pathogenic aspects. World journal of
gastroenterology: WJG. 2013; 19(26):4119–26. doi:10.3748/wjg.v19.i26.4119PMID:23864774;
PubMed Central PMCID: PMC3710413.
8. Pinto A, Morello S, Sorrentino R. Lung cancer and Toll-like receptors. Cancer immunology, immuno- therapy: CII. 2011; 60(9):1211–20. doi:10.1007/s00262-011-1057-8PMID:21789594.
9. Jahr S, Hentze H, Englisch S, Hardt D, Fackelmayer FO, Hesch RD, et al. DNA fragments in the blood plasma of cancer patients: quantitations and evidence for their origin from apoptotic and necrotic cells.
Cancer research. 2001; 61(4):1659–65. PMID:11245480.
10. Diehl F, Li M, Dressman D, He Y, Shen D, Szabo S, et al. Detection and quantification of mutations in the plasma of patients with colorectal tumors. Proceedings of the National Academy of Sciences of the United States of America. 2005; 102(45):16368–73. doi:10.1073/pnas.0507904102PMID:16258065;
PubMed Central PMCID: PMC1283450.
11. Gormally E, Caboux E, Vineis P, Hainaut P. Circulating free DNA in plasma or serum as biomarker of carcinogenesis: practical aspects and biological significance. Mutation research. 2007; 635(2–3):
105–17. doi:10.1016/j.mrrev.2006.11.002PMID:17257890.
12. Chen Z, Fadiel A, Naftolin F, Eichenbaum KD, Xia Y. Circulation DNA: biological implications for cancer metastasis and immunology. Medical hypotheses. 2005; 65(5):956–61. doi:10.1016/j.mehy.2005.04.
042PMID:16054303.
13. Lee TH, Chennakrishnaiah S, Audemard E, Montermini L, Meehan B, Rak J. Oncogenic ras-driven can- cer cell vesiculation leads to emission of double-stranded DNA capable of interacting with target cells.
Biochemical and biophysical research communications. 2014; 451(2):295–301. doi:10.1016/j.bbrc.
2014.07.109PMID:25086355.
14. Barber GN. Cytoplasmic DNA innate immune pathways. Immunological reviews. 2011; 243(1):99–108.
doi:10.1111/j.1600-065X.2011.01051.xPMID:21884170.
15. Ewaschuk JB, Backer JL, Churchill TA, Obermeier F, Krause DO, Madsen KL. Surface expression of Toll-like receptor 9 is upregulated on intestinal epithelial cells in response to pathogenic bacterial DNA.
Infection and immunity. 2007; 75(5):2572–9. doi:10.1128/IAI.01662-06PMID:17325049; PubMed Central PMCID: PMC1865769.
16. Li J, Huang Q, Zeng F, Li W, He Z, Chen W, et al. The prognostic value of global DNA hypomethylation in cancer: a meta-analysis. PloS one. 2014; 9(9):e106290. doi:10.1371/journal.pone.0106290PMID:
25184628; PubMed Central PMCID: PMC4153632.
17. Ilvesaro JM, Merrell MA, Swain TM, Davidson J, Zayzafoon M, Harris KW, et al. Toll like receptor-9 ago- nists stimulate prostate cancer invasion in vitro. The Prostate. 2007; 67(7):774–81. doi:10.1002/pros.
20562PMID:17373717.
18. Merrell MA, Ilvesaro JM, Lehtonen N, Sorsa T, Gehrs B, Rosenthal E, et al. Toll-like receptor 9 agonists promote cellular invasion by increasing matrix metalloproteinase activity. Molecular cancer research:
MCR. 2006; 4(7):437–47. doi:10.1158/1541-7786.MCR-06-0007PMID:16849519.
19. Zhang Y, Wang Q, Ma A, Li Y, Li R, Wang Y. Functional expression of TLR9 in esophageal cancer.
Oncology reports. 2014; 31(5):2298–304. doi:10.3892/or.2014.3095PMID:24647486.
20. Sha HL, Ouyang WX, Lu G. [Expression and clinical significance of TLR9 in ovarian cancer]. Zhonghua zhong liu za zhi [Chinese journal of oncology]. 2010; 32(12):913–6. PMID:21223799.
21. Gonzalez-Reyes S, Marin L, Gonzalez L, Gonzalez LO, del Casar JM, Lamelas ML, et al. Study of TLR3, TLR4 and TLR9 in breast carcinomas and their association with metastasis. BMC cancer. 2010;
10:665. doi:10.1186/1471-2407-10-665PMID:21129170; PubMed Central PMCID: PMC3009680.
22. Woo SR, Fuertes MB, Corrales L, Spranger S, Furdyna MJ, Leung MY, et al. STING-dependent cyto- solic DNA sensing mediates innate immune recognition of immunogenic tumors. Immunity. 2014;
41(5):830–42. doi:10.1016/j.immuni.2014.10.017PMID:25517615.
23. Abe T, Harashima A, Xia T, Konno H, Konno K, Morales A, et al. STING recognition of cytoplasmic DNA instigates cellular defense. Molecular cell. 2013; 50(1):5–15. doi:10.1016/j.molcel.2013.01.039 PMID:23478444; PubMed Central PMCID: PMC3881179.
24. Wu J, Sun L, Chen X, Du F, Shi H, Chen C, et al. Cyclic GMP-AMP is an endogenous second messen- ger in innate immune signaling by cytosolic DNA. Science. 2013; 339(6121):826–30. doi:10.1126/
science.1229963PMID:23258412; PubMed Central PMCID: PMC3855410.
25. Temizoz B, Kuroda E, Ohata K, Jounai N, Ozasa K, Kobiyama K, et al. TLR9 and STING agonists syn- ergistically induce innate and adaptive type-II IFN. European journal of immunology. 2014. doi:10.
1002/eji.201445132PMID:25529558.
26. Bronte V. Tumors STING adaptive antitumor immunity. Immunity. 2014; 41(5):679–81. doi:10.1016/j.
immuni.2014.11.004PMID:25517609.
27. Deng L, Liang H, Xu M, Yang X, Burnette B, Arina A, et al. STING-Dependent Cytosolic DNA Sensing Promotes Radiation-Induced Type I Interferon-Dependent Antitumor Immunity in Immunogenic Tumors. Immunity. 2014; 41(5):843–52. doi:10.1016/j.immuni.2014.10.019PMID:25517616.
28. Furi I, Sipos F, Spisak S, Kiszner G, Wichmann B, Scholler A, et al. Association of self-DNA mediated TLR9-related gene, DNA methyltransferase, and cytokeratin protein expression alterations in HT29- cells to DNA fragment length and methylation status. TheScientificWorldJournal. 2013; 2013:293296.
doi:10.1155/2013/293296PMID:24459426; PubMed Central PMCID: PMC3891537.
29. Xia Y, Li B, Gao N, Xia H, Men Y, Liu Y, et al. Expression of tumor-associated calcium signal transducer 2 in patients with salivary adenoid cystic carcinoma: Correlation with clinicopathological features and prognosis. Oncology letters. 2014; 8(4):1670–4. doi:10.3892/ol.2014.2400PMID:25202389; PubMed Central PMCID: PMC4156178.
30. Blumenthal RD, Hansen HJ, Goldenberg DM. Inhibition of adhesion, invasion, and metastasis by anti- bodies targeting CEACAM6 (NCA-90) and CEACAM5 (Carcinoembryonic Antigen). Cancer research.
2005; 65(19):8809–17. doi:10.1158/0008-5472.CAN-05-0420PMID:16204051.
31. Konig B, Koch A, Spielmann J, Hilgenfeld C, Hirche F, Stangl GI, et al. Activation of PPARalpha and PPARgamma reduces triacylglycerol synthesis in rat hepatoma cells by reduction of nuclear SREBP-1.
European journal of pharmacology. 2009; 605(1–3):23–30. PMID:19248225.
32. Dong XY, Wang GQ, Zhang GQ, Ni ZH, Suo J, Cui J, et al. The endothelial lipase protein is promising urinary biomarker for diagnosis of gastric cancer. Diagn Pathol. 2013; 8. Artn 45 doi:10.1186/1746- 1596-8-45PMID:WOS:000317238900001.
33. Zhu Z, Zhang X, Guo H, Fu L, Pan G, Sun Y. CXCL13-CXCR5 axis promotes the growth and invasion of colon cancer cells via PI3K/AKT pathway. Molecular and cellular biochemistry. 2015; 400(1–2):
287–95. doi:10.1007/s11010-014-2285-yPMID:25476740.
34. Ahn J, Konno H, Barber GN. Diverse roles of STING-dependent signaling on the development of can- cer. Oncogene. 2015. doi:10.1038/onc.2014.457PMID:25639870.
35. Krieg AM, Yi AK, Matson S, Waldschmidt TJ, Bishop GA, Teasdale R, et al. CpG motifs in bacterial DNA trigger direct B-cell activation. Nature. 1995; 374(6522):546–9. doi:10.1038/374546a0PMID:
7700380.
36. Tuomela J, Sandholm J, Kaakinen M, Patel A, Kauppila JH, Ilvesaro J, et al. DNA from dead cancer cells induces TLR9-mediated invasion and inflammation in living cancer cells. Breast cancer research and treatment. 2013; 142(3):477–87. doi:10.1007/s10549-013-2762-0PMID:24212717; PubMed Central PMCID: PMC4238912.
37. Cui Z, Tang J, Chen J, Wang Z. Hsa-miR-574-5p negatively regulates MACC-1 expression to suppress colorectal cancer liver metastasis. Cancer cell international. 2014; 14:47. doi:10.1186/1475-2867-14- 47PMID:24936152; PubMed Central PMCID: PMC4059478.
38. Yang MH, Hu ZY, Xu C, Xie LY, Wang XY, Chen SY, et al. MALAT1 promotes colorectal cancer cell proliferation/migration/invasion via PRKA kinase anchor protein 9. Biochimica et biophysica acta.
2015; 1852(1):166–74. doi:10.1016/j.bbadis.2014.11.013PMID:25446987; PubMed Central PMCID:
PMC4268411.
39. Torres VA, Tapia JC, Rodriguez DA, Lladser A, Arredondo C, Leyton L, et al. E-cadherin is required for caveolin-1-mediated down-regulation of the inhibitor of apoptosis protein survivin via reduced beta- catenin-Tcf/Lef-dependent transcription. Molecular and cellular biology. 2007; 27(21):7703–17. doi:10.
1128/MCB.01991-06PMID:17785436; PubMed Central PMCID: PMC2169068.
40. Ng EK, Tsang WP, Ng SS, Jin HC, Yu J, Li JJ, et al. MicroRNA-143 targets DNA methyltransferases 3A in colorectal cancer. British journal of cancer. 2009; 101(4):699–706. doi:10.1038/sj.bjc.6605195 PMID:19638978; PubMed Central PMCID: PMC2736825.
41. Zhu Y, Zhu M, Lance P. IL1beta-mediated Stromal COX-2 signaling mediates proliferation and inva- siveness of colonic epithelial cancer cells. Experimental cell research. 2012; 318(19):2520–30. doi:10.
1016/j.yexcr.2012.07.021PMID:22884582.
42. Davis BK, Roberts RA, Huang MT, Willingham SB, Conti BJ, Brickey WJ, et al. Cutting edge: NLRC5- dependent activation of the inflammasome. Journal of immunology. 2011; 186(3):1333–7. doi:10.
4049/jimmunol.1003111PMID:21191067; PubMed Central PMCID: PMC3669680.