RESEARCH
Early response of methanogenic archaea to H 2 as evaluated by metagenomics
and metatranscriptomics
Balázs Kakuk1,2, Roland Wirth2,3, Gergely Maróti3, Márk Szuhaj2, Gábor Rakhely2,4, Krisztián Laczi2, Kornél L. Kovács2,5* and Zoltán Bagi2*
Abstract
Background: The molecular machinery of the complex microbiological cell factory of biomethane production is not fully understood. One of the process control elements is the regulatory role of hydrogen (H2). Reduction of carbon dioxide (CO2) by H2 is rate limiting factor in methanogenesis, but the community intends to keep H2 concentration low in order to maintain the redox balance of the overall system. H2 metabolism in methanogens becomes increas- ingly important in the Power-to-Gas renewable energy conversion and storage technologies.
Results: The early response of the mixed mesophilic microbial community to H2 gas injection was investigated with the goal of uncovering the first responses of the microbial community in the CH4 formation and CO2 mitiga- tion Power-to-Gas process. The overall microbial composition changes, following a 10 min excessive bubbling of H2 through the reactor, was investigated via metagenome and metatranscriptome sequencing. The overall composi- tion and taxonomic abundance of the biogas producing anaerobic community did not change appreciably 2 hours after the H2 treatment, indicating that this time period was too short to display differences in the proliferation of the members of the microbial community. There was, however, a substantial increase in the expression of genes related to hydrogenotrophic methanogenesis of certain groups of Archaea. As an early response to H2 exposure the activity of the hydrogenotrophic methanogenesis in the genus Methanoculleus was upregulated but the hydrogenotrophic pathway in genus Methanosarcina was downregulated. The RT-qPCR data corroborated the metatranscriptomic Results: H2 injection also altered the metabolism of a number of microbes belonging in the kingdom Bacteria. Many Bacteria possess the enzyme sets for the Wood-Ljungdahl pathway. These and the homoacetogens are partners for syntrophic community interactions between the distinct kingdoms of Archaea and Bacteria.
Conclusions: External H2 regulates the functional activity of certain Bacteria and Archaea. The syntrophic cross-king- dom interactions in H2 metabolism are important for the efficient operation of the Power-to-Gas process. Therefore, mixed communities are recommended for the large scale Power-to-Gas process rather than single hydrogenotrophic methanogen strains. Fast and reproducible response from the microbial community can be exploited in turn-off and turn-on of the Power-to-Gas microbial cell factories.
Keywords: Hydrogen, Biomethane, Anaerobic digestion, Methanogenesis, Hydrogenotrophic methanogens, Metagenome, Metatranscriptome, Renewable energy, Power-to-Gas
© The Author(s) 2021. This article is licensed under a Creative Commons Attribution 4.0 International License, which permits use, sharing, adaptation, distribution and reproduction in any medium or format, as long as you give appropriate credit to the original author(s) and the source, provide a link to the Creative Commons licence, and indicate if changes were made. The images or other third party material in this article are included in the article’s Creative Commons licence, unless indicated otherwise in a credit line to the material. If material is not included in the article’s Creative Commons licence and your intended use is not permitted by statutory regulation or exceeds the permitted use, you will need to obtain permission directly from the copyright holder. To view a copy of this licence, visit http:// creat iveco mmons. org/ licen ses/ by/4. 0/. The Creative Commons Public Domain Dedication waiver (http:// creat iveco mmons. org/ publi cdoma in/
zero/1. 0/) applies to the data made available in this article, unless otherwise stated in a credit line to the data.
Open Access
*Correspondence: kovacs.kornel@bio.u-szeged.hu;
bagi.zoltan@bio.u-szeged.hu
2 Department of Biotechnology, University of Szeged, Szeged, Hungary Full list of author information is available at the end of the article
Background
Anaerobic digestion (AD) of organic wastes and by- products by specialized microbial communities and the concomitant biogas production is an environmen- tally attractive bioenergy production technology. In the context of climate change, the generation of biogas as a renewable energy form has become popular and inten- sively examined over the last few decades [1].
Biogas provides environmental benefits with regard to waste treatment, pollution reduction, production of CO2-neutral renewable energy and the improvement of economy of agricultural practices through the recycling of plant nutrients and replacing artificial fertilizers [2].
Biogas can be burnt to produce heat or combusted in gas engines for electricity generation and, after purifica- tion, it can be used in any application for which fossil fuel natural gas is utilized today [3]. AD is applicable to a wide range of waste streams derived from the agro-food indus- try, which is a source of vast amounts of readily degra- dable organic material composed mainly of complex organic molecules, as well as in liquid or solid communal waste treatments.
While the main microorganisms and mechanisms involved in the methane producing anaerobic micro- bial cell factories are fairly well-known, the regulation and management of the overall process is far from being fully understood [4, 5]. Despite the industrial-economic importance of the underlying microbiological events, lit- tle is known about the roles, networking interactions of the microorganisms and the regulatory mechanisms of the methane production. Therefore, the microbiological events representing the bottlenecks of the process are difficult to manage. AD demands the concerted action of a complex community of microbes, each member per- forming their special role in the overall degradation pro- cess [6, 7]. In the absence of terminal electron acceptors such as nitrate, oxygen or sulfate, the methanogenic con- version of organic matter is an essential feature of many ecosystems [8].
H2 metabolism is one of the most important rate-lim- iting processes in methanogenesis. H2-coupled electron transfer has been verified as an important extracellu- lar pathway of sharing reducing equivalents within the anaerobic environment, especially in microbial elec- trosynthesis systems [9].
H2 conversion is performed at molecular level by the class of enzymes called hydrogenases. Several hydroge- nases have been identified in methanogenic archaea their brief overview is appropriate here. The series of reac- tions involved in methane (CH4) formation from H2 and carbon-dioxide (CO2) are initiated by the formylmetha- nofuran dehydrogenase. This enzyme catalyzes the for- mation of N-carboxymethanofuran from methanofuran
and CO2 [10]. The electrons from H2 are first taken up by coenzyme F420, which is embedded in the enzyme F420-dependent hydrogenase. The reduced coenzyme F420 is the central electron carrier in methanogenic archaea.
Other hydrogenases from methanogens cannot reduce F420 [11]. Methanogenesis from formate involves oxi- dation of the substrate to produce CO2 and a reduced electron carrier. The reaction is catalyzed by a formate dehydrogenase [12]. A novel hydrogenase (Ech) was dis- covered in acetate-grown cells of Methanosarcina bark- eri, which shows sequence homologies to hydrogenases 3 and 4 of Escherichia coli and to the CO-induced hydroge- nase from Rhodospirillum rubrum. The purified enzyme from Ms. barkeri catalyzed the H2-dependent reduction of a 2[4Fe-4S] ferredoxin and is also able to perform the reverse reaction, namely, H2 formation from reduced ferredoxin [13]. Some hydrogenases are components of the H+-translocating system in methanogens [14]. The effect of H2 on the expression of genes coding for hydro- genases and other methanogenesis genes has not been systematically examined yet. It is astonishing to note the complexity of the molecular machinery, which handles the simplest molecule, H2. The exploration of the molec- ular networks, which affect the expression of these genes could improve our extended knowledge concerning molecular redox mechanisms in microbial cell factories.
AD is one of the most promising among the various biomass conversion processes. The regulatory roles of the H2 levels have been recognized as a significant ele- ment in the concerted action of the complex microbial community [14, 15]. We demonstrated earlier that by the introduction of H2-producing bacteria into a natu- ral biogas-generating consortium appreciably increased the efficacy of biogas production both in batch fermen- tations and in scaled-up continuous AD [14]. One of the rate-limiting factors of AD is the actual level of H2 in the system [16]. The presence of excessive amounts of H2 inhibits the activity of the acetogenic bacteria that gener- ate H2 in the system, whereas limiting H2 levels have an adverse effect on an important group of methane pro- ducing Archaea, the hydrogenotrophic methanogens. In natural ecosystems, a very low partial pressure of H2 is maintained, which may be a limiting factor for the meth- anogenesis [8, 17]. The relationship between the ace- togens and methanogens is syntrophic, supported by a process called interspecies hydrogen transfer or interspe- cies electron flow [18]. We have only incomplete infor- mation about the detailed mechanism of interspecies hydrogen transfer [19]. The actual H2 concentration has been shown to determine the composition of the metha- nogenic community [20–22]. The expression of up to 10%
of the total proteins in a hydrogenotrophic methanogen were reported to change in response to H2 limitation
[23], indicating that the H2 availability is sensed by the methanogens and this gas has a major effect on their physiology.
Metagenomic analyses offer a new toolbox for the investigation of the complex microbial cell factories. The reconstruction of the genomes (metagenome assembled genomes: MAGs) of the individual members of a com- plex microenvironment and their subsequent functional and phylogenetic analysis is termed genome-centric metagenomics [24, 25]. Genome-centric metagenomics (referred to as MG hereafter) already yielded valuable insights into the functional organization of biogas reac- tors and the microbial cell factories operating within [26, 27]. Additionally, its combination with metatranscrip- tomics (the analysis of the whole microbial community mRNA in a microenvironment), i.e., genome-centric metatranscriptomics (referred to as MTR, hereafter) enables the examination of the gene expression of each individual MAG, has been used for the in-depth analysis of the process control, regulation and interactions among the members of these cell factories.
In previous approaches the consequences long-term and/or steady H2 exposure have been investigated [28–
31]. This study is dedicated to unveil the early response of the anaerobic mixed microbial consortium, with spe- cial emphasis on methanogens to the presence of H2 dis- tress. This is a realistic scenario in large scale AD plants due to local concentration gradients as well as in natural environments, e.g. in swamps or rice fields. More impor- tantly, a quick turn-on and turn-off of H2 supply can be expected in the Power-to-Gas technologies, where the fluctuating production of renewable electricity, e.g. by photovoltaic or wind power, is coupled with its biological conversion to biomethane [17, 21]. The central challenge to be understood is the regulatory role of H2 in CH4 for- mation and the early response by the methanogens and other H2-metabolizing microbes, which regulates and balances the fragile bioenergetic processes in AD.
Results Fermentation
A constant value of VOA/TIC is a reliable indicator of a stable mesophilic fermentation process [32]. Each experi- ment started with a 20 days long start-up period in order to adapt the microbial community to the alpha-cellulose substrate. During this period the average VOA and TIC values stabilized at VOA = 1.1 g L−1 and the TIC = 14 g CaCO3 L−1. Because of the relatively low substrate load- ing rate, the VOA/TIC ratios were moderate, which allowed balanced operations. The amount of NH4+ is also an important indicator of AD process stability [33].
Theoretically, levels above 3000 mg NH4+ L−1 may have a negative effect on the methanogenic archaea, which is the
most sensitive group of microbes in the AD process [34].
The NH4+ concentration was below 1000 mg L−1 during the whole fermentation process. The biogas productivity of the digesters was also stable: 650 mLN biogas alpha- cellulose g−1 day−1 were produced with 53% of CH4 con- tent. The first samples for DNA and RNA analysis were taken on day 20 from the stabilized reactors. After sam- pling the digesters were flushed with H2 gas from a gas cylinder for 10 min and 2 h later the second sampling was carried out. This protocol was repeated after 2 months of reactor operation.
The reactors displayed stable operation during the course of the experiment. The daily biomethane produc- tion varied by < 10%. The H2 injection took place on days 15 and 71 (blue dotted arrows in Additional file 1: Figure S1).The reactors responded with a sudden increase in daily CH4 evolution by 20–25% at both time points, which lasted for 1–2 days (Additional file 1: Figure S1). The CH4 content of the biogas was 53% throughout the experi- mental period. Afterwards the reactors returned to their previous biomethane production levels. It is worth not- ing that the microbial community responded exactly the same manner to the H2 spike 2 months apart, which indi- cates the robustness, reproducibility and quick response time by the microbial community. Assuming H2 satura- tion of the liquid phase by the 10 min long H2 bubbling, we estimated that more than 95% of the injected H2 was converted to CH4 by the community within 16–24 h, although the amount of available dissolved H2 decreased rapidly during the second half of the H2 consumption phase. This was in line with the observations of Szuhaj et al. [35], who found in fed-batch H2 feeding experi- ments at much lower scale that the injected H2 was com- pletely consumed in 16–24 h. The H2 injection apparently did not alter markedly the cumulative biomethane pro- duction curve, which showed a straight line throughout the experiment.
Genom‑centric metagenome and metatranscriptome analyses
In the early response of the residing microbial consor- tium to the sudden H2 burst at transcriptome level of metagenome-assembled genomes (MAGs) [36] it was anticipated that the microbial composition and the rela- tive abundances of species did not change substantially within 2 h, i.e., sampling before and after H2 exposure.
An extensive binning procedure became possible as the number of metagenomic samples elevated. Therefore the H2 triggered differences in the gene expression lev- els could be precisely assessed together with associated alterations in cell physiology.
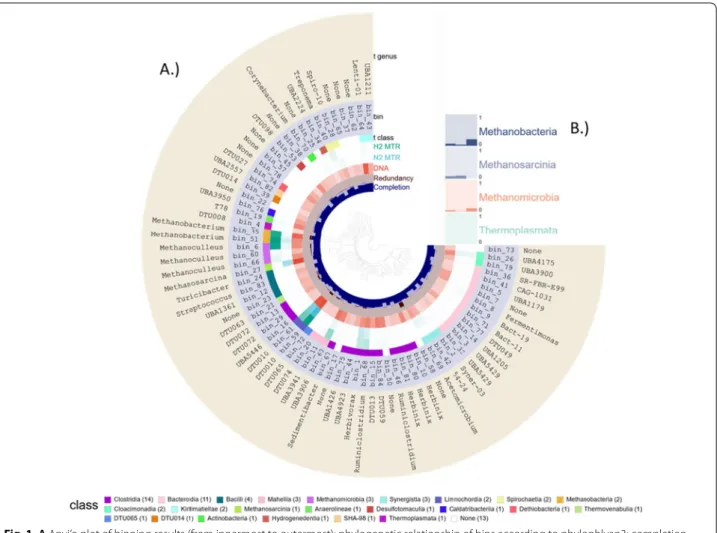
The extensive binning procedure on the co-assembled contigs and read mapping, employing the three metagen- omic binners and the DAS tool, yielded 84 bins. Out of these, 16 were high, 49 were medium and 19 were low quality, according to the MIMAG initiative [36]. 73 bins harbored enough single copy marker genes (SCG) for the phylogenetic tree building (center part in Fig. 1)—the phylogenetic relationship of the remaining 11 bins could not be determined probably because of the low quality of the metagenomes.
The taxonomic assignment of the 84 bins (or MAGs as both of these synonymous expressions will be used in this discussion) resulted in seven Archaea, 61 Bacteria and 16 unclassified bins (details are compiled in Additional file 5:
Table S1). Archaea represented about 10% of the micro- biome. Within the domain Bacteria, most bins (34) were associated with the phylum Firmicutes. The dominance of Firmicutes in biogas reactors is in accordance with
previous studies [8, 26]. This can be attributed to their diverse capability in polysaccharide and oligosaccharide degradation, which is the first step in the AD of complex organic substrates [37].
The second well-represented phylum was Bacterioi- detes (12 bins), all of them belonged in the order Bac- teroidales. Most Bacterioidetes produce succinic acid, acetic acid, and in some cases propionic acid, these mol- ecules fuel the acetotrophic methanogenesis. In addition, representatives of the phyla Synergistota, Spirochaetes, Verrucomicrobia, Cloacimonadota, Fibrobacterota, Cal- datribacteria, and Chloroflexota were identified (Addi- tional file 5: Table S1). The overall microbial landscape is in line with previous studies [8, 26]. A typical micro- bial community flourished in our biogas digesters, which indicated that the synthetic medium containing only cellulose as a carbon source proved to be a good model system for the metatranscriptomic investigations [38].
Fig. 1 A Anvi’o plot of binning results (from innermost to outermost): phylogenetic relationship of bins according to phylophlyan3; completion and redundancy of the bins, according to single-copy marker gene (SCG) content; taxonomic Class and Genus assignment for the bins and relative abundance of bins in samples. The list of Classes at the bottom part indicates the color code and the number of bins in the Classes. B depicts the relative abundance of Archaeal Classes (the summary of bins in the Classes)
This has been corroborated in a comparison of our 84 bins with the MAGs library compiled in Bio-Gas Micro- biome database (https:// micro bial- genom es. org) (Addi- tional file 5: Table S1) [39]. The comparison of the coding sequences, i.e., fasta files, revealed the counterparts of 70 of our 84 MAGs in the Bio-Gas Microbiome database, 56 of the MAGs had more than 95% similarity. The remain- ing bins contained medium or low quality metagenomes, which could be the main reason for not finding more matches. Two high quality bins (bin_1—Herbivorax sac- cincola and bin_35—Methanobacterium sp.) was appar- ently not represented among the nearly 1600 species identified in Bio-Gas Microbiome.
A comparison of the DNA-based omics data clearly indicated that the community compositions were very similar in all four samples (Fig. 2), respectively (Addi- tional file 5: Table S1). The overall Archaea gene abun- dance, i.e., sum of read counts, was 18.49 ± 2.04% in N2-MG or H2-MG samples (each DNA-based). This observation corroborates that (i) all reactors that worked under the same conditions maintained the same micro- bial community; (ii) as expected, the microbial communi- ties did not change perceptibly within 2 h; and (iii) the observations were highly reproducible after 2 months.
In contrast, the mRNA-based metatranscriptome analy- sis showed striking changes in the transcriptome-based community composition when H2 was offered to the reactors’ microbial community. The N2_MTR sam- ples (RNA-based, before H2 addition) showed a simi- lar total Archaea abundance to that of the MG samples:
18.99 ± 11.64%, but this was elevated to 36.53 ± 3.74%
in the case of H2_MTR samples (RNA-based, after H2
addition). This demonstrates a rapid response to the appearance of excess H2.
The elevation of the total number of transcribed Archaea genes (H2_MTR samples) was mainly attrib- uted to representatives of the genus Methanobacterium (bins 35 and 51), which increased from 4.33 to 17.39%
(log2FC = 2.84) of all bins’ abundance. Methanobacte- ria are hydrogenotrophic methanogens. The second major contributor to Archaea transcripts was the order Methanomicrobiales, from 2.69 to 7.03% (log2FC = 2.16).
The genera Methanoculleus and Methanosarcina both belong in this order. The three bins of the genus Metha- noculleus showed elevated overall abundance, the log2FC values of bin_6, bin_60 and bin_66 were 3.64, 2.37 and 2.18, respectively. The increase upon H2 exposure was the most apparent in the case of bin_6. Methanocul- leus_bourgensis, whose proportion increased from 1.65 to 10.66%. Remarkably, the genus Methanosarcina effec- tively ceased to express genes to near zero upon H2 dis- pensation. Methanosarcina are known to possess genes coding for all three methanogenic pathways, i.e., hydrog- enotrophic, acetotrophic and methylotrophic methano- genesis [8, 16]. Members of the genus Methanoculleus are solely hydrogenotrophic methanogens. H2 exposure apparently turns on the activity of the hydrogenotrophic methanogenesis in both Methanoculleus and Methano- bacterium but turns off the hydrogenotrophic pathway in Methanosarcina.
Metatranscriptomic pathways analysis
A community-level pathway enrichment analysis was performed to examine the overall metatranscriptomic
Fig. 2 PCA biplot of the rlog-transformed (regularized-logarithm transformation) total gene expressions, i.e., copy number in the MG sample, of each MAG in each sample
changes that occurred as a result of the H2-addition.
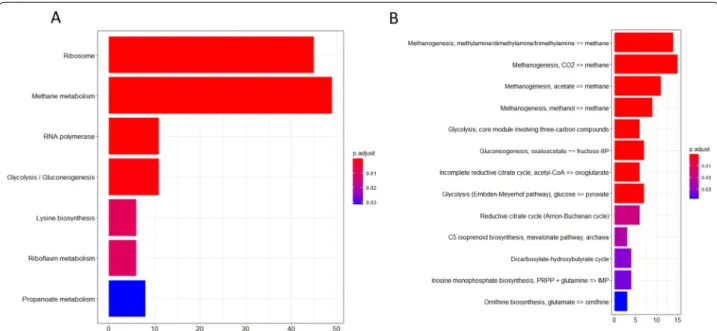
The contig assembly and ORF prediction/annotation workflow yielded 219,353 KEGG Orthology (KO) anno- tated ORFs. Out of these 98,791 ORFs were binned in the refined MAGs. The remaining 120,562 ORFs were used for the community-level pathway analysis. The changes in the expression levels of the genes involved in the various methanogenesis related metabolic path- ways and modules were examined according to KEGG annotation. The results indicated that the methano- genesis pathway was primarily affected as the result of H2 injection (Fig. 3). The upregulation of differentially expressed (DE) genes was the highest in this pathway (48) and in the associated modules. It is noteworthy that some other carbon metabolism associated path- ways were also affected, such as Glycolysis/Gluconeo- genesis and Propanoate metabolism, which suggest that acetogenic and acetate utilizing microbes were also affected by the specifically altered environment. H2 is known to inhibit acetogenic microbes [40], thus their response to the H2 addition is not surprising. The RNA polymerase pathway also changed significantly, this was due to triggered transcription machinery as a response to the altered environment.
Despite the binning efforts, many KEGG annotated genes remained unbinned (Additional file 2: Figure S2).
Omitting these from the downstream analysis would have distorted the pathway and statistical analyses,
therefore we combined them as a group of “unbinned”
genes.
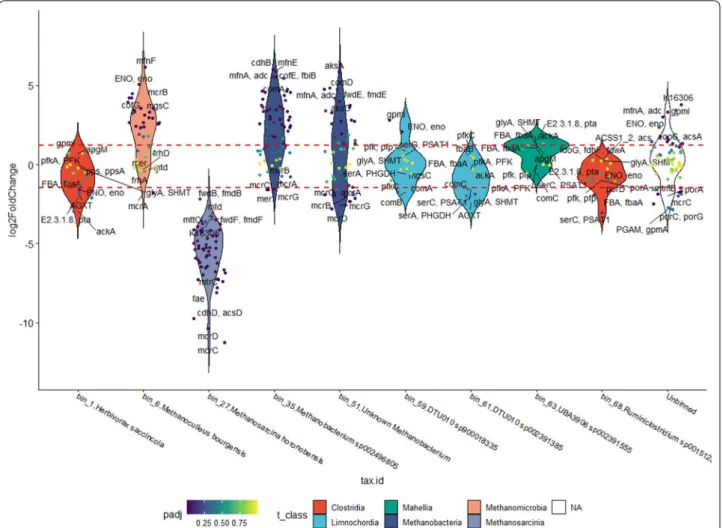
Changes in the expression levels in methanogenesis genes The enrichment analysis revealed that the CH4 metabo- lism was the most affected, hence the contribution of each individual MAGs was examined next to gain a deeper insight to the molecular mechanism. An over- all of 103 genes of the 8 Archaea MAGs from this path- way were down-regulated (log2FC lower than − 2), and 37 that were up-regulated (log2FC higher than 2), but of these only 61 were found to be significantly differentially expressed based on the p-value threshold of 0.05. MAGs harboring more than five KEGG map00680 pathway genes were plotted in Fig. 4.
The two MAGs identified as belonging in the genus Methanobacterium (bin_35 and bin_51) and Methanoc- ulleus (bin_6, bin_60 and bin_66) showed a very similar response (Fig. 4), many of their map00680 genes were expressed at log2FC higher than 2, i.e., four-times higher expression. Two additional Methanoculleus MAGs (bin_60 and bin_66), a low and a medium quality MAG according to CheckM, were identified but not presented in Fig. 4. This implies that several Methanoculleus strains actively participate in the Power-to-Gas (P2G) reaction.
The expression level of numerous genes increased shortly after H2 injection in the hydrogenotrophic strains, which indicated that several metabolic path- ways responded to the increased H2 concentrations.
Fig. 3 A Results of KEGG Module enrichment analysis (left), and B KEGG Pathway (right). The pathways, which were significantly different between N2_MTR and H2_MTR samples are presented. X-axis indicates the number of KEGG IDs found as significantly different in the given pathway (listed along the Y axis). P-adjust stands for corrected p-values
The log2FC values of the genes ENO (phosphopyruvate hydratase, EC 4.2.1.11), COF (7,8-didemethyl-8-hydroxy- 5-deazariboflavin synthase, EC 4.3.1.32), and COM (sul- fopyruvate decarboxylase, EC 4.1.1.79) were the largest in M. bourgensis i.e., 5.06, 4.2 and 1.25, respectively. The ENO enzyme takes part in the biosynthesis of the Coen- zyme B, which is an essential molecule in the final step of the methanogenesis. The COF enzymes are responsi- ble for the synthesis of the other important coenzyme, Coenzyme F420. The COM enzymes catalyze the 3-sul- fopyruvate to 2-sulfoacetaldehyde reaction, which is an intermediate step in the synthesis of the third impor- tant coenzyme, Coenzyme-M [38]. These results clearly suggested that the cells increased the synthesis of all coenzymes, which were involved in methanogenesis to support the quick conversion of H2 and CO2 to CH4.
In the MAGs belonging Methanobacterium strains, the expression level of the enzymes MFN (tyrosine
decarboxylase, EC 4.1.1.25), ADC (aspartate 1-decar- boxylase, EC 4.1.1.11), FMD/FWD (formylmethanofuran dehydrogenase, EC 1.2.99.5), AKS (methanogen homoci- trate synthase, EC 2.3.3.14 2.3.3), COM increased. These enzymes also play an important role in the hydrogeno- troph methanogenesis pathway (Additional file 3: Figure S3). The MFN and ADC enzymes are normally involved in the methanofuran biosynthesis pathway, when they catalyze the l-tyrosine to tyramine reaction. The FMD/
FWD redox enzyme complex contains a molybdopterin cofactor and numerous [4Fe-4S] clusters in order to cata- lyze the reversible reaction the formyl-methanofuran synthesis from methanofuran, which is an important methanogenesis step in CO2 conversion and the oxida- tion of coenzyme-M to CO2. The reaction is endergonic and is driven by coupling the soluble CoB-CoM het- erodisulfide reductase via electron bifurcation. The AKS enzyme also takes part in the synthesis of Coenzyme-B.
Fig. 4 Violin plot of genes (small dots) involved in the methanogenesis KEGG pathway (map00680) in each bin (arranged on the X-axis) and the unbinned gene collection. Only bins, which contain at least are plotted. Filling colors indicate taxonomy at Class level. Each dot represents a KEGG 5 methanogenesis genes orthologue (KO) in the respective bin. Colors of the dots indicate the p-value of the log2FC difference between N2_MTR and H2_MTR samples. Horizontal dashed red lines mark the log2FC thresholds for significantly different KOs (respective p-value < 0.05)
Overall, the results signified that the hydrogeno- trophic methanogenic cells activated a large number of the key enzymes in the methanogenesis pathway to consume more effectively the H2 from the environment.
It is noteworthy that the genes of the MCR enzymes (methyl-coenzyme M reductase, EC 2.48.4.1.) showed lower expression in all hydrogenotrophic bins. The MCR enzymes (methyl-coenzyme M reductase) catalyze the final step of the methanogenesis (Additional file 3: Fig- ure S3). One of the possible considerations explaining this observation could have been that 2 h was not enough for redirecting this section of methanogenesis pathways.
If the local substrate availability did not increase signifi- cantly, the cells did not need to increase the transcrip- tional activity of the MCR enzymes (Additional file 4:
Figure S4).
Almost all genes in Methanosarcina honoroben- sis showed decreased expression in the presence of H2
(Fig. 4). This strain has been described as acetotrophic, which also grew on methanol, dimethylamine, trimeth- ylamine, dimethylsulfide and acetate but not on mono- methylamine, H2/CO2, formate, 2-propanol, 2-butanol or cyclopentanol [41]. The expression levels of MCR, ACS (acetyl-CoA decarbonylase/synthase, EC 3.1.2.1) and FAE (5,6,7,8-tetrahydromethanopterin hydro-lyase,
EC 4.2.1.147) significantly decreased. The ACS enzyme is responsible for the conversion of acetate to acetyl- CoA, which is a typical step in the acetotrophic metha- nogenesis pathway. The next enzyme, FAE generates 5,10-methylene tetrahydromethanopterin (5,10-Methyl- ene-THMPT) from formaldehyde, an important interme- diate of methanogenesis.
The substantial decrease in the transcriptional response of M. honorobensis to H2 injection corroborated that this strain is unable to utilize H2 and signaled an active inhibi- tory role of H2 on acetotrophic methanogenesis. This implicates a hitherto unrecognized tight regulatory role of H2 on diverse pathways coupled to methanogenesis (Fig. 4).
qPCR validation of the transcriptomic data
Eleven genes were selected for testing the metatranscrip- tomic data by Real-Time quantitative polymerase chain reaction (RT-qPCR). The genes were selected to cover a broad range of genes displaying various gene expression levels and significant (p < 0.05) expression change accord- ing to the metatranscriptomic data. Genes participat- ing in methanogenesis as well as others involved in cell metabolism were included. Based on the log2FC values (Fig. 5) most of the examined genes showed consistent
-14 -12 -10 -8 -6 -4 -2 0 2 4 6 8 10
cdhC mcrB frhA mcrC ppdK oppA gapA eno rplJ mfnF cogF
Log2 Fold Change
Fig. 5 Comparison of metatranscriptomic and qPCR results of selected genes affected by early H2 treatment. The threshold value of significant gene expression was set to fold change 2 in gene expression (log2FC = 1). The selected genes are from bin_1: ppdK (pyruvate, phosphate dikinase);
bin_6: mfnF ((4-{4-[2-(gamma-L-glutamylamino)ethyl]phenoxymethyl}furan-2-yl)methanamine synthase), cofG (7,8-didemethyl-8-hydroxy-5-deazari boflavin synthase), rplJ (ribosomal protein L10), eno (enolase); bin_27: cdhC (acetyl-CoA decarboxylase/synthase), mcrB (methyl-CoM reductase beta subunit), frhA (Coenzyme F420 hydrogenase subunit alpha); bin_35: mcrC (methyl-CoM reductase gamma subunit); bin_59: gapA (glyceraldehyde 3-phosphate dehydrogenase), oppA (peptide nickel transport system substrate binding protein). Blue columns: metatranscriptomic expression, red columns: qPCR results
results with the metatranscriptomic data, although in several cases their fold change was slightly lower than derived from the metatranscriptomic analysis. The slight deviation could have been the result of the differ- ences between the distinct evaluation methods. The fold change (FC) calculation in the qPCR experiments is done on the traditional way (log2FC = log2(treated/control).
The DESeq2 program employed in metatranscriptomics uses a series of mathematical transformations to normal- ize the log2FC values [71]. Despite the minor differences, the RT-qPCR data clearly corroborated the MTR results.
Despite the minor differences, the RT-qPCR data clearly corroborated the MTR results.
Three genes may deserve special attention. The cofG gene had a more than 4 times smaller gene expression fold change in the qPCR experiment and it apparently diminished into the “unchanged”. category. Similarly, the FC of mfnF also droppped threefold although it still remained “upregulated” according to qPCR. It should be noted that DESeq2 attempts to filter the biologically rele- vant changes from the background noise thus in the case of cofG and mfnF the DESeq2 algorithm overestimated the FC values. The oppA decreased from “unchanged” to
“downregulated”. This gene is a substrate-binding protein, responsible for the transport of various oligopeptides across the cell membrane [42].
Interactions between methanogenesis and other metabolic processes
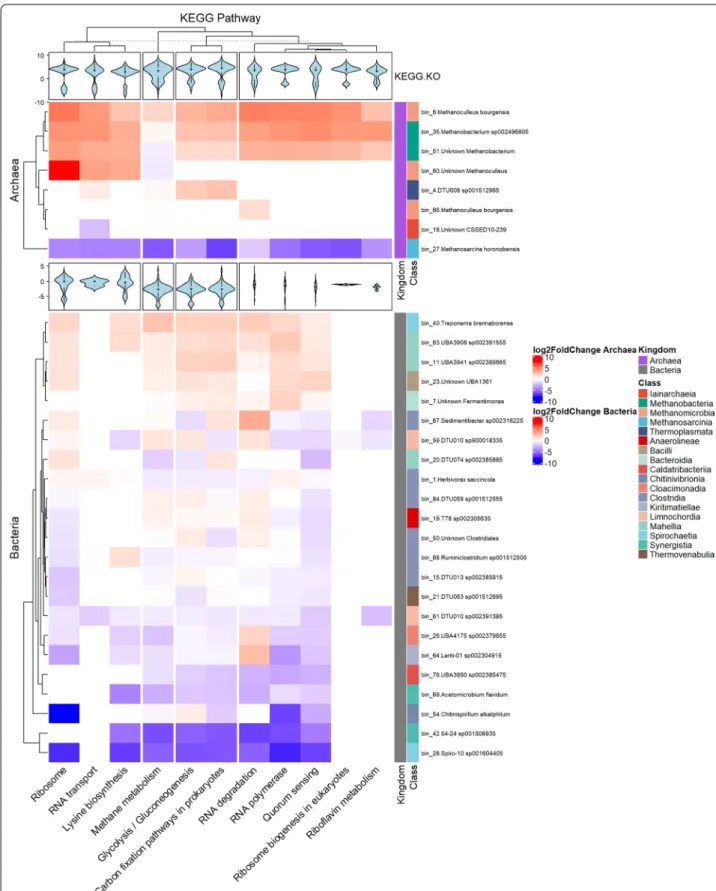
In addition to the methanogenesis pathways in the Archeal bins, we identified nine additional pathways that were expressed differently as the early response of the microbiota to H2 injection (Fig. 3B). Figure 6 presents the Archaea and Bacteria bins that indicate substantial up- or down regulation of several KEGG pathways. It is clear that H2 addition rapidly caused gene expression changes in the Archaea, i.e., bin_6, bin_27, bin_35 and bin_51, since the Ribosome, RNA polymerase and Methanogen- esis pathways were altered mainly in these bins.
In the case of Archaea, one Methanoculleus bin (bin_6) and the two Methanobacteria bins (bin_35 and bin_51) responded with elevated gene expression in all pathways, while the Methanosarcina (bin_27) and Iainarchaeia (bin_18) responded with a substantial and general loss of transcripts, i.e., biological activity, in them.
Interestingly, the three Methanoculleus bins responded differently to the H2 injection. Apparently, the entire met- abolic activity, including all KEGG orthologs, were tuned up in bin_6 (classified as M. bourgensis), whereas only Ribosomal activity, RNA transport and Lysine biosyn- thesis was strongly upregulated in bin_60 and hardly any change in metabolic activity took place in bin_66 repre- senting presumably a separate strain of M. bourgensis.
Their overall gene expression did increase (log2FC of 2.19 and 2.37, respectively), thus the observed differences might as well indicate a slower response by bin_60 and bin_66 and perhaps further H2 addition would have trig- gered a response more similar to that of the abundant M bourgensis (bin_6). If future experiments corroborate this situation, than the observation may indicate the time resolution limit of H2 triggered transcription and meta- bolic changes. It seems that the whole RNA machinery must be altered for responding to a significant change in the environment. Indeed, almost all genes (including the subunits of RNA polymerase for instance) from these pathways were highly expressed in the Methanomicro- bia and Methanobacteria bins, and 64% of them with a log2FC of 2 or higher (p-value of 0.05 or lower). The early response to H2 injection by Methanosarcina horonoben- sis (bin_27) was quite the opposite as the expression of all investigated KEGG orthologs and metabolic pathways were hindered significantly, i.e., up to 33% (Fig. 6).
Other carbon metabolism-related pathways that showed an overall significant difference in the pathway enrichment analysis were “carbon fixation” pathways in prokaryotes and “glycolysis/gluconeogenesis”, which showed a similar pattern. For example the folD gene of the reductive acetyl-CoA pathway (Wood-Ljungdahl pathway) was transcribed vigorously in bin_6 (M. bour- gensis) (log2FC = 3.7). The relative enrichment of Metha- nogenesis, acetate to methane was overall the highest in this bin (mean log2FC = 3.55), this can be linked to the elevated acetotrophic methanogenesis, as there were no other major difference between the expression change in these pathways. Interestingly though, the Methanogen- esis, CO2 to methane module did not increase drastically (nor did the methylotrophic module), with the excep- tion of a handful of genes showing log2FC higher than 2, including methenyltetrahydromethanopterin cyclo- hydrolase gene in bin_6 and bin_35 (log2FC = 2.56 and 3.49, respectively), and some others with smaller but still significant differences, including the F420-non-reducing hydrogenase iron-sulfur subunit gene of bin_6 (log2FC = 1.32, p-value = 0.04).
Changes in gene expression levels in bacterial bins
Some genes involved in, or related to elements of the methanogenesis pathway could be found in bacterial bins as well, e.g. Herbivorax saccincola, Ruminiclostrid- ium sp001512505, two unknown Limnochorida and a Mahellia MAG. However, when inspecting the change of the methanogenesis-related KEGG orthologs in the MAGs, it became clear that these genes showed sig- nificant difference only in a few cases, i.e., their log2FC values were spread between the threshold lines that indi- cated significance. Consequently, they were involved in
Fig. 6 Heatmap of significantly various KEGG Pathways in bins that harbor a total of at least 10 genes in any of these pathways or modules. Top panel shows Archaea, while the bottom panel shows Bacteria bins. Filling colors are according to the log2FC of all the genes in that pathway/
module in the given bin. Violin plots represent log2FC values of every gene participating in the given pathway/module
the overall methanogenesis, and closely related metabolic pathways (which are included in the KEGG map00680 pathway), but they did not respond to the H2 provision change. This was substantially different from the behav- ior of the Archaea MAGs, which clearly expressed their genes differently as a respond to H2 injection.
In the case of Bacteria, the RNA-machinery pathways (ko03010) showed an overall decrease in gene expression, with the exception of bin_40 (Treponema brennaborense), bin_8 (Fermentimonas massiliensis), bin_11 (UBA3941_
sp002385665) and bin_7 (Unknown Fermentimonas).
These MAGs had low abundance, though they showed an increase in the MTR samples. The related pathways seem to be up-regulated in bin_40 and in bin_11 (mapped in class Mahellia, order Caldicoprobacterales). Most of the small and large ribosomal subunits showed log2FC of 2 or higher. Another member of the family Treponemataceae (bin_28 Spiro-10 sp001604405) showed a clear downreg- ulation in all discussed pathways.
In AD, Treponema behave like homoacetogenes, they consume H2 and CO2 to produce acetate, hence they may compete with hydrogenotrophic methanogens [43], although not very efficiently [17]. We identified only two methanogenesis related genes in bin_28 and bin_40 (formate-tetrahydrofolate ligase and methylenetetrahy- drofolate reductase NADPH), bin_40 showed an overall activity increase (log2FC = 2.216), indicating either that this pathway would become more active at a later time- point, or these bacteria utilize alternative catabolic activi- ties. In a relevant observation Treponema abundance increased in digesters spiked with H2 [44], although after 90 h the signs of H2 stress were noted in the digester.
Essential genes of the Wood-Ljungdahl (WL) path- way were apparently not expressed in bacterial bins in a recent study [30]. In contrast, in the present work we identified several bins harboring these genes, includ- ing bin_7 (Unknown Fermentimonas), bin_8 (Fermenti- monas massiliensis) and bin_20 (DTU074 sp002385885, although all of them showed low abundance (~ 0.3–1%).
Interestingly, bin_20 exhibited an overall decrease, but the expression of its WL pathway genes increased. This can be attributed to the elevation of the transcriptional activity of only two genes, the fhs gene (formate-tetrahy- drofolate ligase) and the folD gene (methylene-tetrahy- drofolate oxidase), which are important in WL pathway (log2FC = 6.31 and 3.14, respectively). This response to H2 is thus the opposite to that of bin_40, suggesting that as acetogenic methanogenesis increased, it might have tried to compete with the Archaea for acetate. The other two potential homoacetogens, which increased their transcriptional activity (log2FC = 1.40 and 2.56, respec- tively), apparently included the fhs and folD genes as well.
It was also demonstrated earlier that homoacetogenic
microbes tended to increase their activity in a H2-fed sys- tems [45].
Discussion
The interest in converting the fossil fuel based energy market to renewable energy carriers is growing world- wide. This is a very positive trend to avoid threatening global climate change and associated environmental catastrophes. The overwhelming majority of renewable energy production approaches employ photovoltaics and wind power today. Both of these technologies gener- ate electricity in an intermittent fashion. The power dis- tribution grids are designed to harmonize electricity production and consumption continuously, these grids can operate in a fluctuating mode only with substantial energy loss. Hence, technologies to balance the fluctua- tions are urgently needed. A very promising solution to this problem is offered by the flexible biogas technol- ogy [46]. Biogas plants have controllable energy output to buffer the fluctuations in renewable electricity pro- duction. Moreover, with a coupled technology called Power-to-Gas (P2G), Power-to-Methane (P2CH4) or Power-to-Biomethane (P2bioCH4), biogas reactors can efficiently convert the temporarily surplus renew- able electricity to biomethane (bioCH4). Clean bioCH4 is chemically indistinguishable from the fossil natural gas, therefore it can be stored and transported efficiently and inexpensively in the natural gas grids. The biotechnologi- cal route to P2bioCH4 requires specific microbes capa- ble of converting H2+ CO2 to CH4 in a carbon neutral or negative carbon footprint process. The key potential player microbes are methanogenic Archaea, a group of rare and obscure obligate anaerobic microbes. The pre- cise biochemical events leading to CH4 formation are only understood in a broad sense today.
Understanding of the molecular regulation and control of the highly complex cell factory pathways of micro- bial communities carrying out AD, is a challenge for both basic and applied research. In this study we aimed at mapping the early response of the entire community, with particular attention to methanogens, a scenario fre- quently envisaged and expected in the P2bioCH4 indus- try [35].
In a recent study thermophilic biogas reactors were fed with H2, and after 18 h and 36 days MTR analyses were carried out to unveil the involvement of the indi- vidual MAGs in the global microbiome functions [30].
The results revealed a multi-trophic role to Methano- sarcina thermophila, although the hydrogenotrophic Methanoculleus thermophilus prevailed as the dominant Archaea species in terms of relative gene expressions, at the expense of M. thermophila. Some community mem- bers emerged in the later stages of methanogenesis were
below the detection limit in the starting sample, i.e., Methanobacteriaceae spp.
The changes in the metatranscriptome of an AD com- munity triggered by H2 addition were studied before in thermophilic reactors, but the short-term response at mRNA-level to H2 was not Mapping the early response of the microbial community via genome-centric metatran- scriptomics is therefore important for understanding and managing the turn-on and turn-off steps of the P2bi- oCH4 process. Genome-centric MG linked MTR inves- tigations enables the distinction of the activity of each individual MAG and the identification of the key and most sensitive members of the community.
In the examination of the initial response of the com- plex AD microbial community and assessment of the first up- or down-regulated genes by the H2 injection a custom bioinformatics workflow was employed for the down- stream analysis of the genes and pathways of each MAGs.
This involved primarily the SqueezeMeta [47] pipeline, which can jointly analyze MG and MTR sequencing data.
In addition a more extensive binning procedure, a subse- quent pathway enrichment analysis and statistical evalu- ation of the log2FC of the gene expressions of the MAGs between the H2 and N2 MTR samples were carried out. In order to gain higher statistical confidence in the results, we used biological duplicates separated by a 2-month interval in CSTR AD reactors. The following important considerations were also adopted: (1) The metagenomes of the samples separated by just a 2-h time-window, i.e., before H2 addition and 2 h later, to make sure an unal- tered microbial community. (2) qPCR tests of a handful of selected genes validated the results from the metatran- scriptomics pipeline.
First we established that the composition of the micro- bial community did not change significantly (Fig. 2), therefore the different reproduction rates of the vari- ous taxa did not disturb the picture of early functional response. Up-to-date metagenomic and metatran- scriptomic methods were employed to determine the biochemical events taking place as the result of H2
administration. The reproducibility of the system was tested by repeated H2 injections 2 months apart. Practi- cally identical results were obtained (Fig. 2).
Four metagenome (MG) sequencing datasets were combined to assemble a fairly large number of bins (84 bins: seven Archaea, 61 Bacteria and 16 unclassified bins). The non-H2-adapted, “raw” biogas forming micro- bial community was essentially the same in structure and composition as the ones sampled previously from the same industrial biogas plant fed with manure and maize silage [48, 49]. This community switched to H2 consump- tion and biomethane production almost immediately following H2 injection, although feeding of the entire
community with alpha-cellulose substrate continued as before. We interpret that this behavior indicated the presence of sufficient hydrogenotrophic methanogenesis activity in the “raw” biogas community, i.e., in the large scale biogas plant effluent, to perform the P2bioCH4 con- version at full speed. In other words, the diverse, “raw”
anaerobic communities can be used in switching on P2bioCH4 without a lengthy adaptation and enrichment period. This allows a quick and efficient turn-on and turn-off response by the mixed methanogenic commu- nity. The microbial community composition rearranges upon long-term exposure to H2 (and CO2), particularly when no other organic substrate is available for the com- munity [49]. The vigorous P2bioCH4 activity returned to normal biogas production as soon as the dissolved H2 diminished, but the community was ready to adjust its biochemistry to instant H2 conversion and P2bioCH4
repeatedly.
The metatranscriptomic responses to the H2 treat- ments separated 2 months apart were very similar to each other indicating that the metabolic pathways were flexibly restored after switching on and off the P2bioCH4
operational mode. A thorough analysis of the differ- ences between the H2-treated metatranscriptomes and corresponding controls identified the early events in the microbial communities brought about by H2.
H2 (and dissolved CO2) is readily converted to CH4 by both direct (hydrogenotrophic) and indirect (homoace- togenesis and subsequent acetotrophic) methanogenesis.
Our results suggest that the second route is unlikely the predominant one in the early response of the microbial community to H2 addition at least under mesophilic conditions, since the acetotrophic pathways reacted sluggishly, while the gene transcription of the hydrogen- otrophic route increased dramatically after a very short period of extensive H2 feeding (Figs. 4, 5). This predicts that under the P2bioCH4 operation conditions the physi- ological readiness of the hydrogenotrophic methanogen members of the community will determine the reactor response rate upon switch-on of the H2 addition.
Interestingly, this study revealed an extensive reac- tion to the transient H2 stress within the Bacteria community as well although Bacteria cannot directly generate CH4 from H2 as many Archaea can. Some of these Bacteria possess the complete or partial enzyme sets for the Wood-Ljungdahl pathway. These and the homoacetogens are probably the best candidates for syntrophic community interactions between members of the distinct kingdoms of Archaea and Bacteria. The details of these interactions in the complex anaero- bic environment and consequences to stabilize robust and vigorous P2bioCH4 microbial communities dur- ing long term P2G operation should be the subjects of
future studies. Nevertheless, the transcriptional activity of the primary potential syntrophic bacterial partners (bin_1 (Herbivorax saccincola), bin_68 (Ruminococcus sp.), and unidentified bins_59, _61, _63, see Fig. 4) did not change substantially upon H2 exposure. This may mean that either there is enough syntrophic capacity already in the non-adapted, “raw” community to sup- port increased hydrogenotrophic methanogen activity or the syntrophic partners respond slowly to the sud- den H2 burst appearing in the microbial environment.
The development of a stable P2CH4 community strongly depends on environmental conditions and on the starter microbial community composition. Various reactor designs, operational parameters and inocula are being tested making rigorous comparison of the results difficult.
In a brief review to summarize in situ biogas upgrad- ing Zhang et al. [50], pointed out the predominant roles of the genus Methanoculleus under mesophilic condi- tions and the thermophilic genus Methanothermobac- ter at elevated temperatures. The species M. bourgensis (bin_6) was identified to play an important role in vari- ous biogas reactor systems. Methanoculleus species grow on CO2 and H2 and hence perform the hydrog- enotrophic pathway for CH4 synthesis [51]. In line with these conclusions, the mesophilic AD methanogenic community of palm oil mill effluent with eventual addi- tion of formate was predominated by members of the genus Methanoculleus [52]. Various inocula were com- pared for biomethane production at mesophilic condi- tions in batch fermentations. It was concluded that the abundance and activity of the genera Methanosarcina and Methanoculleus played key roles in methanogen- esis of added H2 [52], while the authors also noted the regulatory role of the available CO2/bicarbonate in the production of CH4 and/or volatile fatty acids.
In a recent work [53] the microbial community changes were followed under various operational con- ditions starting from two distinct inocula, i.e., waste- water (WW) sludge and plug-flow reactor operated with agricultural waste (PF). The study pointed out the importance of the history of the inoculum communi- ties. In the WW inoculated batch reactors the metha- nogenic genus Methanobacterium and Methanothrix predominated and upon H2 feeding the genus Methano- bacterium took over. In the plug-flow reactor, supplied with animal manure and ensilaged plant biomass, the initial abundance of genus Methanothrix diminished and the methanogenic gap was filled in by members of the genera Methanobacterium and Methanoculleus.
This study corroborated the previous observations [19, 30] concerning the regulatory role of H2 concentration
and CO2 depletion in the selection of hydrogenotrophic methanogens predominating the P2bioCH4 community.
In a thorough in situ syngas bioconversion study running two UASB reactors in sequence at mesophilic temperature [54], observed the predominance of the genus Methanotrix (formerly Methanosaeta). The reactors were continuously fed with varying glucose loads. Methanotrix species appar- ently cannot carry out hydrogenotrophic methanogenesis, therefore their predominance under these conditions can be rationalized by the combined effects of glucose and CO-rich syngas addition via carboxydotrophic methano- genesis [55]. In addition, the recently recognized capability of Methanotrix species to carry out direct electron transfer (DIET) to drive CO2 reduction could facilitate the Metha- notrix predominance [56, 57].
Taking into account the recent results and considera- tions, the development of a stable P2bioCH4 mixed AD community depends on a number of important param- eters, such as the origin of inoculum, H2 supply and its fluctuation, composition of added growth supporting sub- strates, the dissolved CO2/HCO3− concentration, temper- ature and reactor configuration. In the future the extension of these studies should be carried out, i.e., mapping the molecular events after longer exposure of the microbial cell factory and linking the metagenomic approach to more detailed transcriptomic and proteomic studies.
Conclusion
In this study the early response of the mixed biogas microbial community to the presence of saturat- ing amount of H2 was examined. Metagenomic and metatranscriptomic analyses have been carried out to determine the changes of the expression levels of the various genes related to methanogenesis. The results indicated that the microbial community responded instantaneously to the presence of H2. The activity of acetotrophs reduced significantly. In addition, the meta- bolic activity of numerous bacterial strains changed substantially as a response to H2. Clearly, the excess H2 does not only affect the methanogenesis pathways in Archaea, rather the microbial community respond with a multifarious gene expression profile change, which seems to be rather selective. This indicates a more global regulatory role of H2 in the life of anaerobic communi- ties than assumed earlier. The syntrophic interactions contribute to the stability and metabolic activity of the hydrogenotrophic methanogens. This, together with the non-sterile operation conditions and continuous supply of inexpensive catalyst, underlines the benefits of using mixed communities in the P2bioCH4 process instead of pure hydrogenotrophic cultures [35, 58, 59].
Materials and methods Anaerobic fermentation
Anaerobic digestions (AD) were carried out in continu- ously stirred tank reactors [60]. The fermentation vol- ume was 5000 mL, leaving a headspace of 2000 mL. The apparatus can be fed continuously or intermittently via a piston type delivery system, the fermentation effluent is removed through an air-tight overflow. The reactors are equipped with a spiral strip mixing device driven by an electronic engine. An electronically heated jacket sur- rounds the cylindrical stainless steel body, electrodes for the measurement of pH and redox potential are inserted through the reactor wall, in sealed sockets. The device can be drained at the bottom. The evolved gas leaves the reactor through the top plate, where ports for gas sam- pling and the delivery of liquids by means of syringes through silicone rubber septa are also installed. Gas volumes are measured with thermal mass flow devices (DMFC SLA5860S, Brooks). A fresh sample from an industrial scale mesophilic biogas plant, fed with pig slurry and maize silage mix (Zöldforrás Biogas Plant, Szeged, Hungary) was used as an inoculum, i.e., the microbial community adopted to heterogeneous sub- strate degradation. The reactors were flushed with N2 to ensure anaerobic conditions and were closed air tight.
During the experiment the digesters were fed twice a day with synthetic medium in which only alpha-cellulose was added as a carbon source at a loading rate of 1 g oDM L-1 day-1. The reactors were operated under mesophilic conditions, at 37 °C.
Determination of fermentation parameters
Organic dry matter (ODM): The dry matter content was determined by drying the biomass at 105 °C overnight and weighing the residue. Further, heating of this residue at 550 °C provided the organic total solids content.
NH4+–N: For the determination of NH4+–N con- tent, the Spectroquant Ammonium test (1.00683.0001 test, Merck, Kenilworth, N.J, USA) was used in a Nova 60 spectrophotometer according to the manufacturer’s instructions.
VOA/TIC (Volatile organic acids/Total inorganic car- bon): 5 g of each AD samples were taken for analysis and diluted appropriately with distilled water. The subsequent measurement was carried out with a Pronova FOS/TAC 2000 Version 812-09.2008 automatic titrator (Pronova, Germany).
Sampling
The first set of samples were taken when the reactor operation was stabilized under N2 in the headspace, the daily biogas production, CH4 content and total organic
acid/buffer capacity ratio were constant. 2 mL of reac- tor content was withdrawn and total RNA for transcrip- tome analysis (sample names: N2-MTR) and DNA for metagenome analysis (sample names: N2_MG) were isolated immediately after sampling. Than the digesters were flushed with pure H2 gas for 10 min on day 15 and 71. H2 was injected directly from a pure H2 gas cylinder through custom made nozzles (10 pieces) having 0.2 mm holes. The applied gas pressure was 2 bar, the gas purity was 99.999%. 2 h after flushing the reactors with H2 sam- ples were also taken for RNA (sample names: H2_MTR) and DNA (sample names: H2_MG) isolation. The head- space was then replaced with N2 and the reactors were run under the same conditions as before. After 2 months the whole H2 treatment procedure was repeated in order to test the reproducibility of the set-up. At the sampling time points two biological parallels were withdrawn.
RNA isolation and cDNA synthesis
For RNA isolation 2 mL of reactor liquid samples were used. The samples were centrifuged at 12,000 rpm for 10 min. RNA extractions were carried out with the Zymo Research Soil/Fecal RNA kit (R2040, Zymo Research, Irvine, CA, United States). After lysis (bead beating), the Zymo Research kit protocol was followed. The DNA contamination was removed by Thermo Scientific Rapi- dout™ DNA removal kit (K2981, Thermo Fisher Scien- tific, Waltham, MA, United States). Ribosomal RNA was depleted using the Ribo-Zero™ rRNA Removal Kit for Bacteria (Illumina, Madison, USA) according to the man- ufacturer’s instructions. The rRNA depleted samples were purified via the RNA Clean and Concentrator Columns from Zymo Research (Irvine, USA). During this step, an additional in-column DNase I treatment was included to ensure complete removal of DNA. Subsequently, syn- thesis of double-stranded cDNA was conducted using the Maxima H Minus Double-Stranded cDNA Synthesis Kit from ThermoScientific (Waltham, USA). In the first- strand cDNA synthesis reaction, 2 μL of random hexamer primer were used. Final purification of the blunt-end double-stranded cDNA was carried out using SureClean Plus solution from Bioline (Luckenwalde, Germany). The cDNA was sequenced in the same way as the total DNA.
The quality of the RNA preparation was checked by aga- rose gel electrophoresis (data not shown).
DNA isolation
DNA extractions were carried out from 2 mL reac- tor liquid using a slightly modified version of the Zymo Research Fecal DNA kit (D6010, Zymo Research, Irvine, USA). The lysis mixture contained 100 µL of 10% CTAB (cetyltrimethylammonium bromide) to improve the
efficiency [61]. After lysis (bead beating was performed by Vortex Genie 2, bead size: 0.1 mm; beating time:
15 min, beating speed: max) and subsequently the Zymo Research kit protocol was followed.
The quantity of DNA was determined in a NanoDrop ND-1000 spectrophotometer (NanoDrop Technolo- gies, Wilmington, DE, United States) and a Qubit 2.0 Fluorometer (Life Technologies, Carlsbad, CA, United States). DNA purity was tested by agarose gel electro- phoresis and on an Agilent 2200 TapeStation instrument (Agilent Technologies, Santa Clara, CA, United States).
Sequencing
Paired-end libraries were prepared for the metagenome and metatranscriptome samples using the NEBNext® Ultra™ II DNA Library Prep Kit for Illumina (Cat.Num.:
E7645L). Paired-end fragment reads were generated on an Illumina NextSeq sequencer using TG NextSeq® 500/550 High Output Kit v2 (300 cycles). Raw read sequences (.fastq files) are available on NCBI-SRA under the following BioProject ID: PRJNA 698464.
Reverse transcription coupled quantitative PCR
Elevenmpared with the Bio-Gas Microbiome dat genes were selected for reverse transcription coupled quanti- tative PCR (RT-qPCR) based on the metatranscriptomic data. From every sample, 500 ng of RNA was transcribed into cDNA with the High Capacity cDNA Reverse Tran- scription Kit (Thermo Fisher Scientific, Waltham, MA, USA) according to the instructions of the manufacturer.
The PCR primer oligonucleotides were synthesized by Eurofins Genomics (Eurofins Genomics, Ebersberg, Germany). The primers are listed in Additional file 6:
Table S2. The reactions were prepared in a final vol- ume of 25 µL with Kapa SYBR Fast Universal qPCR kit (Roche, Basel, Switzerland). The qPCR experiments were carried out on a BioRad CFX96 Touch Real-Time PCR Detection System (BioRad, Hercules, CA, USA) with the following parameters: initial denaturation was done at 95 °C for 3 min then 40 cycles of 95 °C for 10 s and 60 °C for 30 s. For quantification of the gene copies, standards were prepared with every primer pair from the genomic DNA. The standards were amplified with DreamTaq DNA Polymerase in a BioRad T100 Thermal Cycler with the following parameters: initial denaturation was at 95 °C for 3 min, then 35 cycles of 95 °C for 30 s, 60 °C for 30 s, 72 °C for 20 s. After amplification, the PCR products were purified with Viogene PCR Advanced PCR Clean Up Miniprep System (Viogene Biotek Corp., New Tai- pei City, Taiwan) following the manufacturer’s instruc- tions. The PCR product concentration was determined on a Qubit4 fluorimeter (Thermo Fisher Scientific) with a Broad Range Assay Kit. The molarity of the PCR products
was calculated based on the size and concentration of the particular gene fragment. Dilution series were created from the PCR products with a factor of 10 from 1 × 10⁹ to 1 × 101 copies µL−1. The dilution series were measured on the same plate with their corresponding cDNA sam- ples in the RT-qPCR experiments. The RT-qPCR runs were evaluated with CFX Maestro version: 4.1.2433.1219 (BioRad). log2FC of the gene expression was calculated as for the transcriptomics data.
Bioinformatics
Quality filtering and trimming of the raw reads were car- ried out with FastQC. Assembly with MegaHIT, ORF prediction with prodigal and predicted gene functional annotation was carried out within the SqueezeMeta workflow [47]. For the KEGG KO annotation EggNOG database (v. 5) was used [62]. Binning of the contigs was carried out with four different binning algorithms:
Metabat2 [25], Maxbin2 [63], Concoct [24] and Binsan- ity [64]. The result of each binning procedure was further improved with DAS tool [65]. Bin qualities were esti- mated with CheckM [36] and bin taxonomy was deter- mined using the GTDB database. A phylogenomic tree from the protein genomes of the MAGs were built with the phylophlan3 program [66]: phylophlan –diversity high –fast -f phylophlan_configs/supermatrix_aa.cfg -t a –min_num_markers 75. The assembly, annotation, bin- ning and phylogenomic results were imported into and subsequently visualized with the Anvi’o [67] platform.
The results were compared with the Bio-Gas Microbiome database (Additional file 5: Table S1).
The filtered reads from each sample were mapped back onto each bins with bowtie2 [68] and FeatureCounts [69] was used to calculate the gene count table by using the ORF predictions of the bins. Since we were primar- ily interested in pathway analysis, genes that could be annotated with a KEGG Orthology (KO) were kept [70].
For the assessment of log2 fold changes (log2FC) between the samples the DESeq2 package was used [71], which was proven to be an appropriate method to infer differ- ences between metagenomic and metatranscriptomic gene counts [72]. The following parameters were set:
test = "Wald", fitType = "parametric", filterFun = ihw.
For the assessment of significance, the Benjamini-Hoch- berg-adjusted p-values were used (termed ‘padj’), with a threshold of 0.05.
Differentially expressed KOs and pathways were assessed at two levels: First, counts of genes with the same KO anno- tation were grouped together and summed in each sam- ple. Differentially expressed KOs between the two MTR samples were then determined with DESeq2 as described above. The resulting DE KO list was the input for Cluster- profiler R package [73] to detect differentially expressed