1Synthetic and Systems Biology Unit, Institute of Biochemistry, Biological Research Centre of the Hungarian Academy of Sciences, Szeged, Hungary.
2Department of Genetics, Eötvös Loránd University, Budapest, Hungary. 3Doctoral School in Biology, Faculty of Science and Informatics, University of Szeged, Szeged, Hungary. 4SeqOmics Biotechnology Ltd, Mórahalom, Hungary. 5Sequencing Platform, Institute of Biochemistry, Biological Research Centre of the Hungarian Academy of Sciences, Szeged, Hungary. 6Hereditary Endocrine Tumors Research Group, Hungarian Academy of Sciences and Semmelweis University, Budapest, Hungary. 71st Department of Internal Medicine, Albert Szent-Györgyi Health Centre, University of Szeged, Szeged, Hungary. 8These authors contributed equally: Bálint Kintses, Orsolya Méhi, Eszter Ari. *e-mail: kintses.balint@brc.mta.hu; pappb@brc.hu; cpal@brc.hu
T he maintenance of homeostasis between the gut microbiota and human host tissues entails a complex co-evolutionary relationship1,2. Mucosal barriers covering the intestinal epi- thelium restrict microbes to the lumen, control the composition of commensal inhabitants and ensure the removal of pathogens
3,4. Cationic host antimicrobial peptides (AMPs) have crucial roles in this process
5. They are among the most ancient and efficient com- ponents of the innate immune defence in multicellular organisms and have retained their efficacy for millions of years
5,6. As AMPs have a broad spectrum of activity, much effort has been put into finding potential antibacterial drugs among AMPs
7,8.
However, therapeutic use of AMPs may drive bacterial evolu- tion of resistance to our own immunity peptides
9,10. Therefore, it is of central importance to establish whether genes that influence AMP resistance (AMP resistance genes) in the gut microbiome are available for genetic exchange with other bacterial species.
Several lines of observation support the plausibility of this sce- nario. The gut bacterial community is a rich source of mobile antibiotic resistance genes
11, and certain abundant gut bacte- rial species exhibit high levels of intrinsic resistance to AMPs
12. Moreover, even single genes can confer high AMP resistance in Bacteroidetes
12. However, beyond the recent discovery of a horizontally spreading resistance gene family
13,14, the mobility of AMP-resistance-encoding genes across bacterial species has remained unknown.
Here, we have applied an integrated approach to systematically characterize the mobilization potential of the AMP resistance gene reservoir in the human gut microbiome. First, we examined the pat- terns of horizontal gene transfer events involving AMP resistance genes by analysing bacterial genome sequences from the human gut and naturally occurring plasmid sequences from the human microbiome. Next, we experimentally compared the functional compatibility of AMP resistance versus antibiotic resistance genes from the gut microbiome with a susceptible host, Escherichia coli, by performing functional metagenomic selections and by culturing the gut microbiome in the presence of diverse AMPs and small-mole- cule antibiotics. Together, these analyses revealed that AMP resis- tance genes are less frequently mobilized owing to lack of functional compatibility with new bacterial hosts.
Results
Infrequent horizontal transfer of AMP resistance genes in the gut microbiota. We begin by asking whether the genetic determinants
of resistance to AMPs and antibiotics, respectively, differ in their rate of horizontal transfer in the human gut microbiota. To system- atically address this issue, we first collected previously character- ized AMP and antibiotic resistance genes from the literature and databases, yielding a comprehensive catalogue of 114 and 199 AMP resistance and antibiotic resistance gene families, respectively (see Methods and Supplementary Table 1). By definition, AMP resistance
Phylogenetic barriers to horizontal transfer of antimicrobial peptide resistance genes in the human gut microbiota
Bálint Kintses
1,8*, Orsolya Méhi
1,8, Eszter Ari
1,2,8, Mónika Számel
1,3, Ádám Györkei
1,
Pramod K. Jangir
1,3, István Nagy
4,5, Ferenc Pál
1, Gergely Fekete
1, Roland Tengölics
1, Ákos Nyerges
1,3, István Likó
6, Anita Bálint
7, Tamás Molnár
7, Balázs Bálint
4, Bálint Márk Vásárhelyi
4,
Misshelle Bustamante
2, Balázs Papp
1* and Csaba Pál
1*
The human gut microbiota has adapted to the presence of antimicrobial peptides (AMPs), which are ancient components of
immune defence. Despite its medical importance, it has remained unclear whether AMP resistance genes in the gut microbi-
ome are available for genetic exchange between bacterial species. Here, we show that AMP resistance and antibiotic resis-
tance genes differ in their mobilization patterns and functional compatibilities with new bacterial hosts. First, whereas AMP
resistance genes are widespread in the gut microbiome, their rate of horizontal transfer is lower than that of antibiotic resis-
tance genes. Second, gut microbiota culturing and functional metagenomics have revealed that AMP resistance genes originat-
ing from phylogenetically distant bacteria have only a limited potential to confer resistance in Escherichia coli, an intrinsically
susceptible species. Taken together, functional compatibility with the new bacterial host emerges as a key factor limiting the
genetic exchange of AMP resistance genes. Finally, our results suggest that AMPs induce highly specific changes in the compo-
sition of the human microbiota, with implications for disease risks.
genes influence bacterial susceptibility to at least one AMP when mutated (see Methods). Next, we compared the frequencies of these previously identified AMP and antibiotic resistance genes in a catalogue of 37,853 horizontally transferred genes from 567 genome sequences of phylogenetically diverse bacterial species in the human gut microbiota
15. This mobile gene catalogue relies on the identification of nearly identical genes that are shared by dis- tantly related bacterial genomes and thereby provides a snapshot of the gene set subjected to recent horizontal gene transfer events in a representative sample of the human gut microbiome
15. We identi- fied homologues of the literature-curated resistance genes for which at least one transfer event was reported (that is, those present in the mobile gene pool; see Methods and Supplementary Table 2).
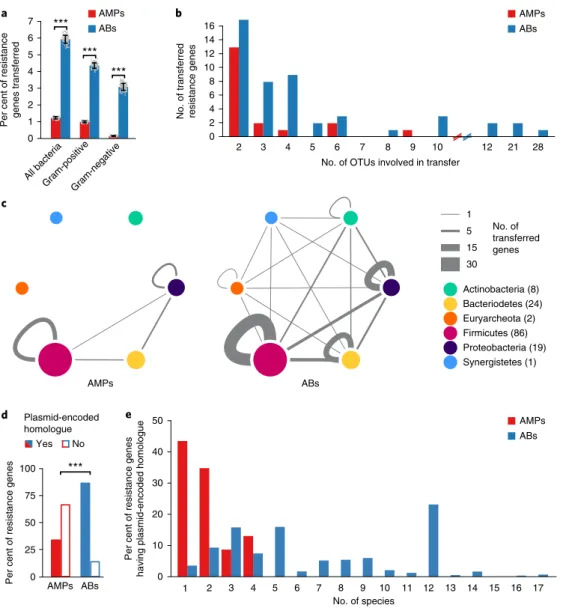
We found that the relative frequency of AMP resistance genes within the pool of mobile genes was 4.8-fold lower than that of antibiotic- resistance genes, in spite of their similar frequencies in the genomes of the gut microbiota (Fig. 1a, Supplementary Fig. 1a and Supplementary Table 2). Notably, the relative under-represen- tation of AMP resistance genes in the mobile gene pool cannot be simply attributed to the large physiological differences between Gram-negative and Gram-positive bacteria. When these two bac- terial groups were considered individually, AMP resistance genes remained under-represented in the mobile gene pool compared to antibiotic resistance genes (Fig. 1a). Moreover, the unique trans- ferred AMP resistance genes were shared between fewer bacterial species, indicating fewer transfer events per gene (Fig. 1b). Notably, 65% of these transfer events mobilized AMP-transporting efflux pumps between bacteria within the Firmicutes phylum (Fig. 1c, Supplementary Fig. 1b and Supplementary Table 3).
To further support the low mobility of AMP resistance genes, we next explored whether AMP resistance genes from our litera- ture-curated list are associated with naturally occurring plasmid sequences or integrative conjugative elements (ICEs) in the human gut microbiome (see Methods). Strikingly, while 86% of the antibi- otic resistance genes had close homologues on plasmids, only 33% of the AMP resistance genes did (Fig. 1d and Supplementary Table 4).
Moreover, the plasmids carrying individual antibiotic resistance genes were more widespread across bacterial species than those carrying AMP resistance genes (Fig. 1e). Notably, many of these plasmid-encoded AMP resistance genes were proteases and efflux pumps carried by virulence or multi-drug resistance plasmids in the human microbiome (Supplementary Table 4). Finally, as with plasmid sequences, we found that disproportionately fewer AMP resistance genes had homologues in ICEs than antibiotic resistance genes (Supplementary Fig. 2 and Supplementary Table 4).
Overall, these results suggest that AMP resistance genes are less frequently transferred across bacterial species in the human microbiota.
Short genomic fragments from the gut microbiota rarely confer AMP resistance. One possible reason for the low mobilization of
AMP resistance genes could be that AMP resistance is an intrinsic property of certain bacteria shaped by multi-gene networks
10. Genes involved in AMP resistance may display strong epistatic interac- tions, and therefore they may have little or no impact on resistance individually. If this was so, horizontal gene transfer of single genes or transcriptional units encoded by short genomic fragments would not provide resistance in the recipient bacterial species. Indeed, AMPs interact with the cell membrane, a highly interconnected cel- lular structure, and membership in complex cellular subsystems has been shown to limit horizontal gene transfer
16,17.
To investigate this scenario, we experimentally compared the ability of short genomic fragments to transfer resistance pheno- types towards AMPs versus antibiotics. To this end, we applied an established functional metagenomic protocol
11,18to identify ran- dom 1.5–5 kb DNA fragments in the gut microbiome that confer
resistance in an intrinsically susceptible E. coli strain. Importantly, the length distributions of the known AMP resistance and anti- biotic resistance genes are well within this fragment size range (Supplementary Fig. 3), indicating that our protocol is suitable to capture single resistance genes for both AMPs and antibiotics.
Metagenomic DNA from human gut faecal samples was isolated from two unrelated, healthy individuals who had not taken any antibiotics for at least one year. The resulting DNA samples were cut, and fragments between 1.5 and 5 kb were shotgun cloned into a plasmid to express the genetic information in E. coli K-12. About 2 million members from each library, corresponding to a total coverage of 8 Gb (the size of ~2,000 bacterial genomes), were then selected on solid culture medium in the presence of one of 12 diverse AMPs and 11 antibiotics (Supplementary Table 5) at concentrations where the wild-type host strain is susceptible. Finally, using a third- generation long-read sequencing pipeline
19, the number of unique DNA fragments conferring resistance (that is, resistance contigs) was determined.
In agreement with earlier studies
11,20, multiple resistant clones emerged against all tested antibiotics (Fig. 2a and Supplementary Table 6). In sharp contrast, no resistance was conferred against half of the AMPs tested, and, in general, the number of unique AMP resistance contigs (N = 34) was substantially lower than the num- ber of unique antibiotic resistance contigs (N = 119) (Fig.
2a andSupplementary Table 6). Polymyxin B—an antimicrobial peptide used as a last-resort drug in the treatment of multidrug-resistant Gram-negative bacterial infections
21—is a notable exception to this trend, with a relatively high number of unique resistance contigs (Fig. 2a). Indeed, a resistance gene (mcr-1) against polymyxin B is rapidly spreading horizontally worldwide, representing an alarming global healthcare issue
22. In contrast to polymyxin B, we detected only one unique contig conferring resistance to LL37, a human AMP abundantly secreted in the intestinal epithelium
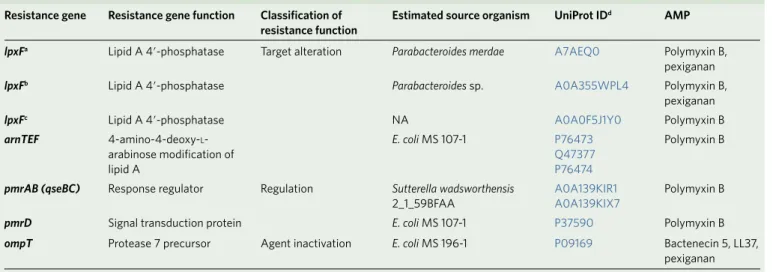
23(Supplementary Table 6). These specific AMP resistance genes are involved in cell surface modification, peptide proteolysis and regulation of the outer membrane stress response (Table 1, Supplementary Table 6 and Supplementary Fig. 4).
If lack of functional compatibility with the host cell prevents AMP resistance genes from exerting their phenotypic effects, then DNA fragments identified in our screen should more often come from phylogenetically closely related bacteria. A total of 53% of the contigs showed over 95% sequence identity to bacte- rial genome sequences from the HMP database
24(see Methods and Supplementary Fig. 5), allowing us to infer the source taxa with high accuracy (Supplementary Table 6). Indeed, while antibi- otic resistance contigs were over-represented from Firmicutes, the most abundant phylum in the gut, AMP resistance contigs origi- nated excessively from Proteobacteria, which are phylogenetically close relatives of the host E. coli (Fig. 2b and Supplementary Fig. 6).
Notably, this trend was not driven by polymyxin B only, but was valid for the rest of the AMPs as well (Supplementary Fig. 6).
Whereas these patterns are consistent with the hypothesis that the genetic determinants of AMP resistance are difficult to transfer via short genomic fragments owing to a lack of functional compat- ibility with the new host, another explanation is also plausible. In particular, AMP-resistant bacteria might be relatively rare in the human gut microbiota, so AMP resistance genes from these bacteria might simply remain undetected. However, as explained below, we can rule out this alternative hypothesis.
AMP resistant gut bacteria are abundant and phylogenetically diverse. To assess the diversity and taxonomic composition of gut
bacteria displaying resistance to AMPs and antibiotics, we carried
out anaerobic cultivations and selections of gut microbiota using
a state-of-the-art protocol
25. To this end, faecal samples were col-
lected from seven healthy individuals (Faecal 7 mix, see Methods).
As expected
25, the cultivation protocol allowed representative sam- pling of the gut microbiota: we could cultivate 65–74% of the gut microbial community at the family level in the absence of any drug treatment (Supplementary Fig. 7 and Supplementary Table 7). Next, the same faecal samples were cultivated in the presence of one of 5–5 representative AMPs and antibiotics (Supplementary Table 8).
We applied drug dosages that retained 0.01–0.1% of the total cell
populations from untreated cultivations (Supplementary Table 8) and assessed the taxonomic composition of these cultures by 16S rRNA sequencing (see Methods).
Remarkably, the diversities of the AMP-treated and untreated bacterial cultures did not differ significantly from each other (Fig.
3a), despite marked differences in their taxonomic composi-tions (Fig. 3b). AMP-treated samples contained several bacterial
a b AMPs
ABs
No. of transferred resistance genes
No. of OTUs involved in transfer
2 3 4 5 6 7 8 9 10 12 21 28
0 4 8 12 16
2 6 10 14
0 25 50 75 100
AMPs ABs
Per cent of resistance genes 0
10 20 30 40 50
Per cent of resistance genes having plasmid-encoded homologue
2
1 3 4 5 6 7 8 9 10 11 12 13 14 15 16 17
AMPs ABs Actinobacteria (8) Bacteriodetes (24) Euryarcheota (2) Firmicutes (86) Proteobacteria (19) Synergistetes (1)
AMPs ABs
c
No Yes Plasmid-encoded homologue
No. of transferred genes 1 5 15 30 AMPs
ABs
Per cent of resistance genes transferred 0 1 2 3 4 5 6
7 ***
***
***
***
No. of species All bacteria
Gram-positiveGram-negative
d e
Fig. 1 | AMP resistance genes are less frequently transferred in the human gut microbiome than antibiotic resistance genes. a, Percentage of AMP resistance genes (AMP, red bars) and antibiotic resistance genes (AB, blue bars) detected as horizontally transferred (that is, present in the mobile gene pool). Resistance genes were identified using BLAST sequence similarity searches in the genome sequences of the gut microbiota (see Methods).
***Significant difference (left to right): P = 2 × 10⁻¹⁶, 4 × 10⁻¹⁶, 2 × 10⁻¹³ from two-sided binomial test, in each case n = 100 both for AMPs and ABs).
Centre and error bars represent mean and s.d. values calculated by randomly sampling 100 times from each of the 225 operational taxonomic units (OTUs), respectively (see Methods and Supplementary Table 2). b, Unique mobile AMP resistance genes were involved in half as many between-species transfer events as antibiotic resistance genes (P = 0.01, two-sided negative binomial regression, n = 19 and 50 for AMP and antibiotic resistance genes, respectively). The result remains when a non-parametric test is used, which is less sensitive to outliers (P = 0.02, two-sided Mann–Whitney U test). OTUs were generated as for a (Supplementary Table 3). On the x axes, the continuity of the scale breaks between 10 and 12. Above 12, only values with at least one transferred resistance gene are shown. c, Network representation of the mobile gene pool in the case of AMP and antibiotic resistance genes. Straight and curved lines represent genes that were shared between OTUs of different phyla and the same phylum, respectively. Line thickness represents the number of resistance genes shared between OTUs of six major phyla. Node size and numbers in parentheses indicate the number of OTUs in each phylum that shared at least one transferred AMP or antibiotic resistance gene. OTUs were generated as for a. d, Significantly fewer AMP resistance genes (46 out of 137) have a close homologue in naturally occurring plasmid sequences in the human microbiome as compared to antibiotic resistance genes (1,867 out of 2,163) (P = 2.2 × 10⁻⁶, two-sided Fisher’s exact test). n = 137 and 2,163 for AMPs and ABs, respectively (see Methods and Supplementary Table 4).
e, Plasmid-encoded homologues of individual AMP resistance genes were found in significantly fewer species in the human microbiome as compared to antibiotic resistance genes (P = 5.6 × 10⁻¹⁵, two-sided negative binomial regression, n = 23 for AMPs and n = 1,772 for antibiotics, see Methods).
families from the Firmicutes and Actinobacteria phyla, which are phylogenetically distant from E. coli (Fig. 3c). Notably, exposure to AMP stress provided a competitive growth advantage to bacte- rial families that remained undetected in the untreated samples (Fig. 3c). The examples include Desulfovibrionaceae, Clostridiaceae and Eubacteriaceae. Desulfovibrionaceae is a clinically relevant bacterial family that is linked to ulcerative colitis
26—an inflamma- tory condition with elevated AMP levels
27, while Clostridiaceae and Eubacteriaceae have key roles in maintaining gut homeosta- sis
28(Fig. 3c). In sharp contrast, the diversity of antibiotic-treated cultures dropped significantly compared to both the untreated and AMP-treated cultures (Fig. 3a and Supplementary Fig. 8). Several bacterial families had a significantly lower abundance in the anti- biotic-treated cultures than in the untreated ones (Fig. 3c). These results indicate that the human gut is inhabited by a large number of bacterial families across all major phyla in the gut that exhibit intrinsic resistance to AMPs.
Human microbiota harbours a large reservoir of AMP resis- tance genes. Next, we assessed if the high taxonomic diversity
in the AMP-resistant microbiota corresponds to a diverse reser- voir of AMP resistance genes. To this end, we annotated previ- ously identified AMP- and antibiotic-resistance genes in a set of gut bacterial genomes
16representing bacterial families that were detected in our culturing experiments following AMP and anti- biotic selection, respectively (Fig. 3c; for details, see Methods).
Remarkably, 65% of our literature-curated AMP resistance gene families (Supplementary Table 1) were represented in at least one of these genomes (Supplementary Table 2), which is similar to the value for antibiotic resistance gene families (58%). Finally, AMP resistance gene families, on average, were 39% more widespread in these species than the same figure for antibiotic resistance genes (Supplementary Fig. 9). Thus, the human gut harbours diverse AMP-resistant bacteria and a large reservoir of AMP resistance genes.
AMPs ABs
Ampicillin Doxycyclin Tetracyclin Nalidixic acid Tobramycin Streptomycin Ciprofloxacin Cefoxitin Erythromycin Trimethoprim
R8
Cecropin P1 Omiganan Tachyplesin II
PR-39 Indolicidin LL37 Pexiganan Bactenecin5 Protamine PGLa Polymyxin B
Cloramphenicol
* * * * * *
No. of contigs
0 5 10 15 20 25
a b
**
Actinobacteria Bacteriodetes Firmicutes Proteobacteria
AMPs ABs
* *
0 10 20 30 40 50
Per cent of contigs
Fig. 2 | In E. coli, short genomic fragments from the human gut microbiota confer AMP resistance less frequently than antibiotic resistance. a, Functional selection of metagenomic libraries with 12 AMPs (red bars) resulted in fewer distinct resistance-conferring DNA contigs than with 11 conventional small- molecule antibiotics (ABs, blue bars). P = 0.002 from two-sided negative binomial regression, n = 34 AMP resistance contigs, n = 119 antibiotic resistance contigs. Red asterisks indicate zero values. **Significant difference between AMPs and antibiotics. b, Phylum-level distribution (%) of the AMP resistance (red bars) and antibiotic resistance contigs (blue bars). In the case of AMPs, significantly more resistance contigs originate from the Proteobacteria phylum (P = 0.015, two-tailed Fisher’s exact test, n = 110), while contigs originating from the Firmicutes phylum are under-represented (P = 0.033, two- tailed Fisher’s exact test, n = 110). *Significant difference between AMPs and antibiotics for a given phylum.
Table 1 | List of putative AMP resistance genes identified from our functional metagenomic screens Resistance gene Resistance gene function Classification of
resistance function Estimated source organism uniProt IDd AMP
lpxFa Lipid A 4′ -phosphatase Target alteration Parabacteroides merdae A7AEQ0 Polymyxin B,
pexiganan
lpxFb Lipid A 4′ -phosphatase Parabacteroides sp. A0A355WPL4 Polymyxin B,
pexiganan
lpxFc Lipid A 4′ -phosphatase NA A0A0F5J1Y0 Polymyxin B
arnTEF 4-amino-4-deoxy-l- arabinose modification of lipid A
E. coli MS 107-1 P76473
Q47377 P76474
Polymyxin B
pmrAB (qseBC) Response regulator Regulation Sutterella wadsworthensis
2_1_59BFAA A0A139KIR1
A0A139KIX7 Polymyxin B
pmrD Signal transduction protein E. coli MS 107-1 P37590 Polymyxin B
ompT Protease 7 precursor Agent inactivation E. coli MS 196-1 P09169 Bactenecin 5, LL37,
pexiganan
These resistance genes could be functionally annotated based on a literature-curated catalogue of resistance genes (Supplementary Table 1). NA (not available) indicates that the donor organism could not be identified based on the Human Microbiome Project Database (see Methods). aCharacterized in this work (Fig. 4b,c and Supplementary Fig. 11); annotated as undecaprenyl pyrophosphate phosphatase in Supplementary Table 6. bAnnotated as bcrC in Supplementary Table 6. cAnnotated as ybjG in Supplementary Table 10. dClosest homologues of the metagenomic hits in UniProt database.
Phylogenetic constraints on the functional compatibility of AMP resistance genes. We next directly tested whether the shortage of
AMP resistance DNA fragments from distantly related bacteria can be
explained by the low potential of genomic fragments to transfer AMP resistance phenotypes to E. coli. To this end, we constructed metage- nomic libraries from the AMP- and antibiotic-resistant microbiota
c Abundance
1001,00010,000
0 10 More
abundant Less abundant
Coriobacteriaceae Bifidobacteriaceae Streptococcaceae Lactobacillaceae Enterococcaceae Bacillaceae Staphylococcaceae Veillonellaceae Acidaminococcaceae Ruminococcaceae Lachnospiraceae Peptostreptococcaceae Eubacteriaceae Clostridiaceae Christensenellaceae Defluviitaleaceae Erysipelotrichaceae Enterobacteriaceae Aeromonadaceae Pasteurellaceae Rhodospirillaceae Alcaligenaceae Desulfovibrionaceae Synergistaceae Fusobacteriaceae Porphyromonadaceae Rikenellaceae Prevotellaceae Bacteroidaceae Verrucomicrobiaceae
Actinobacteria Firmicutes Proteobacteria Synergistetes Fusobacteria Bacteriodetes Verrucomicrobia
Faecal 7 mixUntreated Polymyxin B
LL37 Pexiganan
Bactenecin 5OmigananAmpicillin
CiprofloxacinTrimethoprimTetracyclinErythromycin
Phylum-level distribution (%)
Proteobacteria
a
b
Shannon diversity
2.5 **
*
**
**
2
AMPs ABs
1.5
1
0.5
Faecal7 mix Untreated
AMPs ABs
d
PC2: 11.2
PC1: 22.4
Resistant microbiota AMPs/ABs Transferred contigs AMPs/ABs 0.2
0.1 0 –0.1 –0.2 –0.3 0.3
–0.3 –0.2 –0.1 0 0.1 0.2 0.3 0.4 0.5
Bacteriodetes Fusobacteria
Actionobacteria Firmicutes
60 40 20 0 80 60 40 20 0
Fig. 3 | Culturing reveals that short genomic DNA fragments from the gut microbiota have a limited potential to transfer AMP resistance to E. coli.
a, Diversities of the cultured microbiota and the original faecal sample (Faecal 7 mix). Data represent Shannon alpha diversity indices at the family level based on 16S rRNA profiling of the V4 region. AMP/antibiotic (AB) treatments are colour-coded. Untreated samples were grown in the absence of any AMP or antibiotic. **Significant difference from two-sided Mann–Whitney U test, P = 0.005 for untreated versus ABs, P = 3 × 10⁻⁴ for AMPs versus ABs. Sample sizes were 5, 15 and 15 for untreated, AMPs and ABs, respectively. Central horizontal bars represent median values. b, Principal coordinate analysis plot based on unweighted UniFrac distances65, separating the AMP- and antibiotic-resistant and untreated microbial communities (P = 0.001, permutational multivariate analysis of variance test, n = 36). c, Differential abundance analyses between the untreated and AMP- and antibiotic-resistant microbiota at the family level (see Methods). Brackets depict a significant increase (red) or decrease (black) in abundance of a given family as
a consequence of AMP or antibiotic (AB) treatment based on pairwise two-sided negative binomial tests (see Methods). Sample sizes were 5 and 3–3 for untreated and AMPs and ABs, respectively. The phylogenetic tree is based on the assignment of the NCBI Taxonomy database and created using the ete3 toolkit34. d, Phylum-level distributions of resistant gut bacteria and resistance DNA contigs originating from them. Compared to their relative frequencies in the drug-treated cultured microbiota (based on colony numbers), the phylogenetically close Proteobacteria contributed disproportionately more AMP resistance (red bars) than antibiotic resistance (AB, blue bars) contigs, whereas the opposite pattern was seen for the distantly related Firmicutes.
Asterisks indicate significant interaction terms in logistic regression models: *P = 0.018 and **P = 0.003 for Proteobacteria and Firmicutes, respectively (for more details see Methods and Supplementary Table 11). Sample sizes were 22,651 and 24,336 for the total colony number of AMP-resistant and AB- resistant microbiota, respectively, and 33 and 54 for the number of transferred AMP-resistant and AB-resistant contigs, respectively.
cultures. From each AMP and antibiotic treatment, two biological replicates were generated (see Methods), resulting in 10–10 librar- ies, covering 25.6 Gb and 14 Gb DNA, respectively (Supplementary Table 9). These metagenomic libraries were next screened on the cor- responding AMP- or antibiotic-containing solid medium. Finally, the phylogenetic sources of the resulting AMP resistance and antibiotic resistance contigs were inferred with high confidence (Supplementary Fig. 10 and Supplementary Table 10). Compared to their relative frequencies in the drug-treated cultured microbiota, the phyloge- netically close Proteobacteria contributed disproportionately more AMP resistance than antibiotic resistance DNA fragments, whereas the opposite pattern was seen for the distantly related Firmicutes (Fig. 3d and Supplementary Table 11). Taken together, phylogeneti- cally diverse gut bacterial species show AMP resistance, but there is a shortage of transferable AMP resistance DNA fragments from phylo- genetically distant relatives of E. coli.
Pervasive genetic background dependence of AMP resistance genes. Finally, we present evidence that DNA fragments that confer
resistance to AMPs and were isolated from our screens show stron- ger genetic background dependence than those conferring resis- tance to antibiotics.
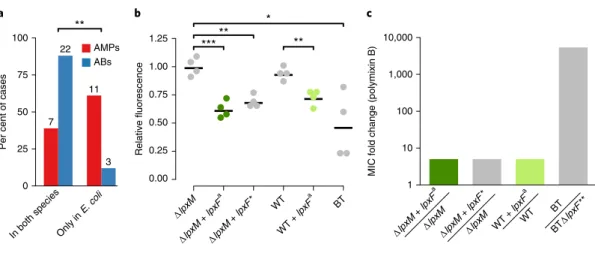
To systematically test the genetic background-dependency of AMP resistance genes, we examined how DNA fragments that pro- vide AMP or antibiotic resistance in E. coli influence drug suscep- tibility in a related Enterobacter species, Salmonella enterica. We analysed a representative set of 41 resistance-conferring DNA frag- ments derived from our screens (Supplementary Table 12) by mea- suring the levels of resistance provided by them in both E. coli and
S. enterica. Strikingly, while 88% of the antibiotic resistance DNAfragments provided resistance in both host species, only 38.9% of AMP resistance DNA fragments did so (Fig. 4a and Supplementary Table 12). Thus, the phenotypic effect of AMP resistance genes frequently depends on the genetic background, even when closely related hosts are compared.
As an example, we finally focused on a putative orthologue of a previously characterized AMP resistance gene, lpxF (ref.
12). LpxF is a key determinant of AMP resistance in Bacteroidetes, a member of the human gut microbiota. By decreasing the net negative surface charge of the bacterial cell, it provides a 5,000-fold increment in polymyxin B resistance in these species
13,29. To test the impact of one of the lpxF orthologues identified in our screen (denoted lpxF
ain Table 1) on AMP resistance in a new bacterial species, we expressed it in wild-type and a mutant E. coli strain (Δ
lpxM) as well. Similarlyto Bacteroidetes, the Δ
lpxM strain uniquely synthesizes penta-acyl-ated lipid A molecules, the natural substrate of lpxF, and is therefore especially suitable for testing the impact of the isolated lpxF ortho- logue
30. Reassuringly, surface charge measurements confirmed that the
lpxFais fully functional in E. coli (Fig. 4b and Supplementary Fig. 11). However, it provided a mere fivefold increase in polymyxin B resistance in E. coli, even in the Δ
lpxM background (Fig. 4c).Notably, unlike the previously characterized lpxF from F. novicida
30, the lpxF orthologue isolated from our screen was active both on the penta- and hexa-acylated lipid A molecules (Fig. 4b,c). Therefore, substrate specificity alone is unlikely to limit transfer of lpxF
ainto
E. coli or other Enterobacteriaceae species. The compromised resis-tance phenotype conferred by lpxF
ain the new host shows that the function of other genes is also required to achieve the high AMP resistance level seen in the donor bacterium.
Discussion
This work systematically investigated the mobility of AMP resis- tance versus antibiotic resistance genes in the gut microbiome. We report that AMP resistance genes are less frequently transferred between members of the gut microbiota than antibiotic resistance genes (Fig. 1). In principle, this pattern could be explained by at least two independent factors: shortage of relevant selection regimes during the recent evolutionary history of the gut microbiota and lack of functional compatibility of AMP resistance genes on transfer to a new host. We focused on testing the second possibility due to
∆lpxM + lpxFa
∆lpxM
∆lpxM + lpxF*
∆lpxM WT + lpxFa
WT BT
BT∆lpxF**
10,000
1,000
100
10
1
MIC fold change (polymixin B)
c a
100
75
50
25
0
Per cent of cases
AMPs ABs
**
7 22
11
3
b
0.00 0.25 0.50 0.75 1.00 1.25
Relative fluorescence
Only in E. coli In both species
BT
WT + lpxFa WT
∆lpxM + lpxF*
∆lpxM + lpxFa
∆lpxM
** *
*** **
Fig. 4 | AMP resistance DNA fragments provide host-dependent phenotypic effects. a, A significantly lower proportion of AMP resistance DNA fragments (AMPs, red bars) conferred resistance in both E. coli and S. enterica compared to antibiotic resistance DNA fragments (ABs, blue bars), suggesting weaker between-species conservation of the AMP resistance phenotypes. Asterisks indicate significant difference, P = 0.0011, two-sided Fisher’s exact test, n = 16 for AMPs, n = 25 for ABs. b, The lpxF orthologue from P. merdae, isolated in our screen (marked as lpxFa here and in Table 1;
represented in green) and a previously characterized fully functional lpxF from Francisella novicida61 (marked as lpxF*) decrease the net negative surface charge of ∆lpxM E. coli to a similar extent, and close to the level of wild-type Bacteroides thetaiotaomicron (BT) expressing its native lpxF. LpxFa has a similar effect both in ∆lpxM and wild-type E. coli (dark and light green dots). The fluorescence signal is proportional to the binding of the fluorescein isothiocyanate (FITC)-labelled poly-l-lysine polycationic molecules. Less poly-l-lysine binding reflects a less negative net cell surface charge62. Significant differences: *P = 0.03, **P = 0.001 and ***P = 0.0004, respectively, Welch’s two-sample t-test, n = 4 biological replicates; central horizontal bars represent mean values. Corresponding microscopic pictures are shown in Supplementary Fig. 11. c, LpxFa increases polymyxin B resistance of both ∆lpxM and wild- type E. coli only fivefold (dark and light green bars) (n = 3), to the same extent as LpxF from F. novicida (marked as lpxF*) (n = 3). In contrast, lpxF in its original host, B. thetaiotaomicron (marked as lpxF**) provides a 5,000-fold increment in polymyxin B resistance13.
its experimental tractability and relevance to forecast the mobility of resistance genes upon AMP treatment. In a series of experiments, we showed that phylogenetically diverse gut bacteria display high levels of AMP resistance (Fig. 3), yet the underlying resistance genes individually often fail to confer resistance upon transfer to E. coli (Figs. 2 and 3). Furthermore, we demonstrated that the AMP resis- tance conferred by 1.5–5 kb genomic fragments often depends on the genetic background of the recipient bacterium (Fig. 4). Together, these results support the notion that horizontal acquisition of AMP resistance is constrained by phylogenetic barriers owing to func- tional incompatibility with the new host cell
31.
An important issue is whether the simultaneous transfer of multiple AMP resistance genes carried by longer DNA segments is feasible and can provide resistance to recipient bacteria. While this is certainly a realistic possibility, bioinformatic analyses sup- port the conclusions derived from the metagenomic screens: AMP resistance genes are relatively rare in the mobile gene pool and on plasmids in nature (Fig. 1).
We speculate that the large differences in functional compatibil- ity between antibiotic resistance and AMP resistance genes might be caused by the latter being more often part of highly intercon- nected cellular subsystems, such as cell envelope biosynthesis path- ways. We note that the compromised benefit may not be the only manifestation of functional incompatibility and the exclusive rea- son for the limited presence of AMP resistance genes in the mobile gene pool and on plasmids (Fig. 1). It is also plausible that some AMP resistance genes have severe deleterious side effects in the new host in addition to conferring a compromised resistance. For example, the introduction of lpxF into bacterial pathogens reduces virulence in mice, probably because it perturbs the stability of the bacterial outer membrane in enterobacterial species
32. Future works should elucidate whether AMP resistance genes are especially prone to induce deleterious side effects compared to antibiotic resistance ones. Clearly, deciphering the biochemical underpinnings of func- tional incompatibility of AMP resistance genes remains an area for future research.
Our results also provide mechanistic insights into the functional capacity of AMPs to control the composition and stability of the gut microbiome over evolutionary timescales. Specifically, as phy- logenetic barriers limit the horizontal transfer of AMP resistance mechanisms, the exact dosages and combinations of AMPs could prove to be critical for the long-term advantage of gut bacterial spe- cies involved in human health. Indeed, our work indicates that spe- cific AMP stresses can lead to an increase in the amount of bacteria linked to ulcerative colitis (Desulfovibrionaceae).
Another important and unresolved issue is why natural AMPs that are part of the human innate immune system have remained effective for millions of years without detectable resistance in sev- eral bacterial species. One possibility, supported by our work, is that the acquisition of resistance through horizontal gene transfer from human gut bacteria is limited, most probably due to compromised functional compatibility in the recipient bacteria. We do not wish to claim, however, that AMPs in clinical use would generally be resistance-free. In agreement with the prevalence of polymyxin B resistance DNA fragments (Fig. 2a), a plasmid conferring colistin resistance is spreading globally
33. Rather, our work highlights major differences in the frequencies and mechanisms of resistance across AMPs, with the ultimate aim to identify antimicrobial agents less prone to resistance.
Methods
Establishing a comprehensive AMP resistance gene data set. Even though several databases have been created for antibiotic resistance genes, a comprehensive list of AMP resistance genes has not been compiled so far. We therefore carried out a systematic literature mining in PubMed NCBI and Google Scholar with the keywords ‘antimicrobial peptide’ + ‘resistance’. From the identified publications, genes with experimentally confirmed influence on AMP susceptibility were
included in our manually curated AMP resistance gene data set (Supplementary Table 1). Altogether, 138 AMP resistance genes were identified. As a next step, the compiled AMP resistance genes were classified into resistance gene families (orthologous gene groups or orthogroups) using EggNOG-mapper software (version 0.12.7) on the bacterial EggNOG 4.5.1 database34. Then, AMP resistance genes were classified into broad functional categories analogous to the classification of antibiotic resistance genes in The Comprehensive Antibiotic Resistance Database (CARD)35. To obtain a comparable data set for known antibiotic resistance genes we downloaded the CARD database35. Genes associated AMP resistance in CARD were filtered out and the remaining antibiotic resistance genes from CARD were grouped into resistance gene families in the same way as AMP resistance genes using the EggNOG database (Supplementary Table 1).
Analysis of the mobile gene pool of the gut microbiota. A previously published mobile gene catalogue of the human gut microbiota15 was analysed to compare the patterns of horizontal gene transfer events involving AMP and antibiotic resistance genes across a wide range of bacteria. This mobile gene catalogue relies on the identification of nearly identical genes in distantly related bacterial genomes and thereby provides a snapshot of the gene set subjected to recent horizontal gene transfer events in a representative sample of the gut microbiota. The goal in our analysis was to determine the presence/absence pattern of the AMP and antibiotic resistance genes not only in the mobile gene pool but also in the 567 genomes from which the mobile gene pool was derived. In this way, not only the horizontally transferred resistance genes were identified but also those that have not been detected in such transfer events, but were present in the gut microbiome.
To this end, the genomes and proteomes used by Brito and colleagues15 were downloaded from the Human Microbiome Project (HMP) database (https://www.
hmpdacc.org/HMRGD/) and from the Fijicomp website (http://www.fijicomp.
org). DNA sequences derived from the latter database were used for open reading frame (ORF) prediction with Prodigal software (version 2.6.336). Then, a sequence similarity search was applied to the compiled list of proteins encoded in the analysed genomes to identify those that were present in the mobile gene pool as well. The sequence similarity search between the mobile gene pool and the proteins from the genomes was carried out with the BLASTX option of Diamond software (version 0.9.1037) with 50% sequence coverage and 100% sequence identity (parameters were chosen to reproduce the original publication of the mobile gene pool15). Of the 37,870 unique mobile genes in the mobile gene pool, we identified 37,184 in the genomes (98.28%).
Next, both the antibiotic and AMP resistance genes were identified among the mobile genes and among those that have not been detected in the mobile gene pool but were present in the genomes. For this functional annotation, a BLAST search was carried out against the antibiotic resistance genes from the CARD database with the BLASTP option of the Diamond software with strict parameters (e-value < 10−5, > 40% identity at the protein level and 80% query sequence coverage) (Supplementary Table 2). In a similar vein, AMP resistance genes were identified by performing a BLASTP sequence similarity search against the manually curated list of AMP resistance genes (Supplementary Table 1). Antibiotic and AMP resistance genes in our databases were classified into resistance gene families by the EggNOG-mapper software on the bacterial EggNOG database (Supplementary Table 2). For the annotated resistance gene list in the mobile gene pool, see Supplementary Table 3.
To compare the relative frequency of the AMP and antibiotic resistance genes in the mobile gene pool (Fig. 1a), we restricted the analysis to one genome per species. This was necessary to avoid sampling bias because different species were represented by unequal numbers of genomes in the data set. To this end, 16S rRNA sequences were determined for each genome (for HMP genomes they were downloaded from the Silva database38, and for Fijicomp genomes they were identified directly in the genomes using RNAmmer software (version 1.239). Then, genomes with fewer than 2% 16S rRNA gene dissimilarities were collapsed into genome groups (‘species’ or OTUs) using average linkage clustering as described in the publication of the mobile gene pool15. Each such genome group was represented by one randomly chosen genome for the statistical analysis presented in Fig. 1a (note that the random sampling was repeated 100 times, yielding an estimate of standard error). Resistance genes in the mobile gene pool that resulted in a BLAST hit both from the AMP and the antibiotic resistance databases were excluded from the analysis. The remaining resistance genes annotated in the mobile gene pool were counted and plotted as the percentage of the total number of annotated resistance genes in the genome sequences (‘All bacteria’ from Fig. 1a). Additionally, the analysis was separately performed for the Gram-negative and Gram-positive bacterial genomes as well (‘Gram-positive’ and ‘Gram-negative’ in Fig. 1a). For the network representation of the mobile gene pool, we used Cytoscape40.
For each unique mobile AMP or antibiotic resistance gene we also estimated the minimum number of independent transfer events (Fig. 1b) by counting the number of genome groups (that is, OTUs) in which the gene is present in the mobile gene pool16 (Supplementary Table 3).
Identification of homologues of the literature-curated AMP resistance and antibiotic resistance genes in naturally occurring plasmid sequences and in ICEs. For the identification of plasmid-encoded AMP resistance genes, we
used two independent databases: a plasmid-encoded protein database from the NCBI Reference Sequence Database (Refseq)41 (ftp://ftp.ncbi.nih.gov/refseq/
release/plasmid/) and a curated plasmid database containing 2,097 entire plasmid sequences from the Enterobacteriaceae bacteria42 (https://figshare.
com/s/18de8bdcbba47dbaba41). From the Refseq database, protein sequences were downloaded and both the antibiotic and AMP resistance proteins were identified with the BLASTP algorithm using our literature-curated lists of resistance genes.
Hits were accepted only if they showed > 40% sequence similarity over 80% of the length of the subject protein, with an e-value less than 10−5. Because this Refseq data set contains plasmid-encoded proteins from various sources in addition to the human microbiota, we filtered our hits using a previously compiled list of species from the human microbiota43. Thus, only those resistance gene hits were retained that are present on plasmids from human-associated bacteria. From the Enterobacteriaceae-specific plasmid database, we downloaded the translated nucleotide sequences for all six reading frames and carried out the similarity search as above using BLASTP with 80% query coverage, and > 40% sequence identity. For this data set, we manually checked the presence of the plasmid-encoded resistance genes in the human microbiome using the NCBI database (Supplementary Table 4). Finally, we took the union of these two data sets to calculate the percentage of resistance genes residing on plasmids (Fig. 1d).
To estimate the species-level distribution of the plasmid-encoded resistance proteins we used the Refseq data set only as it gives information on the identity of species from which the plasmids were isolated. Specifically, for each AMP and antibiotic resistance gene that resulted in plasmid-encoded homologues, we counted the number of species that bore at least one plasmid-encoded homologue of the given AMP and antibiotic resistance gene (Fig. 1e).
For the identification of AMP resistance genes that are associated with ICEs, we used a database that contains 16,820 cargo genes associated with ICE sequences from human gut bacterial genome sequences (Intestinal Microbiome Mobile Element Database, https://immedb.org/)44. Nucleotide sequences were downloaded and, following translation of the sequences with the tBLASTn algorithm, both the antibiotic and AMP resistance proteins were identified using our literature- curated lists of resistance genes with the same BLAST parameters as before (> 40%
sequence similarity over at least 80% of the length of the subject protein). Because the literature-curated lists of resistance genes contain proteins from various sources in addition to the human gut microbiota, only those homologues were considered in the set of non-ICE-associated resistance genes that were detected in the genome sequences of the HMP database (Supplementary Table 4).
Construction of gut metagenomic libraries. To sample the gut resistome, we applied a previously established small-insert shotgun metagenomic protocol11 with small modifications. This method identifies small genomic fragments that decrease drug susceptibility when random genomic fragments are expressed from a multicopy plasmid with an inducible promoter. For the construction of the metagenomic libraries, human stool samples were obtained from two healthy unrelated individuals who had not taken any antibiotics for at least one year before sample donation. Throughout the entire study we complied with all relevant ethical regulations. The protocol related to human faecal sample collection was approved by the Ethical Review Board of the Albert Szent-Györgyi Health Centre, University of Szeged (approval ID: 42/2017-SZTE). Written informed consent from each participant was obtained before faecal sample collection. Protocols related to human faecal sample handling were approved by the Ministry of Agriculture (Hungary) (approval ID: TMF/146-9/2017). Gut community DNA was isolated immediately after sample donation using the ZR Fecal DNA MiniPrep kit (Zymo Research) according to the manufacturer’s instructions (http://www.zymoresearch.
com/downloads/dl/file/id/91/d6010i.pdf). Subsequently, 10 µ g of metagenomic DNA from each sample was partially digested with 0.25 U MluCI restriction enzyme (New England BioLabs) in 10× CutSmart Buffer (New England BioLabs) at 37 °C for 20 min, followed by heat inactivation at 85 °C for 20 min. MluCI is a four- base cutter restriction enzyme that produces overhangs complementary to the ones that EcoRI produces. By varying the incubation time or the enzyme concentration, the size range of the resulting DNA fragments can be set. The fragmented DNA was size selected by electrophoresis on a 1% (mass/volume) agarose gel in 1×
Tris-acetate-EDTA (TAE) buffer. A gel slice corresponding to 1,500–5,000 bp was excised from the gel and DNA was isolated using a GeneJET Gel Extraction and DNA Cleanup Micro Kit (Thermo Scientific). pZErO-2 plasmid DNA (5 µ g;
ThermoFisher) was digested with 25 U EcoRI restriction enzyme (Fermentas) in 10× EcoRI Buffer (Fermentas) for 2 h, followed by 20 min heat inactivation at 65 °C. After purification with a DNA Clean & Concentrator-5 kit (Zymo Research), digested pZErO-2 plasmid was dephosphorylated with FastAP alkaline phosphatase (Thermo Scientific) as follows: 4 µ g plasmid DNA was incubated with 4 U enzyme in 10× FastDigest buffer at 37 °C for 1 h, followed by 5 min heat inactivation at 74 °C and purification with DNA Clean & Concentrator-5 kit (Zymo Research). DNA was ligated into pZErO-2 at the EcoRI site using the Rapid DNA ligation kit (Thermo Scientific). The ligation reaction was performed in 15 µ l total volume using a 5:1 insert–vector ratio: 4.5 µ l (310 ng) digested and gel purified DNA insert, 0.65 µ l (62 ng) EcoRI-cut pZErO-2 vector, 3 µ l 5× ligation buffer, 0.75 µ l 10 mM ATP, 4.1 µ l dH2O, 2 µ l T4 DNA ligase (5 U μ l−1). The ligation mixture was incubated at 16 °C overnight, followed by heat inactivation at 65 °C for 10 min.
Before transformation, the ligation mixture was purified with DNA Clean
& Concentrator-5 kit (Zymo Research). A 3.5 µ l volume of the resulting ligation mixture was transformed by electroporation into 50 µ l of electrocompetent E. coli DH10B cells (Invitrogen). Electroporation was carried out with a standard protocol for a 1 mm electroporation cuvette. Cells were recovered in 1 ml SOC medium, followed by 1 h incubation at 37 °C. A 500 µ l volume of the recovered cells was plated onto square Petri dishes containing Luria Bertani (LB) agar supplemented with 50 µ g ml−1 kanamycin. To assess the library size (number of colony-forming units, c.f.u.), 1 µ l of the electroporated cells was saved for plating onto a separate Petri dish containing Luria Bertani (LB) agar supplemented with 50 µ g ml−1 kanamycin. From each plate, 10 clones were randomly picked for colony PCR to confirm the presence and the size distribution of the inserts. PCR was performed using the Sp6-T7 primer-pair (Supplementary Table 13) flanking the EcoRI site of the multiple cloning site of the pZErO-2 vector. The sizes of the PCR products were determined by gel electrophoresis and the average insert size was calculated to be 2–3 kb. The size of each library was determined by multiplying the average insert size by the number of total c.f.u.s. The size distributions of the libraries varied between 4.4 and 16 Gb coverage with this protocol, which is in line with a previously published state-of-the-art protocol11,18. The resulting colonies from the Petri dishes were collected and the plasmid library was isolated using an InnuPREP Plasmid Mini Kit (Analytic Jena). Between 30 and 60 ng of isolated plasmid library was transformed by electroporation into 40 µ l electrocompetent E. coli BW25113 (prepared as described in ref. 44). This E. coli strain was used for the functional selections (see next section). After electroporation, cells were recovered in 1 ml of LB medium for 1 h at 37 °C. Special care was taken to achieve high electroporation efficiency to cover 10–100 times the original library size. In this way, we ensured that most library members were electroporated from the plasmid library.
The 1 ml recovered cell culture was added to 9 ml of LB medium supplemented with 50 µ g ml−1 kanamycin, and grown at 37 °C for 2–3 h until it reached the 7.5 × 10⁸ to 10 × 108 cell density (optical density at 600 nm (OD600 of 1.5–2). Cell aliquots were frozen in 20% glycerol and kept at − 80 °C for subsequent functional selection experiments.
Metagenomic libraries were generated from the uncultured microbiota (the total DNA extracted from the stool samples) and also from the cultured microbiota (the genomic DNA extracted from the cultured pooled microbiota). For details see the section ‘Cultivation of the gut microbiota under anaerobic conditions and DNA extraction’.
Functional metagenomic selections for AMP resistance and antibiotic resistance genes. Functional selections for resistance were carried out on solid plates containing one of the 12 antimicrobial peptides or 11 antibiotics (Supplementary Table 5). Instead of the plating assay commonly used in the field11, we applied a modified gradient plate assay45 where bacteria are exposed to a concentration gradient of the antimicrobial instead of a single concentration.
We found that this strategy improves the reproducibility of AMP selections, where changes in the resistance levels are relatively small compared to that in the case of antibiotics. The growth medium in these plates was a modified minimal salt medium (MS) with reduced salt concentration (1 g (NH4)2SO4, 3 g KH2PO4, 7 g K2HPO4, 100 µ l MgSO4 (1 M), 540 µ l FeCl3 (1 mg ml−1), 20 µ l thiamine (50 mg ml−1), 20 ml casamino acids (BD) (10% (mass/volume), 5 ml glucose (40% (mass/volume)) in a final volume of 1 l), because most AMPs are not effective in vitro in the presence of high salt concentrations. In the case of the AMP- containing plates, the solidifying agent was changed to 1.5% (mass/volume) low melting point agarose (UltraPure LMP Agarose, Invitrogen) from 1.5% (mass/
volume) agar to prevent any heat-induced structural damage of the peptides during plate pouring. Antibiotics and AMPs were purchased from Sigma and ProteoGenix, respectively. Onto each of the gradient plates (Tray plates, SPL Life Sciences) 2 × 10⁸ cells were plated out from the thawed stocks of E. coli BW25113 bearing the metagenomic plasmid libraries. In this way, each metagenomic library member was represented about 10–100 times on each plate. We found this necessary for good reproducibility of our experiments. Subsequently, plates were incubated at 30 °C for 24 h. For each functional selection, a control plate was prepared with the same number of E. coli BW25113 plated out. These cells contained the pZErO-2 plasmid with a random metagenomic DNA insert that has no effect on AMP and antibiotic resistance. This control plate showed the minimum inhibitory concentration (MIC) of the antimicrobial without the effect of a resistance plasmid. The empty plasmid was not applicable as a control because in the absence of a DNA insert the CcdB toxic protein is expressed from the plasmid. To isolate the resistant clones from the library plates, sporadic colonies were identified above the MIC level (defined using the control plate) by visual inspection. These clones were collected by scraping them into 2 ml LB broth and then stored at − 80 °C.
Validation of the resistance-conferring metagenomic DNA fragments. Following selection of the metagenomic libraries, the putative resistance phenotypes conferred by the plasmid selections were confirmed for a representative fraction of the colonies. From each selection at least 20 colonies were picked and the MIC increase was determined by a standard broth microdilution method46, as described in the section ‘Quantification of the resistance gains that metagenomic